by David Wesley | Jan 21, 2019 | Inflation
More and more investors are growing alarmed at what they see as the steady attack on the value and stability of the dollar. Between rising annual federal deficits and the over $21 trillion total U.S. federal debt time bomb, the future of the dollar and dependably low inflation is no longer a sure and certain ultimate outcome. This is why sensible investors are hedging their portfolios against both dollar devaluation and risks of significantly higher inflation. Here we look at seven solid choices to accomplish both of these goals.
Gold and Silver Bullion

It often comes as a shock to many investors to learn that studies on investments outperforming inflation show gold only outpaces the inflation genie some 54 percent of the time. This is not a fair result though. In cases where hyperinflation or substantial currency devaluation becomes the order of the day, gold (and silver too) massively outdoes inflation. In environments with high and continuous inflation, you need a prolonged depth of exposure to gold.
The surest way to reliably own gold is in the physical bullion form of it. The key is to obtain and store it in the least expensive way possible. What you need when you opt for this most secure form of gold and silver are the most broadly minted, traded, and liquid forms of bullion. This means that your top choices should nearly always be American Eagles, Canadian Maple Leafs, Vienna Philharmonics, or the British Britannia. All are popular, easy to sell in nearly all countries around the world, and come with low premiums (and discounts) over spot bullion prices.
When you are looking to make some of the smartest investments in gold, you should consider a Gold IRA. It is critically important to use a reputable Gold IRA company. These three companies will steer you in the right direction and help you to pick out the best tax-advantaged gold products possible for your situation.
Gold and Silver ETFs
Some people are more concerned about low entry and exit fees, highest liquidity, instant saleability, and split-second diversification. In these cases, Gold and Silver ETFs may be your best option for hedging against devaluing dollars and inflation. The truth about these various ETFs is that not all of them were created equal.
The best performing ETFs are those that are most closely correlated to the underlying price of gold. The least desirable ETFs have baskets of gold miner stocks, which consistently do not closely match up in performance to the underlying price of gold (or silver). Individual gold company stocks introduce a variety of risks to the equation, such as possible corporate quarterly losses, financial bankruptcy potential, and strikes at or seizure of mines and other valuable assets around the globe. All of these risks can lead to a wide divergence between the performance of gold and the price of a Gold ETF made up of gold mining stocks.
Analysts generally recommend one of two Gold ETFs that deliver the goods. These are the SPDR Gold Trust ETF trading under the appropriate symbol of GLD and the ETF iShares Gold Trust trading as IAU. These two ETFs are not dealing in any shady derivatives or even futures contracts on the underlying metals. They actually purchase the appropriate physical quantities of their commodities to match the trading price of underlying gold (and silver) as precisely and safely as possible. Since the two funds own their physical gold outright, their performances nearly mirror gold and silver price movements. The two companies boast nearly the same risk to return profiles and ratios. Their ten year betas amount to .47 and .49 respectively.
Commodities
As inflation rises and accelerates, commodities’ prices tend to rise apace. This makes them an ideal protection from the inflationary effects. There are not that many assets which gain from higher inflation, especially inflation that is unexpected. Commodities are a notable exception. As demand for services and goods rise, this typically pushes the costs of the services and goods higher, along with their underlying commodities prices for those goods utilized within them. It is the commodities futures markets that serve the role as ongoing clearing houses and auction markets for latest supply and demand information.
One thing to keep in mind with commodities is that they remain among the most volatile asset classes on the markets. They do provide higher returns in inflationary and devaluation environments, but this comes at the cost of a higher risk (in the form of standard deviation) than with standard equity investments (stocks). The key in most cases is to include commodities in an asset portfolio that is already significantly less volatile. This would decrease the all around risk to portfolio from negative correlation while often boosting the overall anticipated return.
Investing in commodities futures requires a great deal of background, some expertise, and ultimately nerves of steel. Generally only accredited or sophisticated investors meet the tests of this harder form of investing. Mutual funds provide a more suitable means of getting involved in them for the majority of investors. Alternatively, natural resources funds purchase firms that are involved with the production or mining of commodities. There are also raw commodities funds that buy into derivatives based upon commodities and back them up with fixed income investments.
The key is to be careful that you are not simply buying into mutual funds full of resource producing companies, which does not give you the real diversification you are seeking away from equities. Two solid ideas for direct commodity investments are the PIMCO Commodity Real Return Strategy Fund and the Oppenheimer Real Assets Fund that trades based upon the GSCI commodities index. There are also a range of new ETFs using the commodities indices as their underlying instruments which will be launched in the future or are imminent to be launched.
Remember that commodities have beaten inflation in an impressive 66 percent of instances. This is especially the case with the iShares S&P GSCI Commodity Index Trust.
Cryptocurrencies
The newest way to hedge against inflation and especially against dollar devaluation is using the cryptocurrencies like Bitcoin and Ethereum. The cryptos are a technologically cutting edged way for retaining your purchasing power. They have become particularly popular in two jurisdictions: ones with astronomical or runaway inflation like Venezuela and Argentina, and those that have capital controls like North Korea, South Africa, and China. In countries such as these with prolonged bleak outlooks, cryptocurrencies are an idea that could not come along soon enough.
This is especially the case because cryptocurrency wallets provide 24 hours per day, 7 days per week access to this electronic form of money that knows no borders. Back in Cyprus in 2013, the Cypriot Central Bank announced 100 euros per day ATM withdrawal limits. Greece went harsher with 60 euros per day in 2015. No matter how great your personal savings may have been, without access to your funds, it is irrelevant. You could lie helpless in a hospital room unable to be discharged for not paying a bill as you can not gain access to your own money.
The dawn of cryptocurrencies changed this. Citizens of crisis-stricken national economies finally found a credible and viable means of escaping from their national borders that had served as financial prisons. Farmers in Cuba may not be able to pack up and leave, nor factory workers in Iran or North Korea, but thanks to cryptocurrencies they can at least rest easy knowing that their money is continuously stored outside of the reach of their country’s central bank and regulatory agencies.
Real Estate
In this case, we use Real Estate to speak specifically about vehicles for holding commercial properties. This one of a kind investment class is both a hard asset that holds its intrinsic value well in inflationary and devaluation periods as well as an income-producing asset in the form of office spaces being leased out to tenants. The income-producing element pays out regularly in the form of dividends to the investors. This is why real estate has a long-term historical appeal to investors who are seeking a credible means of hedging their holdings against prolonged periods and bouts of inflation.
Real Estate equity and real estate investment trusts beat out inflation in an impressive 69 to 71 percent of real-world scenarios. Gaining a well-diversified exposure to such real estate with a reasonable expense ratio is imminently possible even for smaller retail investors, thanks to the Vanguard REIT ETF. For a comparable mortgage property residential REIT, you might opt for the Market Vectors Mortgage REIT Income ETF.
Barclays Aggregate Bond Index
Bonds may not be a vehicle that most investors think of for beating out inflation and currency devaluation, but their track record is impressive. A great barometer of this category is the bell weather Barclays Aggregate Bond Index. It beats out inflation in an impressive 75 percent of cases. You can track the index with an investment in the iShares Core U.S. Aggregate Bond ETF.
TIPS
Americans have a unique Treasury option in the TIPS. These are Treasury Inflation Protected Securities. Specifically indexed to the American CPI inflation index, these Treasury instruments provide a way to protect your portfolio from inflation and its ravages. TIPS are so effective that they outperform inflation in 80 percent of scenarios. It makes the TIPS the leading out-performing category of investments.
You have three different Exchange Traded Funds to choose from to get involved in these TIPS on a highly liquid scale. Two of them track the Barclays U.S. Treasury Inflation Protected Securities Index. The third follows the iBoxx Three Year Target Duration TIPS Index.
Leveraged Loans
A non-traditional investment that fares very well in periods of inflation is the category of leveraged loans. They provide low duration risk as well as a lower correlation to investment grade bonds.
There are other advantages to leveraged loans, such as comparatively attractive yields, improved diversification, lesser volatility versus equities, and the possibility of producing powerful risk-adjusted returns. Thanks to improved credit conditions, defaults should remain under average for the leveraged loan market for the foreseeable future at least.
These leveraged loans outperform inflation in an incredible 79 percent of cases. A way to invest in them with safety and liquidity is through the PowerShares Senior Loan ETF.
In Conclusion
There is no good reason to be a prisoner of either excessive inflation or ruinous currency devaluation. Thanks to these seven credible inflation busting investments, you can both realize gains and sleep easier at night, knowing that your portfolio is effectively hedged. The additional advantage of gaining more effective and comprehensive diversification is only additional icing on your investment cake.
by Emily Cross Leon | Dec 15, 2015 | In the news, Inflation
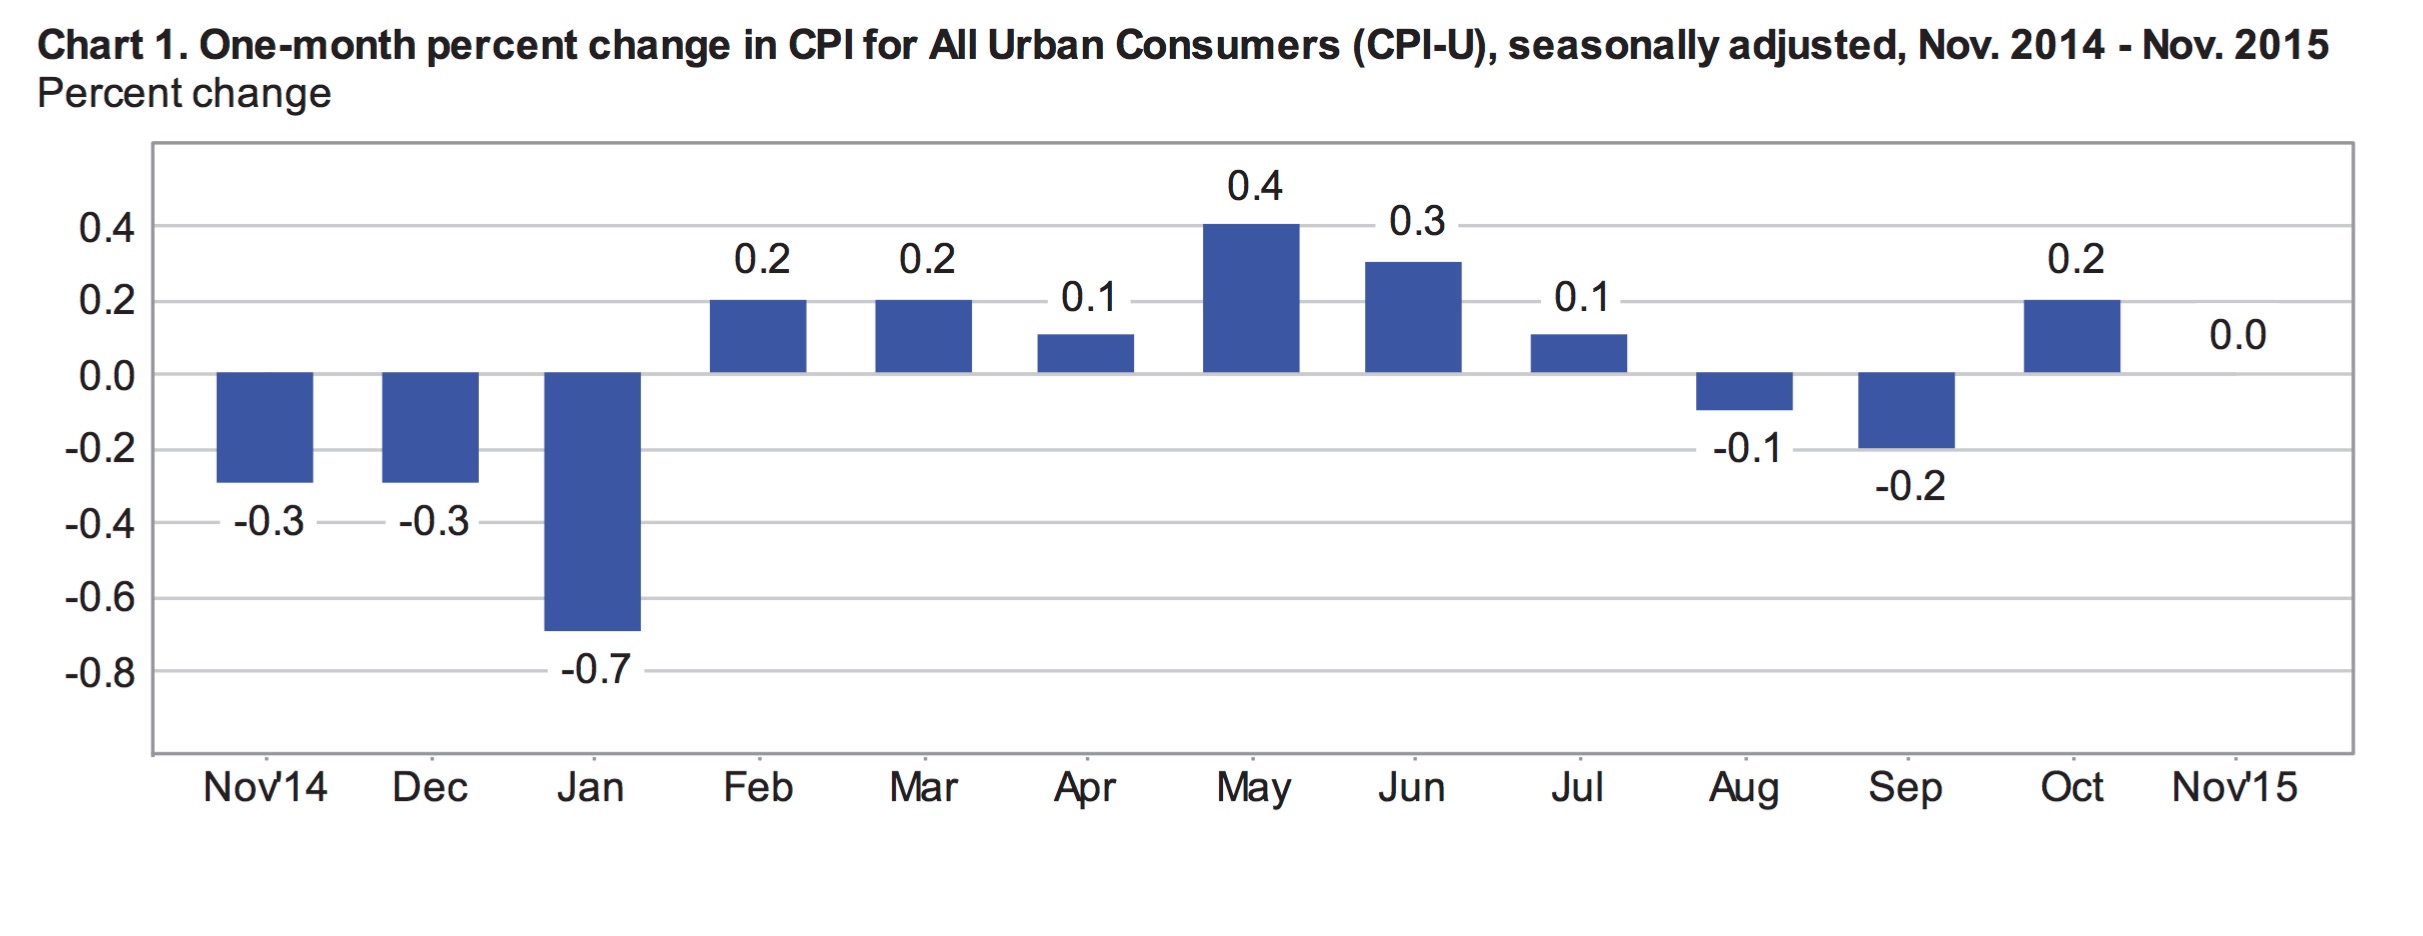
This morning, the Bureau of Labor Statistics released consumer inflation numbers for November. The Consumer Price Index for all Urban Consumers (CPI-U) was unchanged for the month following seasonal adjustments. This is what most analysts had expected. As the chart below illustrates, net inflation since July remains flat. November saw declines in energy and food costs offset by higher prices for shelter and medical care services. For the 12-months ending in November, the headline index rose an unadjusted 0.5%, the highest annual inflation number since 2014.
Excluding food and energy, seasonally adjusted core prices rose 0.2% in November, which was also what most analysts had forecast. Adjusted core prices have increased by 0.2% for three months in a row and have stayed between 0.1% and 0.3% throughout 2015. For the year ending in November, core inflation was 2%.

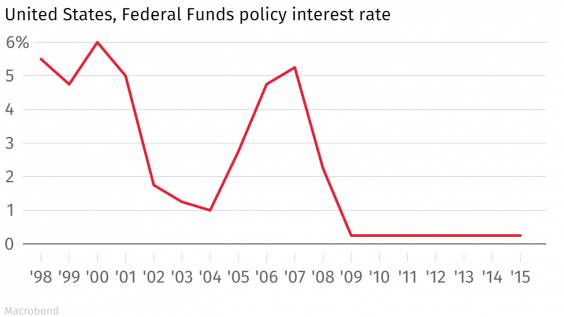
These numbers point to underlying inflationary pressure and support the Federal Reserve’s highly anticipated rate hike, which will likely be announced tomorrow following their meeting. The Fed has kept interest rates at 0.25% since 2009.
November’s Inflation
Overall, seasonally adjusted prices were flat in November as declines in the indexes for food and energy were offset by higher prices for shelter, transportation services and medical services. The index for all items less food and energy climbed a seasonally adjusted 0.2% in November, in line with expectations. The more volatile food and energy indexes were down 0.1% and 1.3% respectively, after seasonal adjustments.
Seasonally Adjusted Monthly % Change in CPI-U by Category (2016)
| January | February | March | April | May | June | July |
| All Items | 0 | -0.2 | 0.1 | 0.4 | 0.2 | 0.2 | 0.0 |
| Food | 0 | 0.2 | -0.2 | 0.2 | -0.2 | -0.1 | 0.0 |
| Energy | -2.8 | -6.0 | 0.9 | 3.4 | 1.2 | 1.3 | -1.6 |
| Gasoline | -4.8 | -12.5 | 2.2 | 8.1 | 2.3 | 3.3 | -4.7 |
| Fuel Oil (non seasonally adjusted) | -6.5 | -2.9 | 1.7 | 1.9 | 6.2 | 3.7 | -1.5 |
| Electricity | -0.7 | -0.2 | 0.4 | -0.3 | -0.2 | -0.5 | 0.5 |
| Utilities (piped gas service) | -0.6 | 1.0 | -0.7 | 0.6 | 1.7 | -0.4 | 3.1 |
| Energy Services | -0.7 | 0.1 | 0.2 | -0.1 | 0.2 | -0.5 | 1.0 |
| All Items Less Food and Energy | 0.3 | 0.3 | 0.1 | 0.2 | 0.2 | 0.2 | 0.1 |
| Services Less Energy Services | 0.3 | 0.3 | 0.2 | 0.3 | 0.4 | 0.3 | 0.2 |
| Shelter | 0.3 | 0.3 | 0.2 | 0.3 | 0.4 | 0.3 | 0.2 |
| Transportation Services | 0.4 | 0.2 | 0.2 | 0.7 | 0.3 | 0.3 | -0.2 |
| Medical Care Services | 0.5 | 0.5 | 0.1 | 0.3 | 0.5 | 0.2 | 0.5 |
The monthly decline in the food index is its first drop in 8 months. The index for food at home fell 0.3% in November. Aside from fruits and vegetables, which were 0.6% higher for the month, every other component of the index for food at home fell. Prices for meat, fish, poultry and dairy products continue to decline. However, the adjusted index for food away from home climbed 0.2% in November.
The decline in the energy index resulted from lower gas prices, down a seasonally adjusted 2.4% in November. Gas prices have been very volatile in 2015, falling over 18% in January and climbing over 10% in May. Shelter costs continue to rise steadily, up 0.2% in November following increases of 0.3% in September and October. Prices are also rising steadily in the service sectors, up 0.3% for the third month in a row. Transportation and medical care services were up 0.6% and 0.4% respectively.
Annual Inflation
For the 12-months ending in November, unadjusted prices were up 0.5% overall. The increase in overall price levels was largely driven by higher shelter costs, which account for 33.2% of the overall index. Unadjusted shelter costs were 3.2% higher over the 12-month period. The index for rental costs (primary residence) climbed 3.6% during the year, while moving expenses were 7.1% higher.
Food prices, which account for about 14% of the overall index, were up 1.3% for the year ending in November. The index for food at home, which is about 60% of the overall food index was only up 0.3% year over year. This marks its smallest annual increase in over 5 years. The prices for meat, fish, poultry and eggs are all down year over year while the prices for bread, fruits and vegetables are higher. The index for food away from home climbed 2.7%. A significant hike (4.9%) in the index for food at employee sites and schools was the primary reason for higher costs for food away from home.
The energy index makes up approximately 7.4% of the CPI-U and about half of the energy index is energy commodities and the other half energy services. For the year ending in November, the overall energy index fell 14.7% including a 24.2% decline in energy commodities and a 2.8% decline in energy services. Among the energy commodities, the index for fuel oil had the largest decline, down 31.4% for the year. Over the same 12-months, the index for gasoline (all types) fell 24.1%.
Outlook
It is highly expected that the Federal Reserve will raise interest rates by a quarter of a percentage point on Wednesday. According to the Wall Street Journal, 97% of economists surveyed expect the fed to raise rates this week. This would be the first rate hike in nearly a decade as the economy and employment appear to finally be returning to solid ground.
What remains largely an unknown at this point is the pace of future rate hikes. This will largely be a function of inflation expectations. With overall inflation continuing to lag well below the Fed’s target, the pace of future rate hikes may likely be slow. According to David Jones, chief economist at DMJ Advisors:
“The stronger dollar and falling oil prices [may] have masked some underlying inflation[ary] pressures which could surface quickly as we move closer to full employment.”
by Emily Cross Leon | Nov 17, 2015 | In the news, Inflation, Monthly CPI Updates
The BLS released October’s inflation data this morning and there were no major surprises. The Consumer Price Index for All Urban Consumers (CPI-U) climbed a seasonally adjusted 0.2% in October following a decline of 0.2% in September. This is in line with consensus expectations. Year over year, the CPI-U was up 0.2% at the end of October, which is well below the Fed’s annual inflation target rate of 2%. According to a recent Federal Reserve press release:
“Inflation has continued to run below the Committee’s longer-run objective, partly reflecting declines in energy prices and in prices of non-energy imports.”
Core inflation, which excludes food and energy, increased 0.2% in October, following a 0.2% increase in September. For the year ending in October, core inflation was 1.9%. Outside of the volatile energy index, which was down over 17% for the 12-months ending in October, consumer prices appear to be climbing at a steady pace only marginally below the Fed’s target.

October’s Seasonally Adjusted Inflation
October’s 0.2% climb in consumer prices was largely driven by modest increases in the energy index, which rose 0.3% following a decline of 4.7% in September. Gas prices were up 0.4% in October compared to a 9% decline in September (this still leaves gas prices down 27.8% year over year).
A 0.8% spike in the index for medical care services also helped drive October’s inflation. This includes a significant jump in the hospital services index, up 2% in October. Overall, medical care costs posted a 0.7% gain in October including a 2.3% jump in the costs of inpatient services and a 1.7% rise in the costs of outpatient services.
Four of the six major grocery store food groups saw prices rise in October. The overall food index rose a modest 0.1%, following a 0.4% rise in September. The price of fruits and vegetables climbed 0.5% in October, while the index for meat, poultry, fish and eggs fell by the same amount, despite a 3.4% increase in the cost of bacon and bacon related products. A fall of 4.8% in the price of eggs was particularly notable for the month. Breakfast cereal and butter posted strong price gains, rising 2.4% and 5.3% in October.
Shelter costs continued to climb steadily, up 0.3% in October, matching Septembers change. Shelter costs have risen between 0.2% and 0.4% every month this year. The index for lodging away from home, up 0.8% in October, contributed significantly to higher shelter costs, .
The apparel index was down 0.8% in October. There was a large amount of variation within the index. The index for boys apparel climbed 2.9% while the index for girls apparel fell by 2.9%. Delivery services also fell in October, down 2%.
Seasonally Adjusted Monthly % Change in CPI-U by Category (2016)
| January | February | March | April | May | June | July |
| All Items | 0 | -0.2 | 0.1 | 0.4 | 0.2 | 0.2 | 0.0 |
| Food | 0 | 0.2 | -0.2 | 0.2 | -0.2 | -0.1 | 0.0 |
| Energy | -2.8 | -6.0 | 0.9 | 3.4 | 1.2 | 1.3 | -1.6 |
| Gasoline | -4.8 | -12.5 | 2.2 | 8.1 | 2.3 | 3.3 | -4.7 |
| Fuel Oil (non seasonally adjusted) | -6.5 | -2.9 | 1.7 | 1.9 | 6.2 | 3.7 | -1.5 |
| Electricity | -0.7 | -0.2 | 0.4 | -0.3 | -0.2 | -0.5 | 0.5 |
| Utilities (piped gas service) | -0.6 | 1.0 | -0.7 | 0.6 | 1.7 | -0.4 | 3.1 |
| Energy Services | -0.7 | 0.1 | 0.2 | -0.1 | 0.2 | -0.5 | 1.0 |
| All Items Less Food and Energy | 0.3 | 0.3 | 0.1 | 0.2 | 0.2 | 0.2 | 0.1 |
| Services Less Energy Services | 0.3 | 0.3 | 0.2 | 0.3 | 0.4 | 0.3 | 0.2 |
| Shelter | 0.3 | 0.3 | 0.2 | 0.3 | 0.4 | 0.3 | 0.2 |
| Transportation Services | 0.4 | 0.2 | 0.2 | 0.7 | 0.3 | 0.3 | -0.2 |
| Medical Care Services | 0.5 | 0.5 | 0.1 | 0.3 | 0.5 | 0.2 | 0.5 |
12-Month Inflation
For the 12-months ending in October, unadjusted inflation was 0.2%. This includes a 27.8% decline in the index for energy commodities, which accounts for roughly 3.8% of the total CPI-U. The overall energy index fell 17.1% for the year. Despite the strong negative impact of energy prices, the CPI-U is marginally higher for the year.
Food prices, which account for over 14% of the overall price index, were up 1.6% year over year. Annual changes in food prices were mixed. Eggs were 30% more expensive than they were one year earlier. Over the same period, milk became 7.5% cheaper and the index for salt and seasoning rose 7.0%. Food at employee sites and schools was 5% higher for the year.
The prices of many consumer goods became cheaper over the year. The indexes for apparel and for appliances posted 1.9% and 4% declines respectively. The price of a television set has fallen 13.3% year over year, while the index for toys was down 6%. On the other hand, the cost of shelter rose 3.2% for the year with moving costs up 6.4%.
Outlook for the Fed
Most economists expect the Fed to raise interest rates in December, which would be the first rate hike in over 9 years. Today’s inflation release should not have a significant impact on these expectations. Fed fund futures are pricing in a 73.6% likelihood of a 0.25% rate hike on December 16th, which would bring the Fed Funds rate to 0.5%. The level of uncertainty around this highly anticipated hike and the pace of tightening over the coming years is unprecedented.
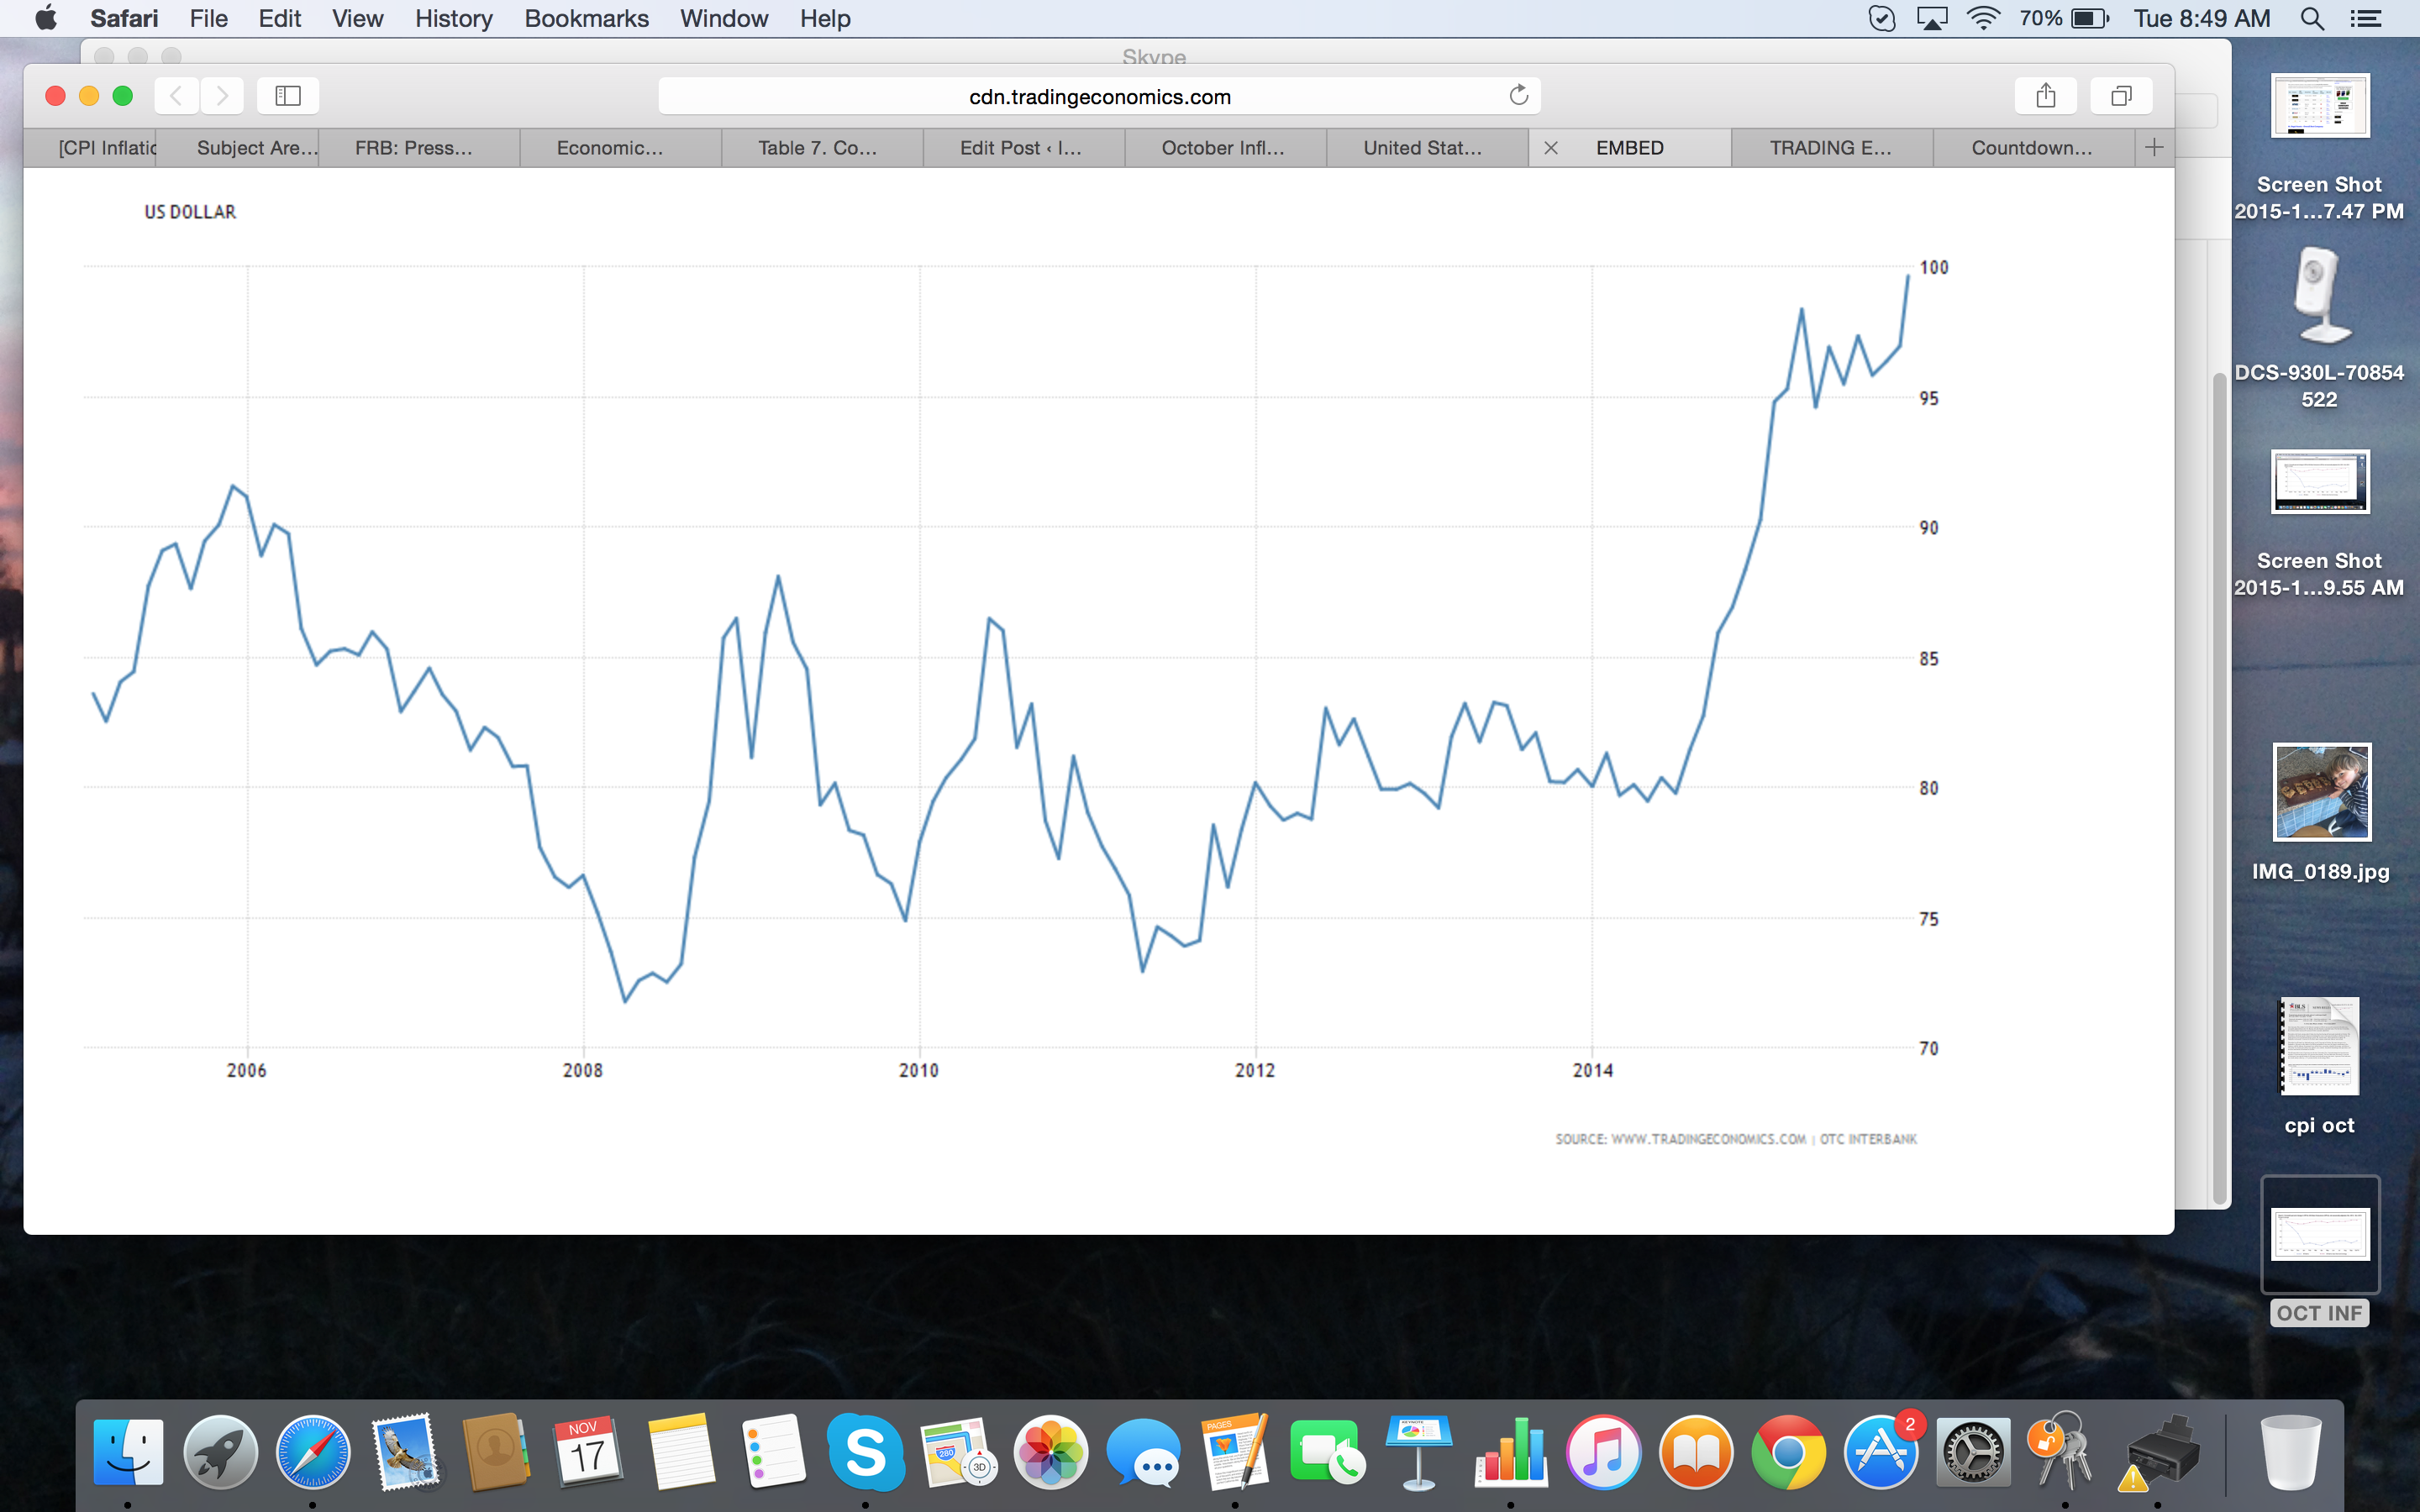
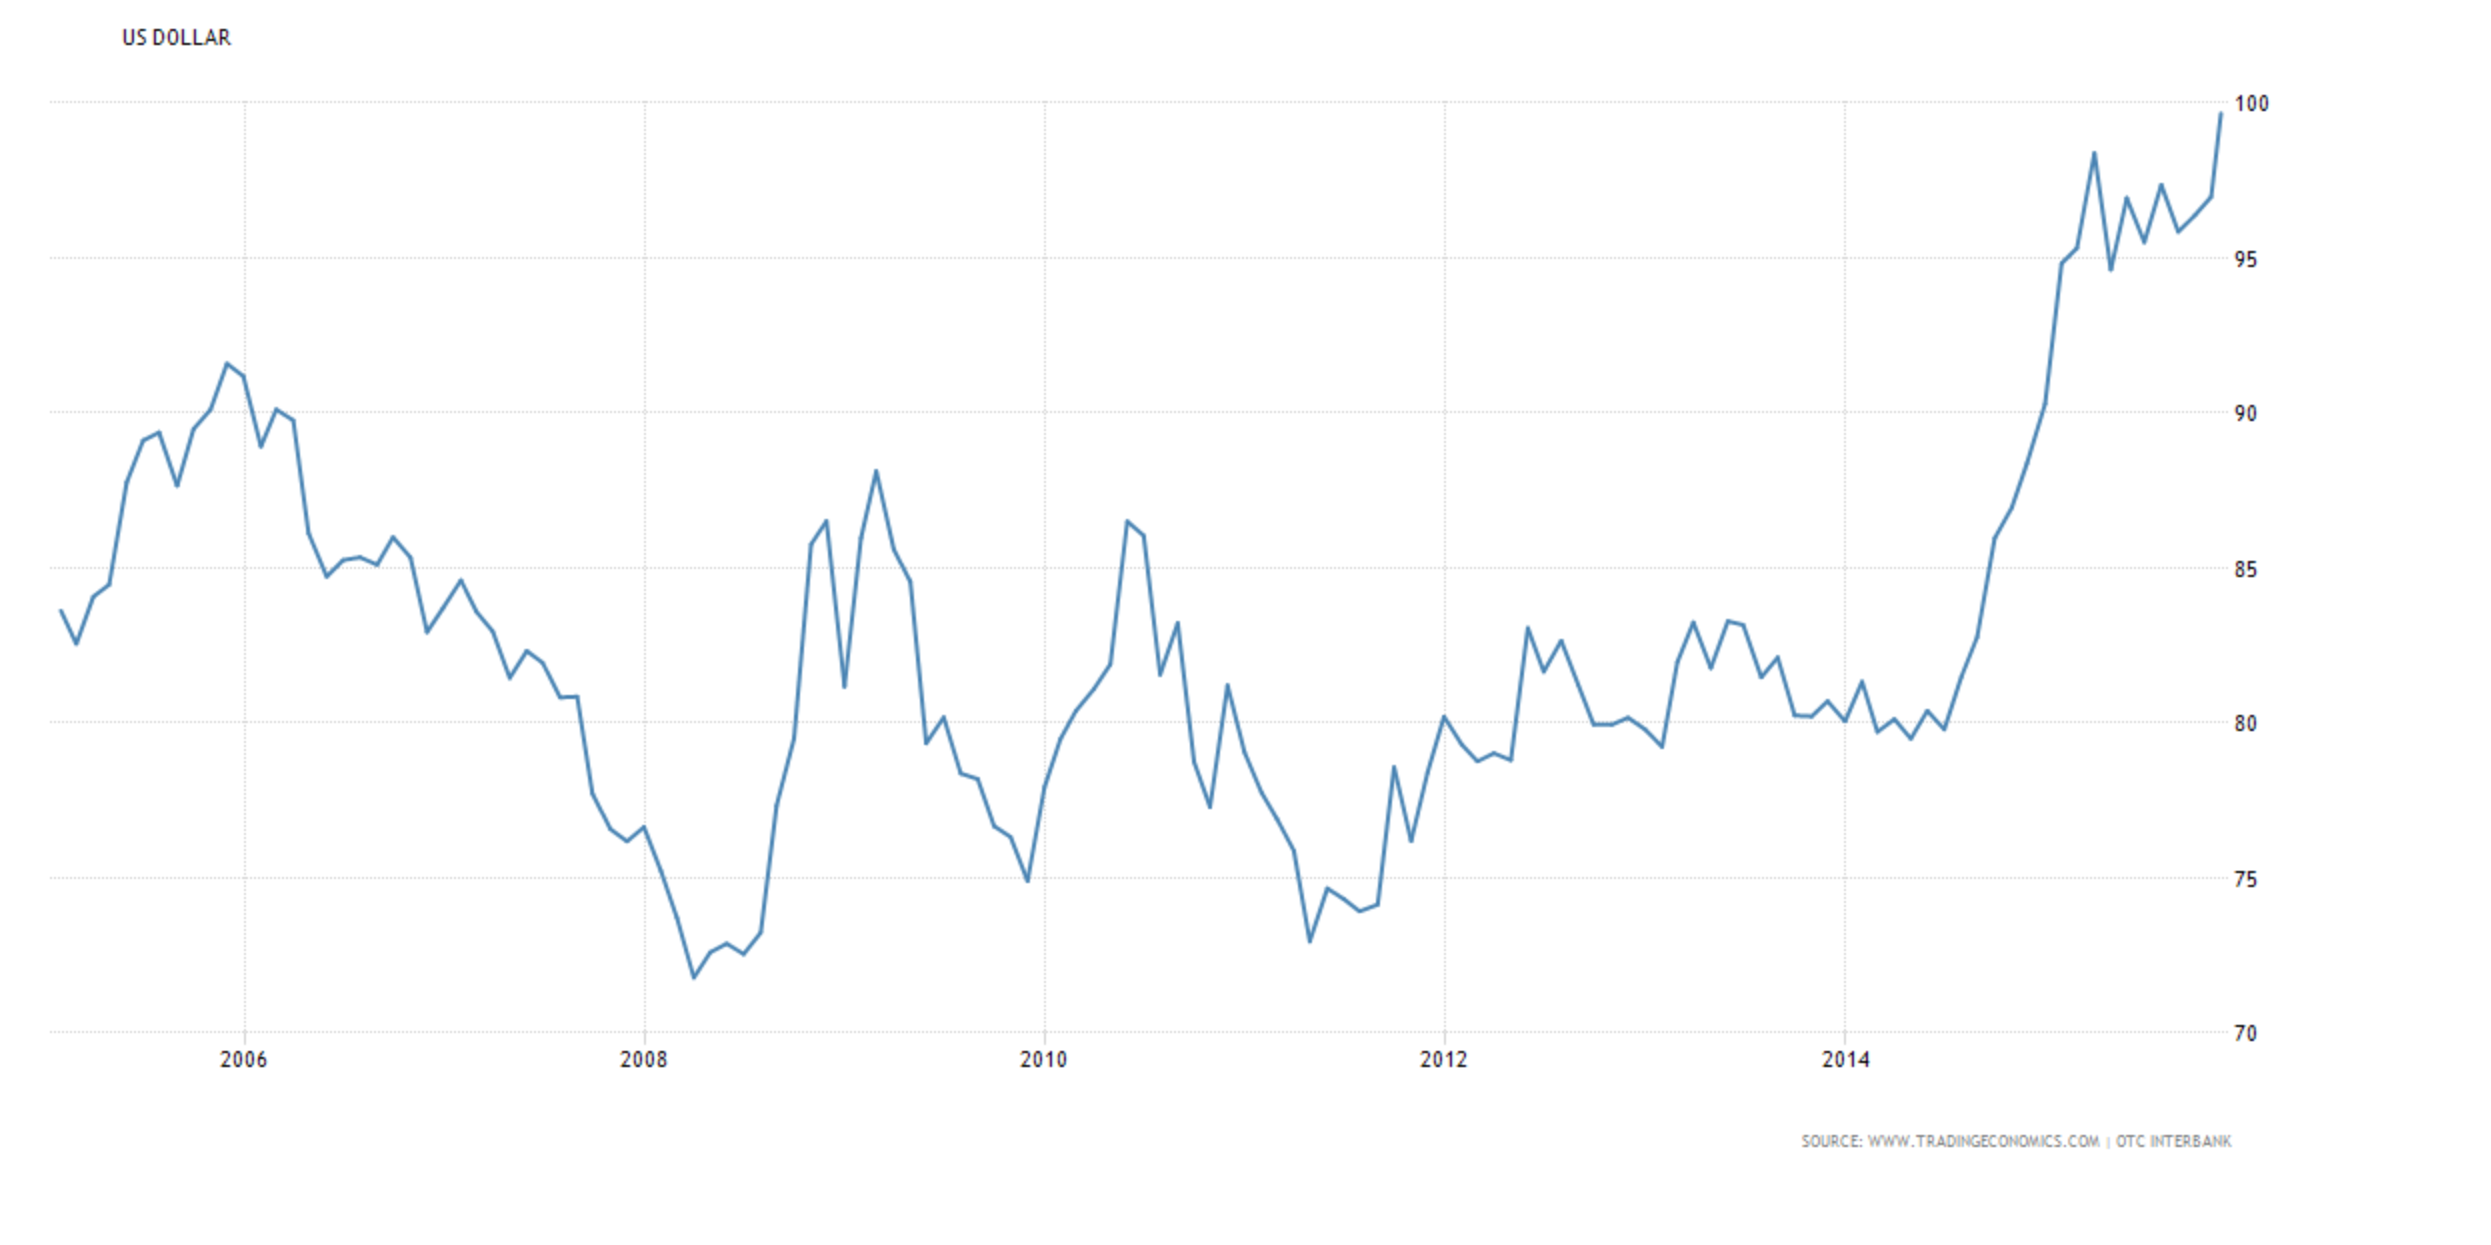
The modest but steady growth in the U.S. economy is in stark contrast to slowdowns in much of the world. With the EU considering quantitative easing and Japan dipping into recession, international money is flowing into the U.S. economy, driving the dollar higher. A rate hike would put further upward pressure on the U.S. dollar, which would create a slowdown in domestic manufacturing. It would also make imports cheaper, potentially keeping inflation from moving towards the target rate. The graph below shows the U.S. dollar reaching its highest level in 10 years versus a basket of international currencies. This should be a major concern at the next FOMC meeting on December 15th and 16th.
by Emily Cross Leon | Oct 15, 2015 | In the news, Inflation, Monthly CPI Updates
Falling gas prices kept inflation below zero for the month of August. The BLS announced this morning that the Consumer Price Index for All Urban Consumers (CPI-U) fell 0.2% in September on a seasonally adjusted basis; this is in line with expectations. In August, the CPI-U fell 0.1% following 6 straight months of growth. Gas prices also drove the decline in August’s CPI-U number. September’s decline wiped out the annual gains of 0.2% that were posted at the end of August, leaving the CPI-U flat for the year ending in September.
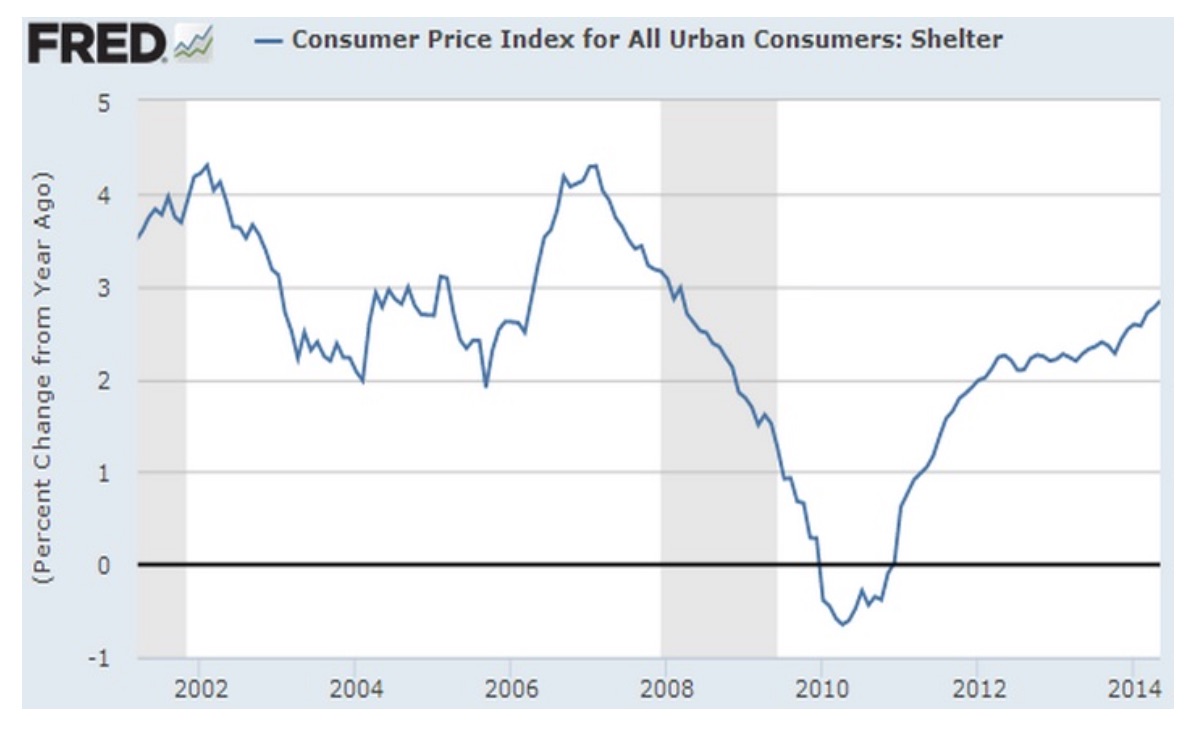
The index for all items less food and energy was up 0.2% in September, following increases of 0.1% in both July and August. For the 12-months ending in September, this core index increased 1.9%, pointing to more robust underlying growth for the U.S. economy. This is the highest annual core inflation number since July 2014. As the graph above shows, the disparity between overall consumer prices and consumer prices less food and energy continues to grow.
Energy Prices
The decline in overall consumer prices in September was largely driven by falling gasoline prices, which were down a seasonally adjusted 9% in the month alone. Over the same period, the energy index fell 4.7%, adding to August’s 2% decline. The energy index accounts for about 8% of the CPI-U and gasoline about 4%.
Volatile gasoline and energy prices have driven overall price levels and kept inflation very low over the past year. The energy index is down 9.7% for the year ending in September. Over this period, the biggest price declines were seen in the price of gasoline and fuel oil, down 18% and 18.6% respectively.
Seasonally Adjusted Monthly Numbers
On a seasonally adjusted basis, the CPI fell 0.2% in September following a decline of 0.1% in August.
Seasonally Adjusted Monthly % Change in CPI-U by Category (2016)
| January | February | March | April | May | June | July |
| All Items | 0 | -0.2 | 0.1 | 0.4 | 0.2 | 0.2 | 0.0 |
| Food | 0 | 0.2 | -0.2 | 0.2 | -0.2 | -0.1 | 0.0 |
| Energy | -2.8 | -6.0 | 0.9 | 3.4 | 1.2 | 1.3 | -1.6 |
| Gasoline | -4.8 | -12.5 | 2.2 | 8.1 | 2.3 | 3.3 | -4.7 |
| Fuel Oil (non seasonally adjusted) | -6.5 | -2.9 | 1.7 | 1.9 | 6.2 | 3.7 | -1.5 |
| Electricity | -0.7 | -0.2 | 0.4 | -0.3 | -0.2 | -0.5 | 0.5 |
| Utilities (piped gas service) | -0.6 | 1.0 | -0.7 | 0.6 | 1.7 | -0.4 | 3.1 |
| Energy Services | -0.7 | 0.1 | 0.2 | -0.1 | 0.2 | -0.5 | 1.0 |
| All Items Less Food and Energy | 0.3 | 0.3 | 0.1 | 0.2 | 0.2 | 0.2 | 0.1 |
| Services Less Energy Services | 0.3 | 0.3 | 0.2 | 0.3 | 0.4 | 0.3 | 0.2 |
| Shelter | 0.3 | 0.3 | 0.2 | 0.3 | 0.4 | 0.3 | 0.2 |
| Transportation Services | 0.4 | 0.2 | 0.2 | 0.7 | 0.3 | 0.3 | -0.2 |
| Medical Care Services | 0.5 | 0.5 | 0.1 | 0.3 | 0.5 | 0.2 | 0.5 |
The price of food climbed 0.4% in September, adding to August’s 0.2% increase in the food index. Higher prices for dairy and fruits and vegetables, including a 4.7% spike in the price of lettuce, were somewhat offset by declines in the prices for fish and poultry. The index that measures the price of food in primary and secondary schools was 7.2% higher in September alone.
The shelter index continues to climb, up 0.3% in September, following increases of between 0.2% and 0.4% per month since the beginning of the year. In September, higher shelter costs were the result of higher prices for hotels and lodging away from home. The rent index, which is part of the shelter index, climbed 0.4% in September. Shelter costs account for about one third of the CPI-U.
The medical care index was up 0.2% in September, including increases of 0.3% for medical care services and 0.6% for health insurance. At the same time, the costs for both prescription drugs and medical equipment and supplies were down 0.2%.
Following four months of declines, the index for household furnishings and operations increased 0.4% in September despite a fall of 0.7% in the price of floor coverings. Indoor plants and flowers were significantly more expensive, gaining 2.4% in September.
The index for apparel fell 0.3% in September, following two months of gains. September’s apparel number masks volatility within the index. On a seasonally adjusted basis, the prices for men’s outerwear fell 3.9% and girl’s apparel was down 3.7%. At the same time, the price of men’s sweaters climbed 8.7%.
Annual Inflation
September’s declining CPI-U wiped out any 12-month gains, leaving overall price levels flat for the year. Higher prices for most components of the index were just able to balance the 12-month 18.4% decline in energy prices. The food index was 1.6% higher for the 12-month period and Shelter costs climbed 3.7%. Transportation services were 2.2% higher, including increases of over 5% for both car and truck rentals and vehicle insurance. Significant 12-month price hikes were also posted for animal services including veterinary services (up 4.3%), admission to sporting events (up 7.8%) and childcare and nursery school fees (up 4.2%). In general, higher prices were recorded for most services. Financial service costs were nearly 4% higher for the year, including an increase of 5.1% for tax and accounting services.
Price declines over the past year include the cost of cell phone services (down 3.8%) and the index for cell phone hardware, calculators and consumer information items, which tumbled 15.8%. Airline fares were down 6% for the year as was the price of toys. Television sets became over 13% less expensive compared to a year earlier and the price of appliances in general fell 3.5%.
Economic Outlook
Today’s inflation numbers will be watched closely as the Federal Reserve appears divided over the possibility of an interest rate hike later in the year. Stronger inflation numbers would have suggested that the economy was more robust and ready for higher interest rates. However, today’s weak inflation data, although expected, add to a series of disappointing indicators.
The Producer Price Index, a principal gauge of inflation in the manufacturing sector, declined by 0.5% in September, its weakest number in 7 months. September retails sales were also a disappointment, missing expectations at 0.1% versus the expected 0.2%. Core retail sales slipped 0.3% below the expected decline of 0.1%. The U.S. dollar has also been falling due to a disappointing .
The next Federal Open Market Committee meeting is October 27-28. The markets have been pricing in approximately a 39% chance of a rate hike in December. However, this number has been declining following downturns in global and emerging markets. Today’s CPI-U numbers will not reverse the trend. Rates are likely to remain unchanged until at least March of next year.
by Emily Cross Leon | Sep 16, 2015 | In the news, Inflation
 Just ahead of the the FOMC’s two day deliberation over a potential interest rate hike, the BLS released August’s inflation data this morning. Headline inflation or the Consumer Price Index for Urban Consumers (CPI-U) fell a seasonally adjusted 0.1% for the month of August, in line with economists’ expectations. This follows July’s lacklustre 0.1% CPI-U growth which was below expectations. For the year ending in August, non-seasonally adjusted overall inflation was 0.2% for the second month in row.
Core Inflation, which excludes food and energy was up a seasonally adjusted 0.1% in the month of August. This follows an increase of 0.1% in July, which was driven by a spike in the cost of shelter. We continue to see a large disparity between core and overall CPI as food and energy prices remain very volitile. 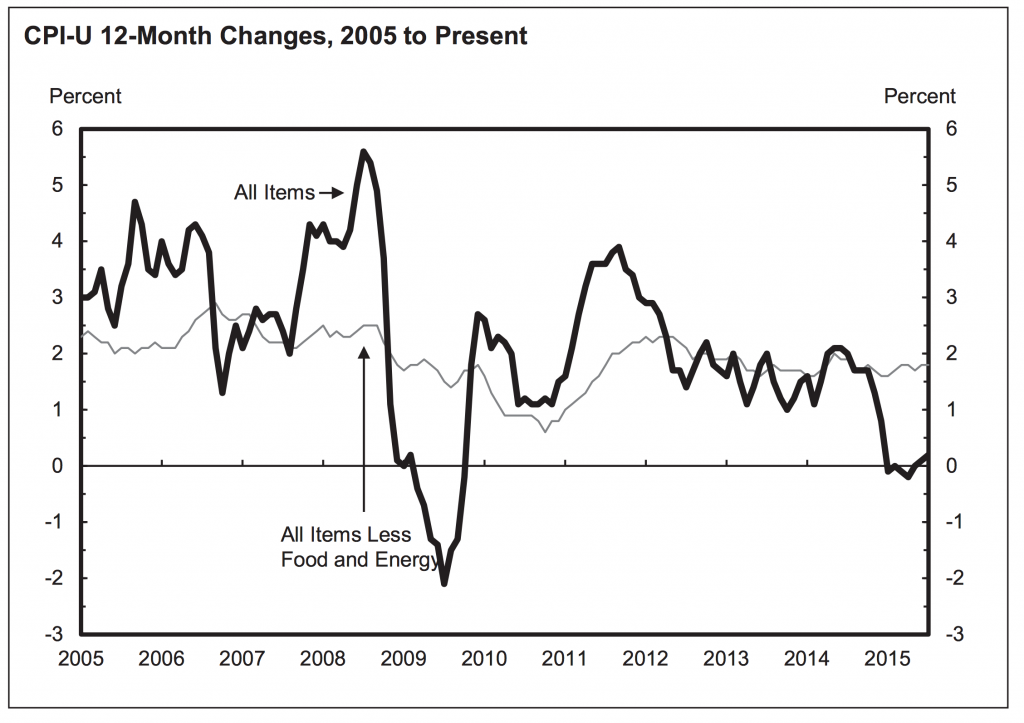
Seasonally Adjusted Monthly Numbers
In August, lower energy prices were not quite offset by higher prices for food, apparel and energy services, sending seasonally adjusted inflation below zero for the month.
Seasonally Adjusted Monthly % Change in CPI-U by Category (2016)
| January | February | March | April | May | June | July |
| All Items | 0 | -0.2 | 0.1 | 0.4 | 0.2 | 0.2 | 0.0 |
| Food | 0 | 0.2 | -0.2 | 0.2 | -0.2 | -0.1 | 0.0 |
| Energy | -2.8 | -6.0 | 0.9 | 3.4 | 1.2 | 1.3 | -1.6 |
| Gasoline | -4.8 | -12.5 | 2.2 | 8.1 | 2.3 | 3.3 | -4.7 |
| Fuel Oil (non seasonally adjusted) | -6.5 | -2.9 | 1.7 | 1.9 | 6.2 | 3.7 | -1.5 |
| Electricity | -0.7 | -0.2 | 0.4 | -0.3 | -0.2 | -0.5 | 0.5 |
| Utilities (piped gas service) | -0.6 | 1.0 | -0.7 | 0.6 | 1.7 | -0.4 | 3.1 |
| Energy Services | -0.7 | 0.1 | 0.2 | -0.1 | 0.2 | -0.5 | 1.0 |
| All Items Less Food and Energy | 0.3 | 0.3 | 0.1 | 0.2 | 0.2 | 0.2 | 0.1 |
| Services Less Energy Services | 0.3 | 0.3 | 0.2 | 0.3 | 0.4 | 0.3 | 0.2 |
| Shelter | 0.3 | 0.3 | 0.2 | 0.3 | 0.4 | 0.3 | 0.2 |
| Transportation Services | 0.4 | 0.2 | 0.2 | 0.7 | 0.3 | 0.3 | -0.2 |
| Medical Care Services | 0.5 | 0.5 | 0.1 | 0.3 | 0.5 | 0.2 | 0.5 |
The energy index was down 2.0% for the month for August due to a drop in gas prices. On a seasonally adjusted basis, the gasoline index fell 4.1% in August following 3 consecutive months of growth including a 10.4% spike in May. Before seasonal adjustments, gas prices were 5.4% lower in August (see graph below). The price of fuel oil also fell a drastic 8.1% in August adding to declines in June and July. At the same time, energy services including electricity and piped gas were more expensive in August, climbing a seasonally adjusted 0.3% and 1.2% respectively.
 The index for food climbed 0.2% in August, driven by significant growth in the price of fruits, vegetables and eggs. The fruits and vegetable index was 1.5% higher for the month. The price of eggs also spiked 7.7% while the indexes for meat, fish and poultry were generally lower.
Without food and energy, which are very volatile, the index for all items or core index increased 0.1% for the second consecutive month. This includes the shelter index which continues to climb, increasing 0.2% in August following larger increases in June (+0.3%) and July (+0.4%). Growth in shelter costs continues to be a major driver of core inflation. Price increases were also seen in apparel, tobacco, alcohol, medical care commodities and non-energy services.
After falling 5.6% in July, the price of airline tickets continued to decline in August, down 3.1% for the month. Other factors keeping seasonally adjusted inflation below zero in August include declines in the prices of used cars and trucks (-0.4%), household furnishings (-0.3%) and recreation (-0.1%).
Annual Inflation
Year over year, the all items index increased 0.2% in August. The number, which has been rising since April, was also 0.2% in July. Food and shelter costs were significantly higher over both annual periods. Prior to seasonal adjustment, the price of food was up 1.6% for the year ending in August, the same as the year ending in July. Shelter costs were 3.1% higher for the 12-month period. The indexes for transportation, medical care services and non-energy services were all higher, up 2.1%, 2.2% and 2.6% respectively.
Despite higher prices in many parts of the economy, sever declines in energy prices for the year ending in August kept inflation tame. The energy index fell 15% for the year ending in August including declines in all major components. The most drastic fall was in the price of fuel oil, down 34.6% for the year. The gas index was down 23.3% and piped gas services were 11.5% cheaper for the year.
The index for all items less food and energy was in line with July, rising 1.8% over both 12-month periods. August marks the fifth time in 6 months that the 12-month change in core inflation was 1.8 percent. Annual core inflation was driven by higher prices for shelter, health care, new vehicles and recreation. While apparel, used vehicles, household goods and air travel have all posted 12-month price declines.
Outlook for the Fed
A high inflation number would have been welcome news for the Federal Reserve as it would have been a missing piece pointing to a strengthening economy and giving them the opportunity to raise interest rates for the first time since 2006. Most other U.S. economic data is more positive. Unemployment was down in August for the third consecutive month and hovering around what the Fed considers ‘full employment‘ at 5.1%. However, with inflation quite stagnant, a rate hike is unlikely this month
Emerging markets, struggling since the recent downturn in China, would be vulnerable to a U.S. rate hike. Higher rates would strengthen the U.S. dollar. Emerging markets, with U.S. dollar denominated debt would struggle to repay loans. Markets are currently pricing in a U.S. rate hike in December. Today’s inflation data was inline with expectations and will not change the market’s expectations regarding the timing of rate increases.
by Emily Cross Leon | Aug 21, 2015 | Federal Reserve, In the news, Inflation
On Wednesday, the Bureau of Labor Statistics released inflation data for July that was slightly below expectations. For the month, the headline number or Consumer Price Index for All Urban Consumers (CPI-U) increased 0.1% compared to a median estimate of 0.2% for analysts polled by Bloomberg.
For the 12-month period ending in July, inflation was only 0.2%. This number includes consistent declines in monthly CPI numbers for October 2014 through January 2015. Year over year, core inflation, which excludes food and energy, climbed 1.8%. This is exactly in line with expectations and equal to the core annual inflation number reported four of the past five months.
July’s CPI numbers follow increases of 0.4% and 0.3% in May and June respectively and point to a loss of momentum. Sluggish inflation means the Federal Reserve may be hesitant to raise rates in September. The Fed’s key interest rate has hovered around zero since December 2008 but a series of rate hikes has been widely anticipated to start as early as next month. Weak inflation coinciding with global economic troubles could indicate that the US economy is not ready for higher interest rates.
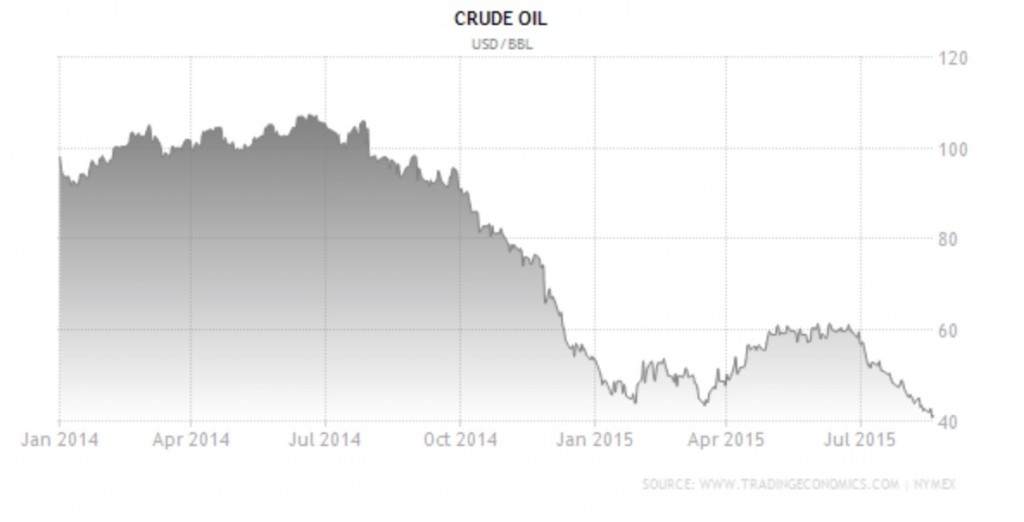
Crude Oil Prices Tumble in July
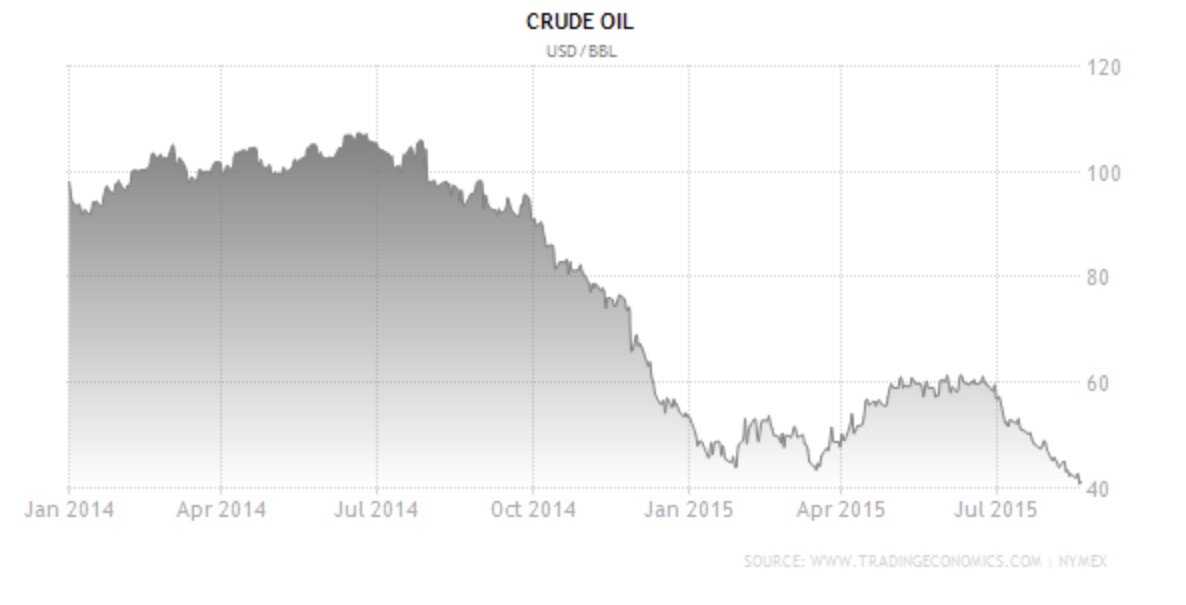
The Energy index fell 14.8% for the year ending in July, despite an increase of 0.1% in July. Crude Oil went from around $58/barrel to below $46/barrel in the month of July alone; such low prices have not been seen since 2009. However, gasoline prices edged higher by 0.9% in July following increases of 3.4% in June and 10.4% in May. Year over year, the gasoline index has still slid 22.3% due to the sharp declines in the second half of 2014. Aside from gasoline, all other major components of the energy index fell in July. Year over year, all components of the energy index are significantly lower with fuel oil posting the largest 12-month decline, down 29.7%.
Declining oil prices have sparked competition among airlines and fares fell a staggering 5.6% in the month of July. Low fuel costs have slowly filtered through to consumers resulting in the largest monthly decline in airline tickets in nearly 10 years. Economists do not expect prices to remain low for long.
Food and Housing Costs on the Rise While Wages Remain Stagnant
The food index climbed 1.6% for the year ending in July, including a 0.2% rise in July alone. All six major grocery store indexes were higher for the month, led by dairy products, up 0.8%. The price of fruits and vegetables rose 0.3% in July. The year ending July saw drastic increases in the price of eggs (24.9%) and beef (10.0%). Compared to a year earlier, food at home is 0.9% more expensive and food away from home is costs 2.7% more
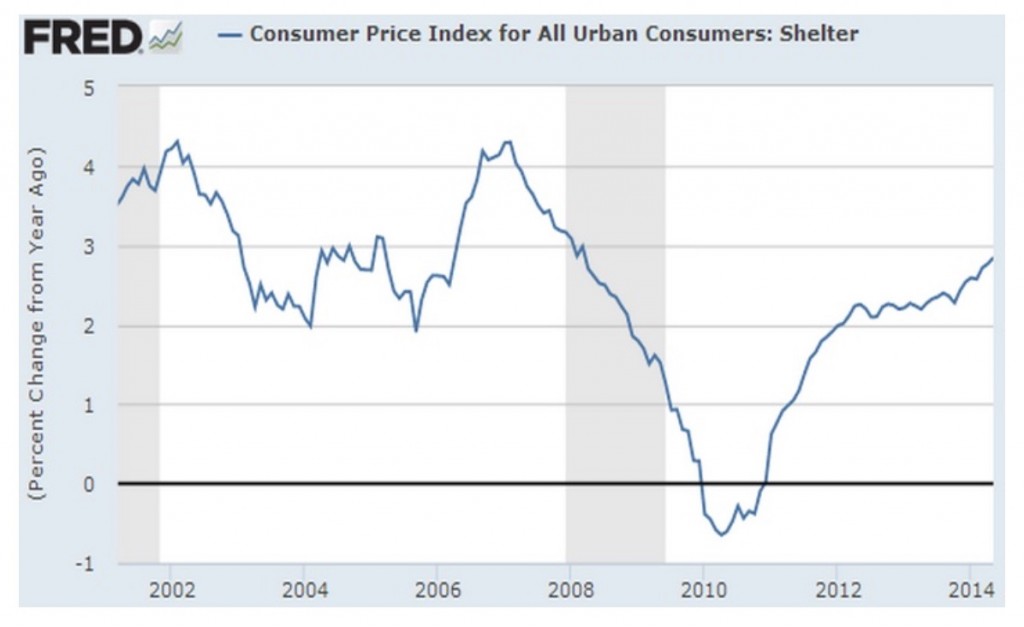
Shelter costs are up significantly (3.1%) year over year. In July, shelter costs posted their largest monthly gain (0.4%) since February 2007. This is largely due to higher rental costs as available housing continues to dwindle. Vacancy rates for rental units are near their 22-year low. The graph below shows that this trend has been consistent since 2010. The problem, according to Diane Swonk, chief economist at Mesirow Financial in Chicago is that “rents are surging and in the face of stagnant wages [which] leaves less for consumers to spend elsewhere in the economy.”
The July jobs report showed a small decline in unemployment, down a marginal 0.02% to 5.26%, which is a 7-year low. Employment growth has been healthy and consistent but wage growth has lagged previous economic recoveries. David Kelly at JP Morgan blames low headline inflation numbers, among other factors, for lacklustre wage growth.
Outlook for the Federal Reserve
Growing concern over the health of the global economy could delay or slow the pace of interest rate hikes at the Federal Reserve. China’s surprise devaluation of the yuan should be a major concern for the US economy. Other emerging markets could potentially follow suit if they wish to remain competitive with China. This could spur global deflation. Import prices will certainly fall in the US. Combined this with drastically dwindling commodity prices and a strong dollar and there is little to support price growth. Although the Fed has stated that they may still raise rates despite low inflation, it is a key factor they will need to consider. Raising rates in a deflationary environment is unlikely.