-v3")
The BLS released October’s inflation data this morning and there were no major surprises. The Consumer Price Index for All Urban Consumers (CPI-U) climbed a seasonally adjusted 0.2% in October following a decline of 0.2% in September. This is in line with consensus expectations. Year over year, the CPI-U was up 0.2% at the end of October, which is well below the Fed’s annual inflation target rate of 2%. According to a recent Federal Reserve press release:
“Inflation has continued to run below the Committee’s longer-run objective, partly reflecting declines in energy prices and in prices of non-energy imports.”
Core inflation, which excludes food and energy, increased 0.2% in October, following a 0.2% increase in September. For the year ending in October, core inflation was 1.9%. Outside of the volatile energy index, which was down over 17% for the 12-months ending in October, consumer prices appear to be climbing at a steady pace only marginally below the Fed’s target.

October’s Seasonally Adjusted Inflation
October’s 0.2% climb in consumer prices was largely driven by modest increases in the energy index, which rose 0.3% following a decline of 4.7% in September. Gas prices were up 0.4% in October compared to a 9% decline in September (this still leaves gas prices down 27.8% year over year).
A 0.8% spike in the index for medical care services also helped drive October’s inflation. This includes a significant jump in the hospital services index, up 2% in October. Overall, medical care costs posted a 0.7% gain in October including a 2.3% jump in the costs of inpatient services and a 1.7% rise in the costs of outpatient services.
Four of the six major grocery store food groups saw prices rise in October. The overall food index rose a modest 0.1%, following a 0.4% rise in September. The price of fruits and vegetables climbed 0.5% in October, while the index for meat, poultry, fish and eggs fell by the same amount, despite a 3.4% increase in the cost of bacon and bacon related products. A fall of 4.8% in the price of eggs was particularly notable for the month. Breakfast cereal and butter posted strong price gains, rising 2.4% and 5.3% in October.
Shelter costs continued to climb steadily, up 0.3% in October, matching Septembers change. Shelter costs have risen between 0.2% and 0.4% every month this year. The index for lodging away from home, up 0.8% in October, contributed significantly to higher shelter costs, .
The apparel index was down 0.8% in October. There was a large amount of variation within the index. The index for boys apparel climbed 2.9% while the index for girls apparel fell by 2.9%. Delivery services also fell in October, down 2%.
Seasonally Adjusted Monthly % Change in CPI-U by Category (2016)
| January | February | March | April | May | June | July | |
|---|---|---|---|---|---|---|---|
| All Items | 0 | -0.2 | 0.1 | 0.4 | 0.2 | 0.2 | 0.0 |
| Food | 0 | 0.2 | -0.2 | 0.2 | -0.2 | -0.1 | 0.0 |
| Energy | -2.8 | -6.0 | 0.9 | 3.4 | 1.2 | 1.3 | -1.6 |
| Gasoline | -4.8 | -12.5 | 2.2 | 8.1 | 2.3 | 3.3 | -4.7 |
| Fuel Oil (non seasonally adjusted) | -6.5 | -2.9 | 1.7 | 1.9 | 6.2 | 3.7 | -1.5 |
| Electricity | -0.7 | -0.2 | 0.4 | -0.3 | -0.2 | -0.5 | 0.5 |
| Utilities (piped gas service) | -0.6 | 1.0 | -0.7 | 0.6 | 1.7 | -0.4 | 3.1 |
| Energy Services | -0.7 | 0.1 | 0.2 | -0.1 | 0.2 | -0.5 | 1.0 |
| All Items Less Food and Energy | 0.3 | 0.3 | 0.1 | 0.2 | 0.2 | 0.2 | 0.1 |
| Services Less Energy Services | 0.3 | 0.3 | 0.2 | 0.3 | 0.4 | 0.3 | 0.2 |
| Shelter | 0.3 | 0.3 | 0.2 | 0.3 | 0.4 | 0.3 | 0.2 |
| Transportation Services | 0.4 | 0.2 | 0.2 | 0.7 | 0.3 | 0.3 | -0.2 |
| Medical Care Services | 0.5 | 0.5 | 0.1 | 0.3 | 0.5 | 0.2 | 0.5 |
12-Month Inflation
For the 12-months ending in October, unadjusted inflation was 0.2%. This includes a 27.8% decline in the index for energy commodities, which accounts for roughly 3.8% of the total CPI-U. The overall energy index fell 17.1% for the year. Despite the strong negative impact of energy prices, the CPI-U is marginally higher for the year.
Food prices, which account for over 14% of the overall price index, were up 1.6% year over year. Annual changes in food prices were mixed. Eggs were 30% more expensive than they were one year earlier. Over the same period, milk became 7.5% cheaper and the index for salt and seasoning rose 7.0%. Food at employee sites and schools was 5% higher for the year.
The prices of many consumer goods became cheaper over the year. The indexes for apparel and for appliances posted 1.9% and 4% declines respectively. The price of a television set has fallen 13.3% year over year, while the index for toys was down 6%. On the other hand, the cost of shelter rose 3.2% for the year with moving costs up 6.4%.
Outlook for the Fed
Most economists expect the Fed to raise interest rates in December, which would be the first rate hike in over 9 years. Today’s inflation release should not have a significant impact on these expectations. Fed fund futures are pricing in a 73.6% likelihood of a 0.25% rate hike on December 16th, which would bring the Fed Funds rate to 0.5%. The level of uncertainty around this highly anticipated hike and the pace of tightening over the coming years is unprecedented.
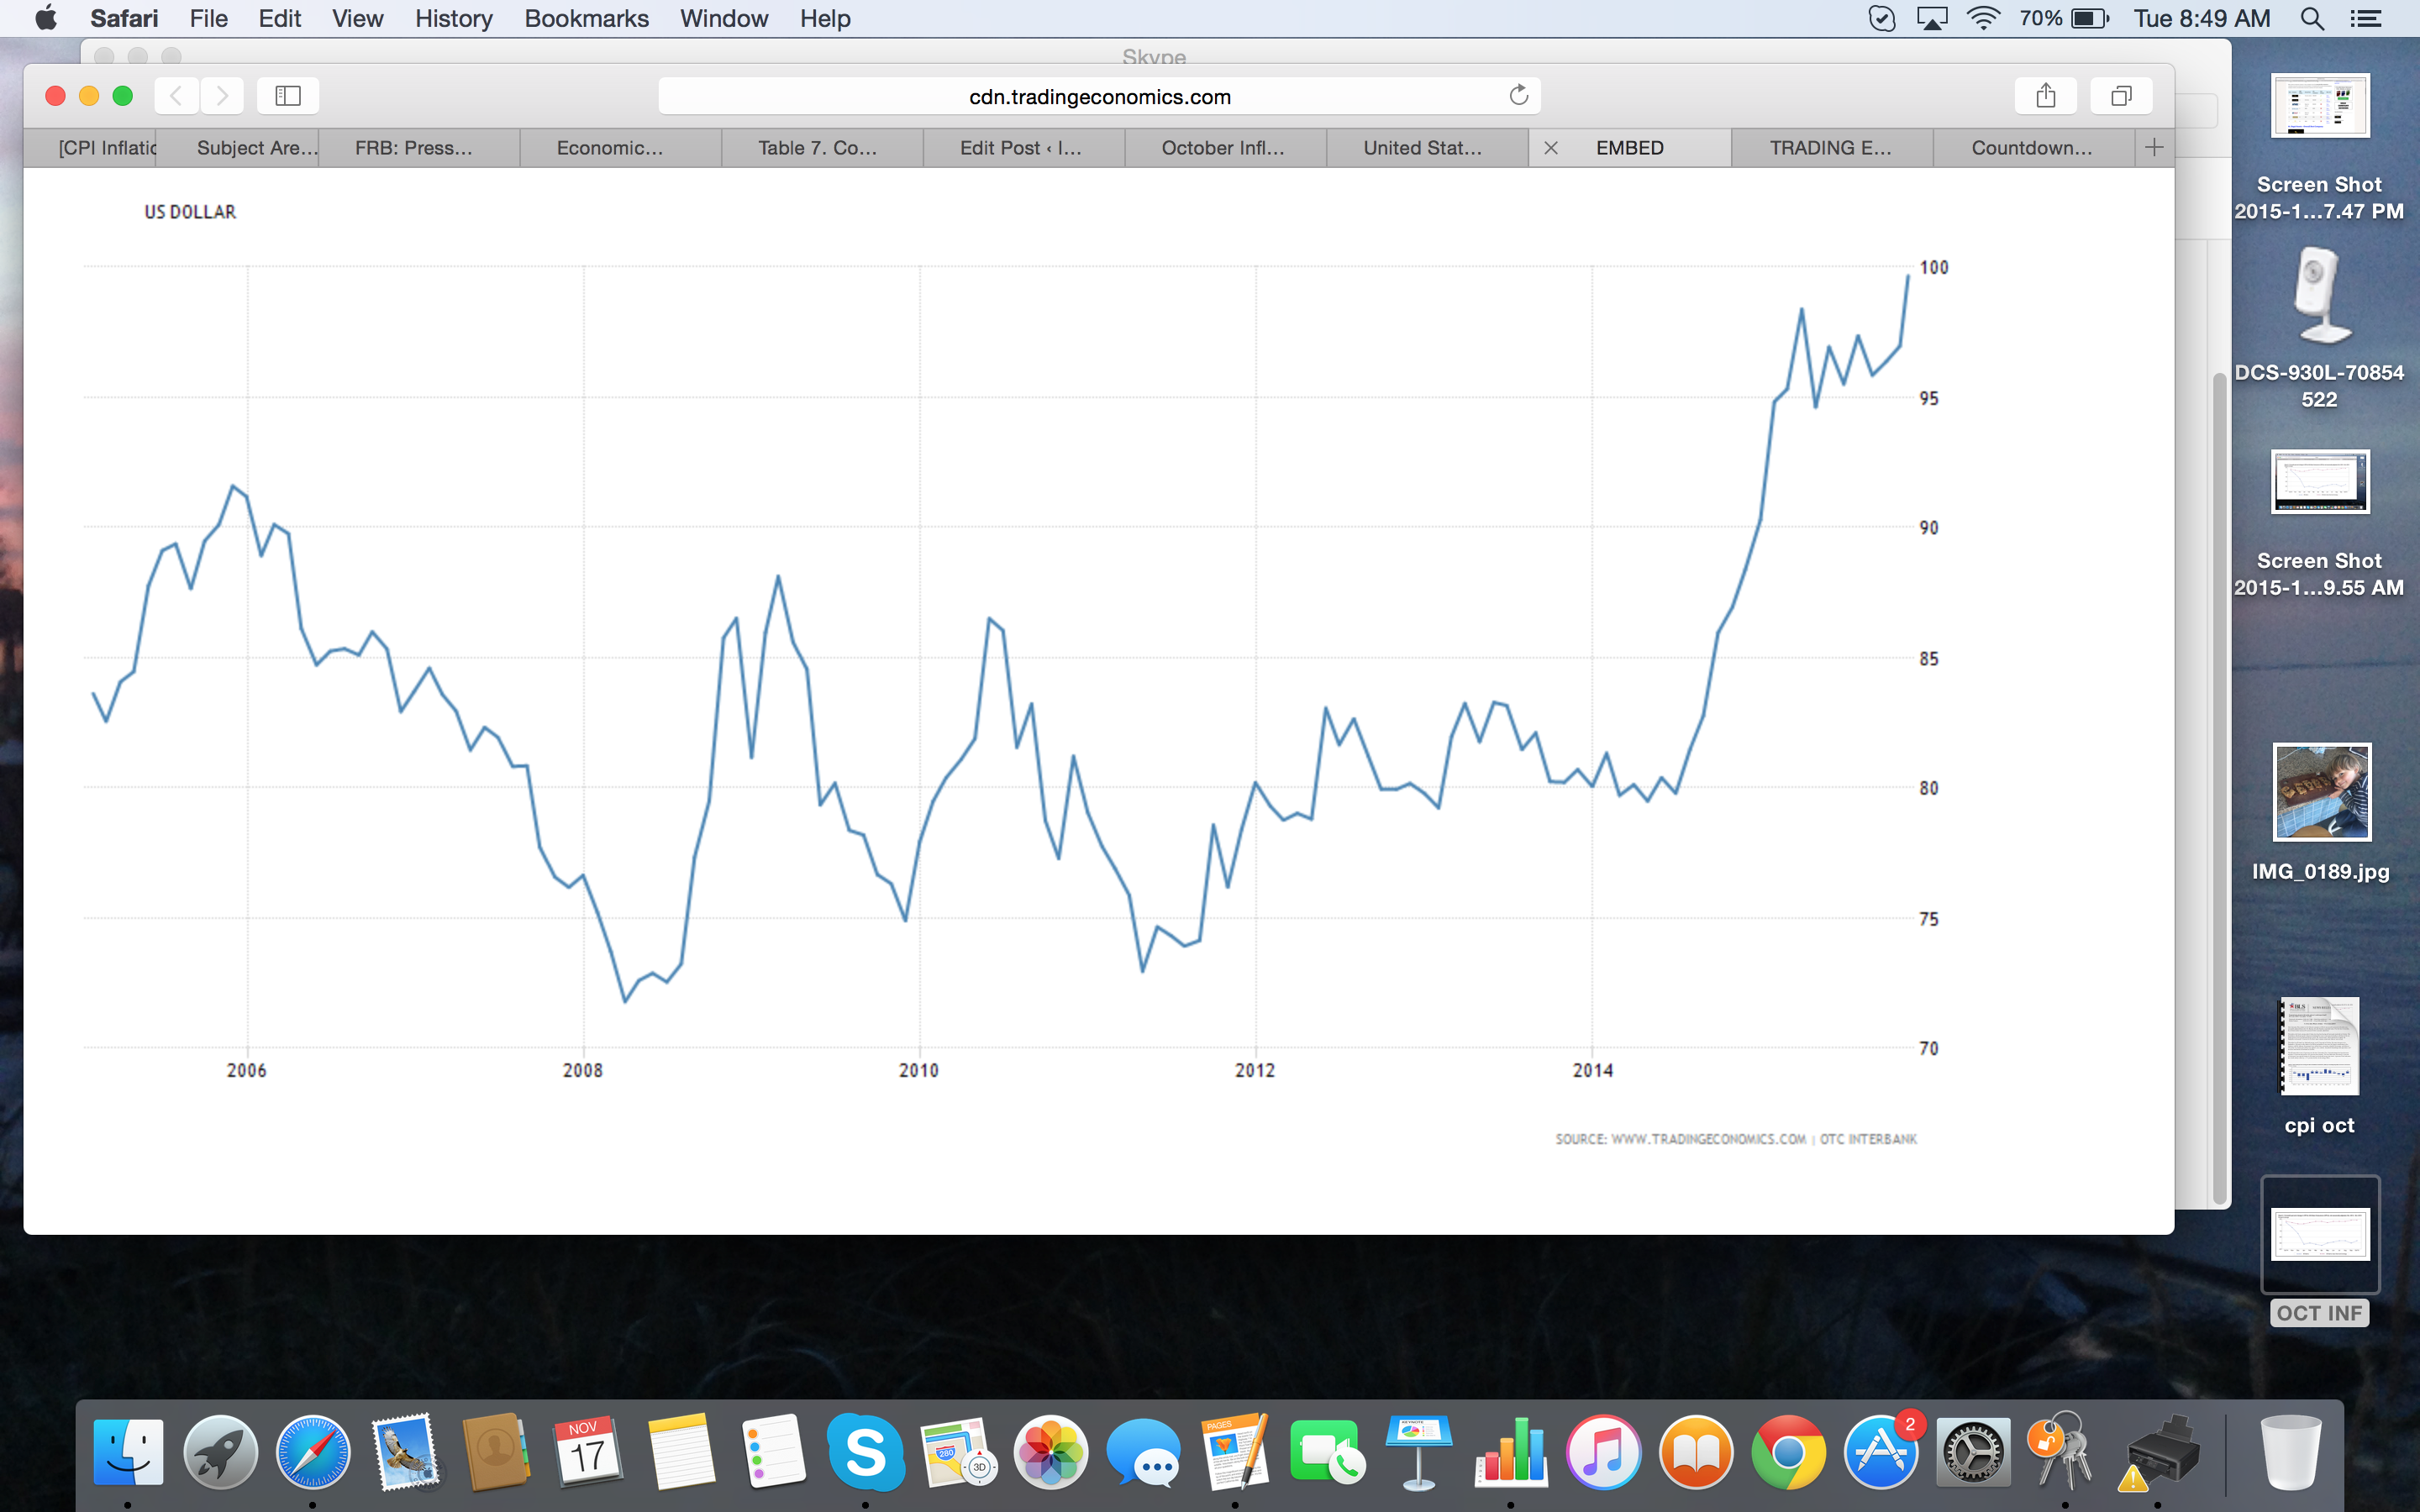
The modest but steady growth in the U.S. economy is in stark contrast to slowdowns in much of the world. With the EU considering quantitative easing and Japan dipping into recession, international money is flowing into the U.S. economy, driving the dollar higher. A rate hike would put further upward pressure on the U.S. dollar, which would create a slowdown in domestic manufacturing. It would also make imports cheaper, potentially keeping inflation from moving towards the target rate. The graph below shows the U.S. dollar reaching its highest level in 10 years versus a basket of international currencies. This should be a major concern at the next FOMC meeting on December 15th and 16th.


Emily is a Canadian financial blogger with multiple degrees in economics and extensive professional experience as a financial analyst. She was formerly a Ph.D. candidate at the University of Guelph's School of Agricultural Economics. Before that, she received an MA from the University of San Francisco in International Development Economics. She also has a BA in Math with a minor in Economics.
