Inflation in the United States ran at 2.63 percent in 2025, measured the way the Bureau of Labor Statistics measures it, as the change in the annual average Consumer Price Index from 2024 to 2025. That was the calmest year since 2020, and a long way down from the 8 percent of 2022. It was also the strangest year of data I have handled in twenty years of writing about this index, because one month of it does not exist.
Three years of compounding prices caught up with a lot of households
If balances grew faster than income over that stretch, our two minute quiz shows which route actually fits your numbers.
2025 monthly CPI and inflation table
The table below displays the monthly All-Items Consumer Price Index (CPI-U) as well as the annual and monthly inflation rates for the United States in 2025. You can find upcoming CPI release dates on our schedule page. All data is sourced from the U.S. Bureau of Labor Statistics.
← Slide left and right to view more. →
| Month | CPI (not seasonally adjusted) | Monthly Inflation Rate (%, seasonally adjusted) | Yearly Inflation Rate (%, not seasonally adjusted) |
|---|---|---|---|
| January | 317.671 | 0.5 | 3.0 |
| February | 319.082 | 0.2 | 2.8 |
| March | 319.799 | -0.1 | 2.4 |
| April | 320.795 | 0.2 | 2.3 |
| May | 321.465 | 0.1 | 2.4 |
| June | 322.561 | 0.3 | 2.7 |
| July | 323.048 | 0.2 | 2.7 |
| August | 323.976 | 0.4 | 2.9 |
| September | 324.800 | 0.3 | 3.0 |
| October | Not published | Not published | Not published |
| November | 324.122 | 0.2 | 2.7 |
| December | 324.054 | 0.3 | 2.7 |
| Annual | 321.943 | 0.24 | 2.69 |
Why October 2025 is blank. The Bureau of Labor Statistics cancelled the October 2025 CPI report. It did not collect price data between 1 October and 12 November 2025 because of the federal government shutdown, so there is no October index and no October percentage change to publish. Figures for the months either side of that gap are affected by the missing collection period. BLS documents the impact on its own shutdown page.
How to read these numbers. The monthly figure is seasonally adjusted, which is how the Bureau of Labor Statistics reports month to month change. The CPI index and the yearly figure are not seasonally adjusted. Two things follow from that, and both trip people up.
First, you cannot reproduce the monthly column by dividing one month’s index by the month before it, because the two columns are on different bases. Second, you cannot add the monthly figures together to arrive at the yearly rate. Percentage changes compound, they do not sum.
To check the annual rate yourself, divide the index for the month you want by the index for the same month a year earlier. For December 2025, that is 324.054 divided by 315.605 (December 2024), which gives 2.7%.
*The latest CPI will be added to this table as soon as it is released by the BLS. See our release schedule section for the exact dates.
What was inflation in 2025?
There are two defensible answers and they differ slightly, which is why you will see both quoted around the web.
- 2.63 percent on an annual average basis. The 2025 annual average index of 321.943 against 2024’s 313.689. This is the figure to use when you are comparing whole years, and it is what our inflation rate by year table uses throughout.
- 2.69 percent if you average the eleven published monthly year over year rates instead. Fine as a summary, but it is an average of rates rather than a rate.
Either way, 2025 sat comfortably above the Federal Reserve’s 2 percent target without ever threatening to run away. The year never printed below 2.3 percent and never printed above 3.0 percent.
Month by month: how 2025 actually moved
The shape of the year was a dip and a recovery. January opened at 3.0 percent. Prices then cooled through the spring, bottoming at 2.3 percent in April, which was the softest reading of the year. March was the only month that went backwards at all, printing minus 0.1 percent month over month.
From May onwards it climbed steadily back: 2.4, 2.7, 2.7, 2.9, and back to 3.0 percent by September. The last two published months, November and December, settled at 2.7 percent.
If you want the equivalent view for the year before or the year after, we keep 2024 CPI and inflation data and 2026 US inflation and CPI data on the same format.
Why there is no October 2025 figure
This is the part that makes 2025 unusual, and it is worth being precise about because a lot of secondary sources have quietly filled the gap with numbers that do not exist.
Funding for the federal government lapsed from 1 October 2025 through 12 November 2025. The Bureau of Labor Statistics suspended most CPI operations, data collection included. Staff were briefly recalled between 9 and 24 October purely to finish the September report. Collection did not resume until Friday 14 November.
The consequence, in the BLS’s own words, is that “for most CPI series, October 2025 indexes were not published”, and no October CPI news release was issued at all. There is no October index, no October monthly change and no October annual rate. Anyone showing you one has estimated it.
Three knock-on effects are worth knowing:
| What changed | How BLS handled it |
|---|---|
| The 2025 annual average | Computed from the eleven published months rather than twelve. That is where 321.943 comes from, and it checks out: the eleven published index values average to exactly that. |
| The November monthly change | September prices were carried forward to stand in for October, then November was compared against those imputed figures. Rent and owners’ equivalent rent used the sixth root of the May to November change instead. |
| October 2026 annual rates | BLS has said it will not publish twelve month percent changes for October 2026 where the October 2025 base is missing. The gap propagates a full year forward. |
That last row is live right now. We are in October 2026, and for the affected series there is simply no year over year comparison to make this month. If you are tracking the current picture, our current US inflation rate page carries the monthly matrix, and the September 2026 CPI report has the most recent published reading.
What 2025 money is worth now
Using the September 2026 index of 336.940, $100 from 2025 buys about $104.66 worth of goods today. Running it the other way, here is what money from recent years is worth in 2025 dollars.
| $100 from | In 2025 dollars | That year’s inflation |
|---|---|---|
| 2016 | $134.14 | 1.3% |
| 2019 | $125.93 | 1.8% |
| 2020 | $124.39 | 1.2% |
| 2021 | $118.81 | 4.7% |
| 2022 | $110.01 | 8.0% |
| 2023 | $105.66 | 4.1% |
| 2024 | $102.63 | 3.0% |
The 2022 row is the one that still does the damage. A dollar from 2021 lost nearly a fifth of its purchasing power by 2025, and most of that happened in a single year.
2025 in context
Set against the preceding four years, 2025 reads as the year the post pandemic surge finally finished unwinding: 4.7 percent in 2021, 8.0 percent in 2022, 4.1 percent in 2023, 3.0 percent in 2024, then 2.63 percent. Four consecutive years of deceleration.
Whether that holds is a 2026 question. September 2026 printed 3.7 percent year over year, which is a meaningful step back up. For the long view, our CPI table going back to 1913 puts all of this on one page, and the basket of goods explains what the index is actually measuring.
2025 CPI & Inflation Charts
What is the CPI (Consumer Price Index)?
The CPI is the Consumer Price Index and is a metric used to measure inflation. The BLS releases a new CPI every month which represents the increase or decrease in the price of goods and services in several key categories.
The CPI is one of the most often used techniques for measuring inflation all over the world, not just in the United States. Each country scrutinizes different sets of local pricing data, yet all employ a similar method of analyzing price changes across a large basket of goods. In the US, there has been contention surrounding the CPI for many years Initially, it was calculated by contrasting a market basket of goods from two periods – effectively operating as a cost of goods index (COGI). Yet, the CPI eventually developed into a cost of living index (COLI), often resulting in a lower CPI.
How are inflation rates calculated?
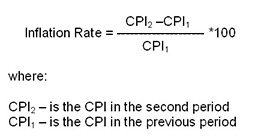
Monthly Consumer Price Index (CPI) data published by the Bureau of Labor Statistics is used to calculate inflation rates. The formula is as follows:
Notice something wrong with this table?
We do our best to ensure our data are accurate. However, mistakes do happen. If one of the numbers displayed above seems wrong, please contact us and we will fix it immediately.
Frequently asked questions about 2025 inflation
What was the inflation rate in 2025?
2.63 percent, measured as the change in the annual average CPI-U from 313.689 in 2024 to 321.943 in 2025. If you average the eleven published monthly year over year rates instead, you get 2.69 percent. Both are quoted; the first is the standard annual comparison.
Why is October 2025 missing from the table?
Because it was never published. Federal funding lapsed from 1 October to 12 November 2025 and the Bureau of Labor Statistics suspended CPI data collection for the duration. No October index, no October news release. BLS states that for most CPI series the October 2025 indexes were not published, and it has not committed to publishing them later.
Is the 2025 annual average still valid with a month missing?
Yes, and BLS says how it was built: the annual average for affected series is the average of the eleven published index values rather than twelve. Those eleven values do average to 321.943 exactly, so the figure is internally consistent. It is just computed on eleven months, which is worth knowing if you are doing precise work.
What was the highest and lowest inflation rate in 2025?
The high was 3.0 percent, reached in January and again in September. The low was 2.3 percent in April. March was the only month with a negative monthly change, at minus 0.1 percent.
How much is $100 from 2025 worth today?
About $104.66, using the September 2026 CPI of 336.940 against the 2025 annual average of 321.943. In other words 2025 money has lost roughly 4.5 percent of its purchasing power so far.
Was 2025 inflation higher or lower than 2024?
Lower. On the same annual average basis 2024 came in at 2.95 percent against 2025 at 2.63 percent. Our 2024 page quotes 2.96 percent, which is that year’s average of monthly rates rather than the annual average comparison, so the small difference is method and not an error. That made 2025 the fourth consecutive year of deceleration after the 8.0 percent peak in 2022, and the mildest year since 2020.
Why can I not add the monthly rates together to get the annual rate?
Two reasons. Percentage changes compound rather than sum, so adding them overstates the result. And the monthly column is seasonally adjusted while the index and the yearly column are not, so they sit on different bases and cannot be combined arithmetically at all.
Will the missing October data affect future figures?
It already does. BLS has said it will not publish twelve month percent changes for October 2026 for the series where October 2025 is unavailable, because there is no base to compare against. The gap travels a full year forward before it clears.
Which CPI series are these numbers from?
CPI-U, the Consumer Price Index for All Urban Consumers, US city average, all items. That is the series most people mean by “the inflation rate” and the one used for the figures on this site. The index values shown are not seasonally adjusted.
Index values and percentage changes from the U.S. Bureau of Labor Statistics, CPI-U, US city average, all items. Annual average for 2025 computed by BLS from the eleven published monthly values. Purchasing power comparisons use the September 2026 index of 336.940.