-v3")
 Just ahead of the the FOMC’s two day deliberation over a potential interest rate hike, the BLS released August’s inflation data this morning. Headline inflation or the Consumer Price Index for Urban Consumers (CPI-U) fell a seasonally adjusted 0.1% for the month of August, in line with economists’ expectations. This follows July’s lacklustre 0.1% CPI-U growth which was below expectations. For the year ending in August, non-seasonally adjusted overall inflation was 0.2% for the second month in row.
Core Inflation, which excludes food and energy was up a seasonally adjusted 0.1% in the month of August. This follows an increase of 0.1% in July, which was driven by a spike in the cost of shelter. We continue to see a large disparity between core and overall CPI as food and energy prices remain very volitile. 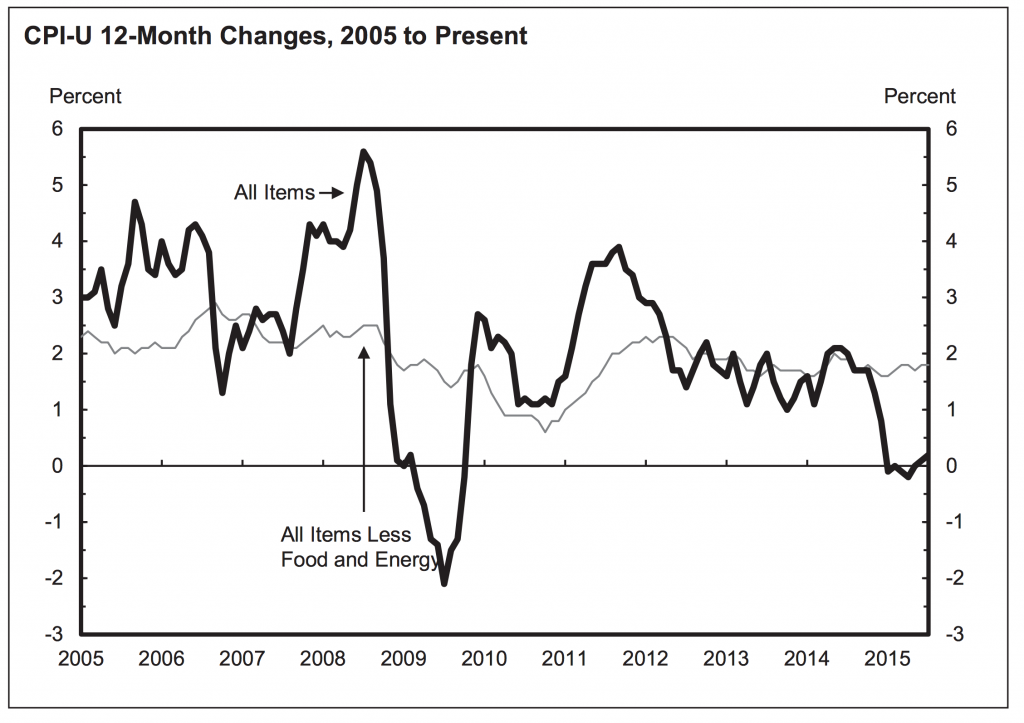
Seasonally Adjusted Monthly Numbers
In August, lower energy prices were not quite offset by higher prices for food, apparel and energy services, sending seasonally adjusted inflation below zero for the month.
Seasonally Adjusted Monthly % Change in CPI-U by Category (2016)
| January | February | March | April | May | June | July | |
|---|---|---|---|---|---|---|---|
| All Items | 0 | -0.2 | 0.1 | 0.4 | 0.2 | 0.2 | 0.0 |
| Food | 0 | 0.2 | -0.2 | 0.2 | -0.2 | -0.1 | 0.0 |
| Energy | -2.8 | -6.0 | 0.9 | 3.4 | 1.2 | 1.3 | -1.6 |
| Gasoline | -4.8 | -12.5 | 2.2 | 8.1 | 2.3 | 3.3 | -4.7 |
| Fuel Oil (non seasonally adjusted) | -6.5 | -2.9 | 1.7 | 1.9 | 6.2 | 3.7 | -1.5 |
| Electricity | -0.7 | -0.2 | 0.4 | -0.3 | -0.2 | -0.5 | 0.5 |
| Utilities (piped gas service) | -0.6 | 1.0 | -0.7 | 0.6 | 1.7 | -0.4 | 3.1 |
| Energy Services | -0.7 | 0.1 | 0.2 | -0.1 | 0.2 | -0.5 | 1.0 |
| All Items Less Food and Energy | 0.3 | 0.3 | 0.1 | 0.2 | 0.2 | 0.2 | 0.1 |
| Services Less Energy Services | 0.3 | 0.3 | 0.2 | 0.3 | 0.4 | 0.3 | 0.2 |
| Shelter | 0.3 | 0.3 | 0.2 | 0.3 | 0.4 | 0.3 | 0.2 |
| Transportation Services | 0.4 | 0.2 | 0.2 | 0.7 | 0.3 | 0.3 | -0.2 |
| Medical Care Services | 0.5 | 0.5 | 0.1 | 0.3 | 0.5 | 0.2 | 0.5 |
The energy index was down 2.0% for the month for August due to a drop in gas prices. On a seasonally adjusted basis, the gasoline index fell 4.1% in August following 3 consecutive months of growth including a 10.4% spike in May. Before seasonal adjustments, gas prices were 5.4% lower in August (see graph below). The price of fuel oil also fell a drastic 8.1% in August adding to declines in June and July. At the same time, energy services including electricity and piped gas were more expensive in August, climbing a seasonally adjusted 0.3% and 1.2% respectively.
The index for food climbed 0.2% in August, driven by significant growth in the price of fruits, vegetables and eggs. The fruits and vegetable index was 1.5% higher for the month. The price of eggs also spiked 7.7% while the indexes for meat, fish and poultry were generally lower.
Without food and energy, which are very volatile, the index for all items or core index increased 0.1% for the second consecutive month. This includes the shelter index which continues to climb, increasing 0.2% in August following larger increases in June (+0.3%) and July (+0.4%). Growth in shelter costs continues to be a major driver of core inflation. Price increases were also seen in apparel, tobacco, alcohol, medical care commodities and non-energy services.
After falling 5.6% in July, the price of airline tickets continued to decline in August, down 3.1% for the month. Other factors keeping seasonally adjusted inflation below zero in August include declines in the prices of used cars and trucks (-0.4%), household furnishings (-0.3%) and recreation (-0.1%).
Annual Inflation
Year over year, the all items index increased 0.2% in August. The number, which has been rising since April, was also 0.2% in July. Food and shelter costs were significantly higher over both annual periods. Prior to seasonal adjustment, the price of food was up 1.6% for the year ending in August, the same as the year ending in July. Shelter costs were 3.1% higher for the 12-month period. The indexes for transportation, medical care services and non-energy services were all higher, up 2.1%, 2.2% and 2.6% respectively.
Despite higher prices in many parts of the economy, sever declines in energy prices for the year ending in August kept inflation tame. The energy index fell 15% for the year ending in August including declines in all major components. The most drastic fall was in the price of fuel oil, down 34.6% for the year. The gas index was down 23.3% and piped gas services were 11.5% cheaper for the year.
The index for all items less food and energy was in line with July, rising 1.8% over both 12-month periods. August marks the fifth time in 6 months that the 12-month change in core inflation was 1.8 percent. Annual core inflation was driven by higher prices for shelter, health care, new vehicles and recreation. While apparel, used vehicles, household goods and air travel have all posted 12-month price declines.
Outlook for the Fed
A high inflation number would have been welcome news for the Federal Reserve as it would have been a missing piece pointing to a strengthening economy and giving them the opportunity to raise interest rates for the first time since 2006. Most other U.S. economic data is more positive. Unemployment was down in August for the third consecutive month and hovering around what the Fed considers ‘full employment‘ at 5.1%. However, with inflation quite stagnant, a rate hike is unlikely this month
Emerging markets, struggling since the recent downturn in China, would be vulnerable to a U.S. rate hike. Higher rates would strengthen the U.S. dollar. Emerging markets, with U.S. dollar denominated debt would struggle to repay loans. Markets are currently pricing in a U.S. rate hike in December. Today’s inflation data was inline with expectations and will not change the market’s expectations regarding the timing of rate increases.


Emily is a Canadian financial blogger with multiple degrees in economics and extensive professional experience as a financial analyst. She was formerly a Ph.D. candidate at the University of Guelph's School of Agricultural Economics. Before that, she received an MA from the University of San Francisco in International Development Economics. She also has a BA in Math with a minor in Economics.
