-v3")
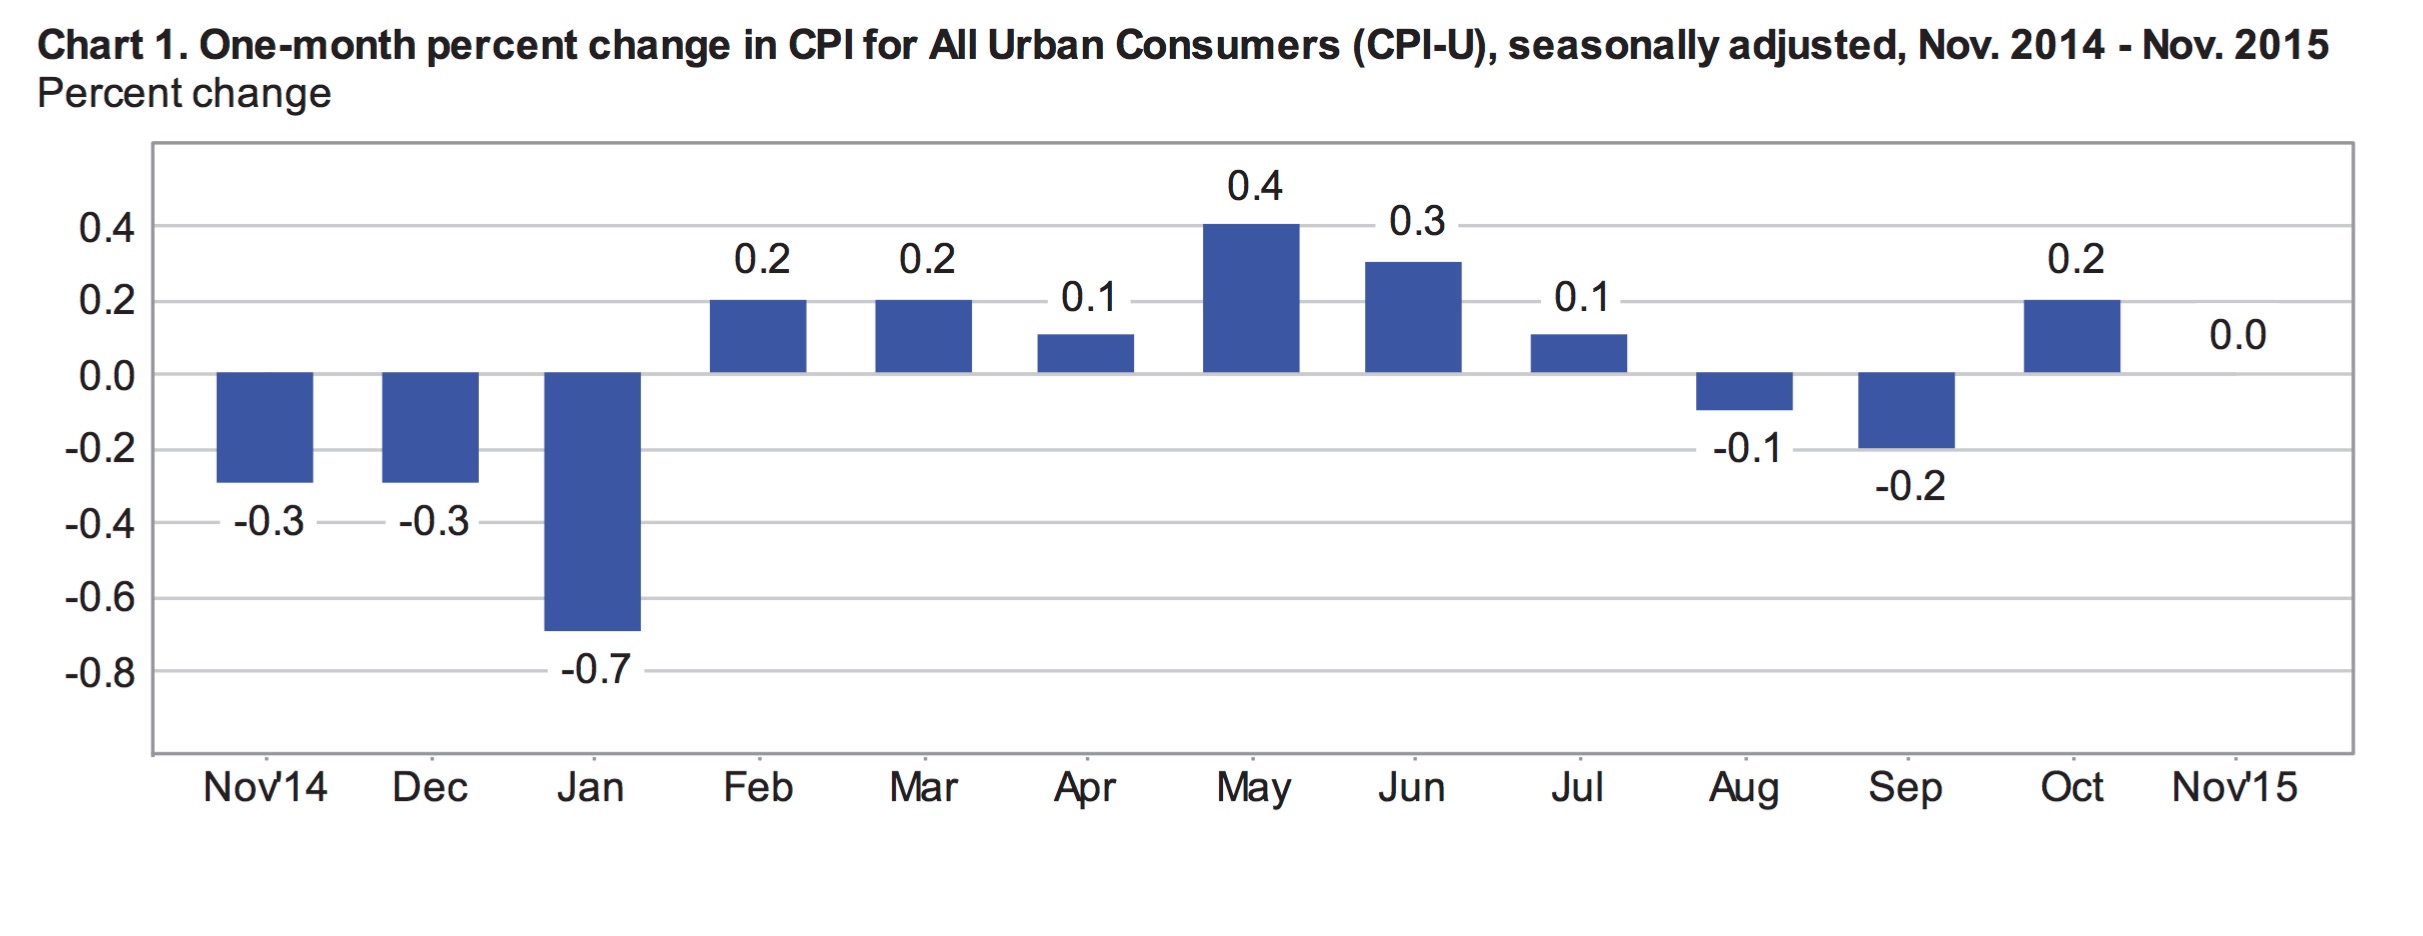
This morning, the Bureau of Labor Statistics released consumer inflation numbers for November. The Consumer Price Index for all Urban Consumers (CPI-U) was unchanged for the month following seasonal adjustments. This is what most analysts had expected. As the chart below illustrates, net inflation since July remains flat. November saw declines in energy and food costs offset by higher prices for shelter and medical care services. For the 12-months ending in November, the headline index rose an unadjusted 0.5%, the highest annual inflation number since 2014.
Excluding food and energy, seasonally adjusted core prices rose 0.2% in November, which was also what most analysts had forecast. Adjusted core prices have increased by 0.2% for three months in a row and have stayed between 0.1% and 0.3% throughout 2015. For the year ending in November, core inflation was 2%.

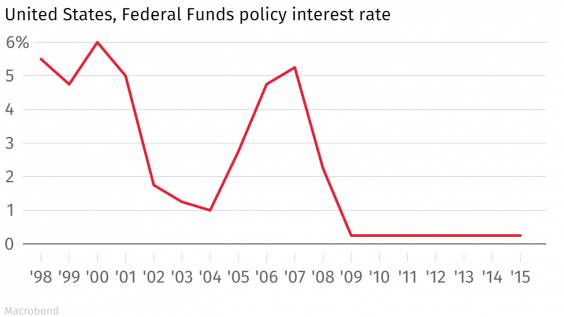
These numbers point to underlying inflationary pressure and support the Federal Reserve’s highly anticipated rate hike, which will likely be announced tomorrow following their meeting. The Fed has kept interest rates at 0.25% since 2009.
November’s Inflation
Overall, seasonally adjusted prices were flat in November as declines in the indexes for food and energy were offset by higher prices for shelter, transportation services and medical services. The index for all items less food and energy climbed a seasonally adjusted 0.2% in November, in line with expectations. The more volatile food and energy indexes were down 0.1% and 1.3% respectively, after seasonal adjustments.
Seasonally Adjusted Monthly % Change in CPI-U by Category (2016)
| January | February | March | April | May | June | July | |
|---|---|---|---|---|---|---|---|
| All Items | 0 | -0.2 | 0.1 | 0.4 | 0.2 | 0.2 | 0.0 |
| Food | 0 | 0.2 | -0.2 | 0.2 | -0.2 | -0.1 | 0.0 |
| Energy | -2.8 | -6.0 | 0.9 | 3.4 | 1.2 | 1.3 | -1.6 |
| Gasoline | -4.8 | -12.5 | 2.2 | 8.1 | 2.3 | 3.3 | -4.7 |
| Fuel Oil (non seasonally adjusted) | -6.5 | -2.9 | 1.7 | 1.9 | 6.2 | 3.7 | -1.5 |
| Electricity | -0.7 | -0.2 | 0.4 | -0.3 | -0.2 | -0.5 | 0.5 |
| Utilities (piped gas service) | -0.6 | 1.0 | -0.7 | 0.6 | 1.7 | -0.4 | 3.1 |
| Energy Services | -0.7 | 0.1 | 0.2 | -0.1 | 0.2 | -0.5 | 1.0 |
| All Items Less Food and Energy | 0.3 | 0.3 | 0.1 | 0.2 | 0.2 | 0.2 | 0.1 |
| Services Less Energy Services | 0.3 | 0.3 | 0.2 | 0.3 | 0.4 | 0.3 | 0.2 |
| Shelter | 0.3 | 0.3 | 0.2 | 0.3 | 0.4 | 0.3 | 0.2 |
| Transportation Services | 0.4 | 0.2 | 0.2 | 0.7 | 0.3 | 0.3 | -0.2 |
| Medical Care Services | 0.5 | 0.5 | 0.1 | 0.3 | 0.5 | 0.2 | 0.5 |
The monthly decline in the food index is its first drop in 8 months. The index for food at home fell 0.3% in November. Aside from fruits and vegetables, which were 0.6% higher for the month, every other component of the index for food at home fell. Prices for meat, fish, poultry and dairy products continue to decline. However, the adjusted index for food away from home climbed 0.2% in November.
The decline in the energy index resulted from lower gas prices, down a seasonally adjusted 2.4% in November. Gas prices have been very volatile in 2015, falling over 18% in January and climbing over 10% in May. Shelter costs continue to rise steadily, up 0.2% in November following increases of 0.3% in September and October. Prices are also rising steadily in the service sectors, up 0.3% for the third month in a row. Transportation and medical care services were up 0.6% and 0.4% respectively.
Annual Inflation
For the 12-months ending in November, unadjusted prices were up 0.5% overall. The increase in overall price levels was largely driven by higher shelter costs, which account for 33.2% of the overall index. Unadjusted shelter costs were 3.2% higher over the 12-month period. The index for rental costs (primary residence) climbed 3.6% during the year, while moving expenses were 7.1% higher.
Food prices, which account for about 14% of the overall index, were up 1.3% for the year ending in November. The index for food at home, which is about 60% of the overall food index was only up 0.3% year over year. This marks its smallest annual increase in over 5 years. The prices for meat, fish, poultry and eggs are all down year over year while the prices for bread, fruits and vegetables are higher. The index for food away from home climbed 2.7%. A significant hike (4.9%) in the index for food at employee sites and schools was the primary reason for higher costs for food away from home.
The energy index makes up approximately 7.4% of the CPI-U and about half of the energy index is energy commodities and the other half energy services. For the year ending in November, the overall energy index fell 14.7% including a 24.2% decline in energy commodities and a 2.8% decline in energy services. Among the energy commodities, the index for fuel oil had the largest decline, down 31.4% for the year. Over the same 12-months, the index for gasoline (all types) fell 24.1%.
Outlook
It is highly expected that the Federal Reserve will raise interest rates by a quarter of a percentage point on Wednesday. According to the Wall Street Journal, 97% of economists surveyed expect the fed to raise rates this week. This would be the first rate hike in nearly a decade as the economy and employment appear to finally be returning to solid ground.
What remains largely an unknown at this point is the pace of future rate hikes. This will largely be a function of inflation expectations. With overall inflation continuing to lag well below the Fed’s target, the pace of future rate hikes may likely be slow. According to David Jones, chief economist at DMJ Advisors:


Emily is a Canadian financial blogger with multiple degrees in economics and extensive professional experience as a financial analyst. She was formerly a Ph.D. candidate at the University of Guelph's School of Agricultural Economics. Before that, she received an MA from the University of San Francisco in International Development Economics. She also has a BA in Math with a minor in Economics.
