by Sarah Bauder | Oct 13, 2022 | CPI
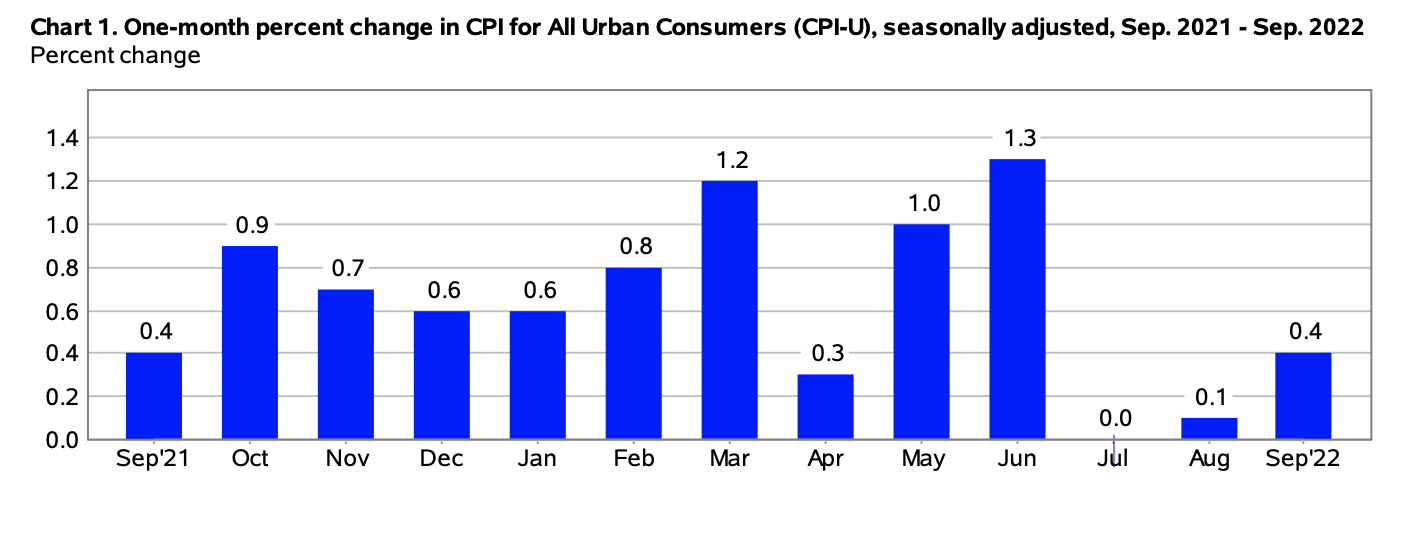
The Consumer Price Index for All Urban Consumers (CPI-U) increased 0.4% on a seasonally adjusted basis, reported the Bureau of Labor Statistics. Year-over-year, before seasonal adjustment the all items index grew by 8.2%.
The primary reason for the percentage increase seen in September was the food, shelter, and medical care indexes. However, a 4.9% decline in gas prices compensated for the percentage rise seen in other indexes.
For American consumers, unfortunately, this means an increase in the prices of foodstuffs from grocery stores. Likewise, Americans paid more for medical care and shelter costs in September. Although inflation cooled slightly for the month, prices for daily necessities continue to rise. Given this fact, the Federal Reserve has indicated that higher interest rates will remain, until the prices of goods begin to decline.
Energy
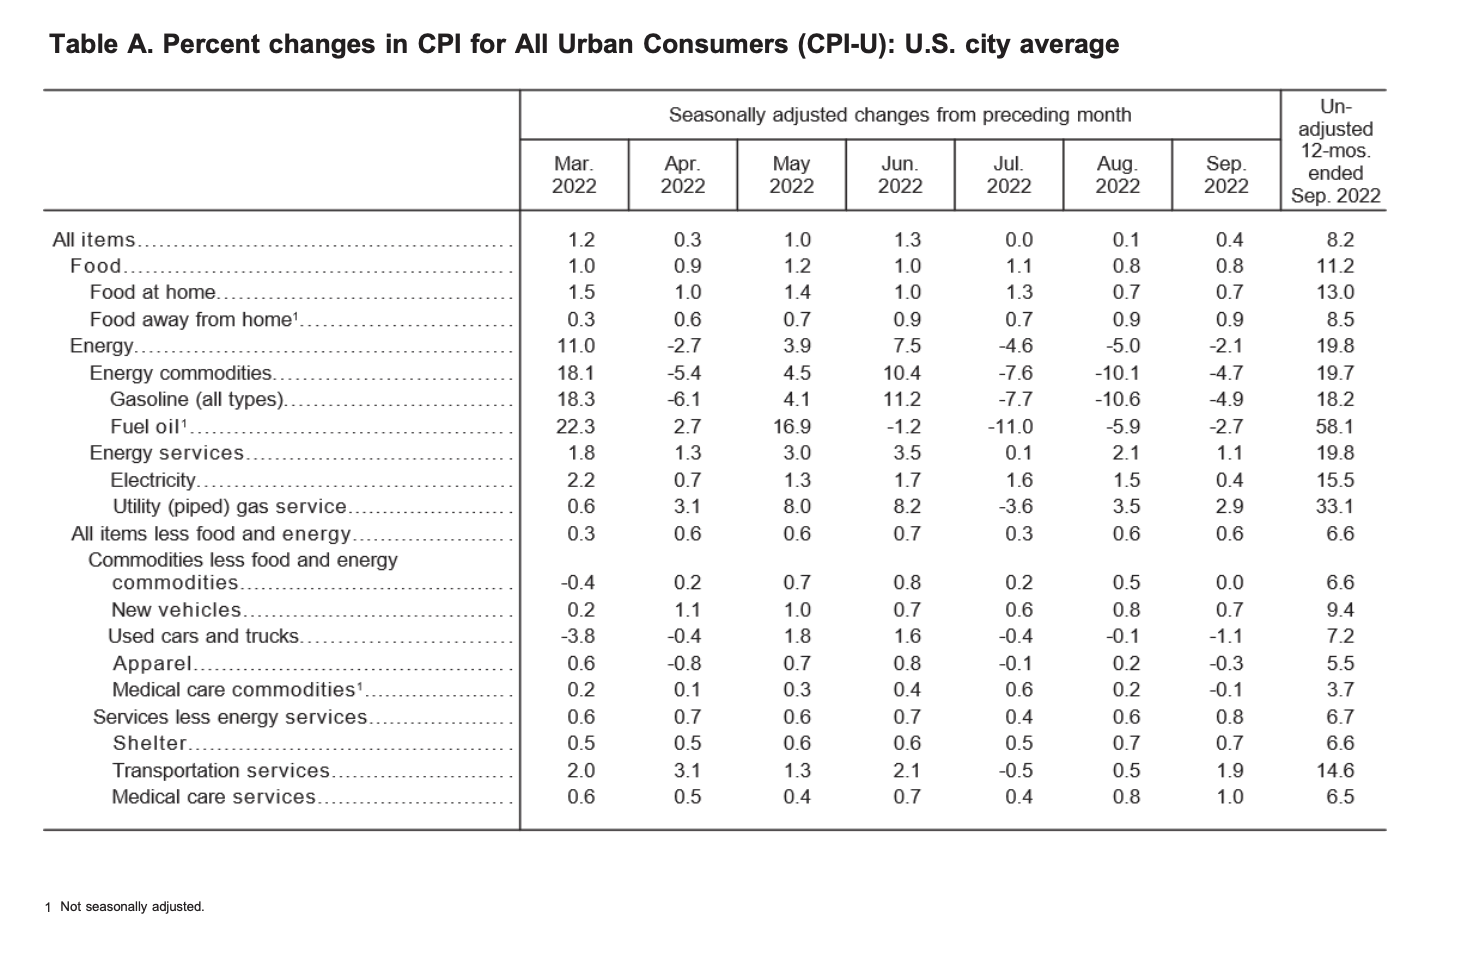
In September, the index for energy dropped 2.1%. Americans paid less at the pumps, as gasoline prices decreased over the month. Yet, the natural gas index rose 2.9%, as did the index for electricity, which edged up 0.4% in September.
Over the last 12-month period, the index for energy grew by 19.8%. Year-over-year, fuel oil prices skyrocketed by 58.1%. Furthermore, the price of natural gas soared 33.1%, and electricity prices 15.5% since this time last year.
(Source: U.S. Bureau of Labor Statistics)
Gasoline Prices
In September, American consumers once again paid less at the pumps. The price of gasoline declined 4.9% over the month. This marks the third consecutive monthly drop in the price of gasoline, after the 10.6% drop seen in August, and the 7.7% decrease in July.
In September, prior to seasonal adjustment, gasoline prices declined by 5.6%.
Year-over-year, the price of gasoline rose by 18.2%.
Food
In September, the index for food edged up 0.8%, the identical percentage increase seen in August. Over the last 12-month period, American consumers have paid 13% more for food items from grocery stores.
Foodstuffs that saw the largest price increase in September included fruits and vegetables (1.6%), cereals and bakery products (0.9%), meats, poultry, fish, and eggs (0.4%), and non-alcoholic beverages (0.6%). Furthermore, as in August, American consumers paid more to dine out in restaurants in September.
(Source: U.S. Bureau of Labor Statistics)
All Items Less Food and Energy
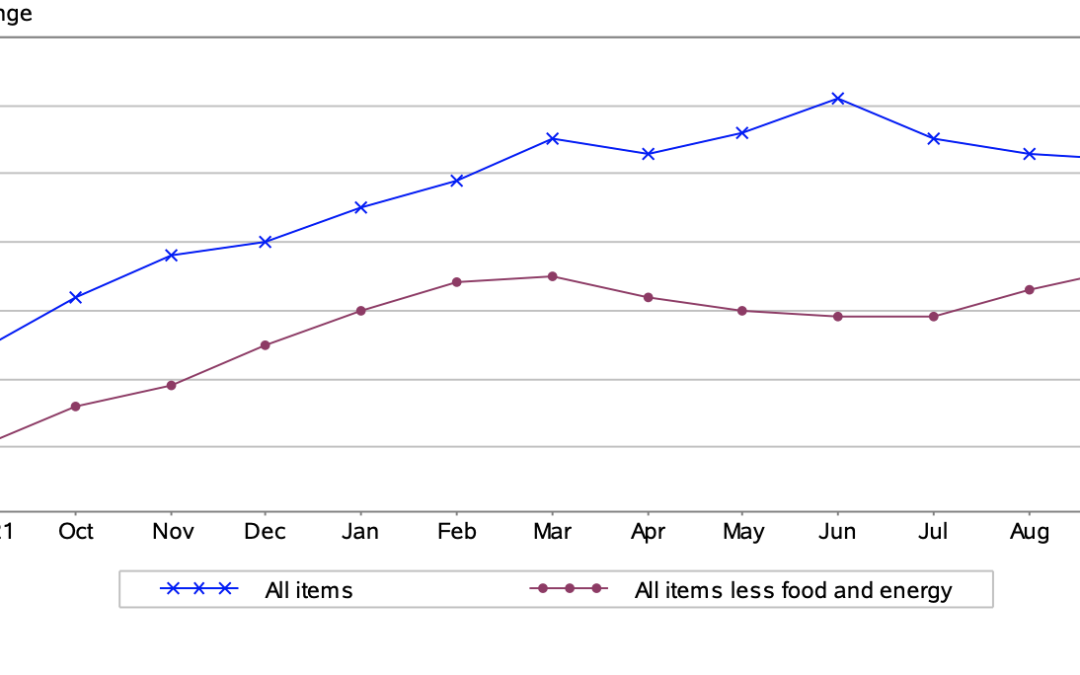
In September, the all items less food and energy index increased by 0.6%, the same percentage increase seen the previous month. American consumers continued to pay more shelter costs. The index for shelter rose 0.7% for the month.
The index for rent edged up by 0.8%, as did the index for owners’ equivalent rent, which is correlated to the value of housing prices. Furthermore, Americans paid more for medical care, as the medical care index increased by 0.8% in September. The physicians’ services index rose 0.5%, as did the hospital services index by 0.1%.
Conversely, Americans paid 0.1% less for prescription drugs in September.
Since this time last year, the all items less food and energy index grew by 6.6%. The Bureau of Labor Statistics noted that this was the largest year-over-year rise in the index in 40 years, specifically since August 1982.
Over the last 12-month period, the composite index for shelter increased by 6.6% – contributing to over 40% of the percentage rise in the all items less food and energy index.
Want to learn more about how inflation is impacting the economy? Have a look at our table highlighting information regarding the 2022 CPI and Inflation Rate for the United States, try our calculator widget, and subscribe to our newsletter.
Source Cited: https://www.bls.gov/news.release/archives/cpi_10132022.htm
by Sarah Bauder | Sep 13, 2022 | BLS, CPI
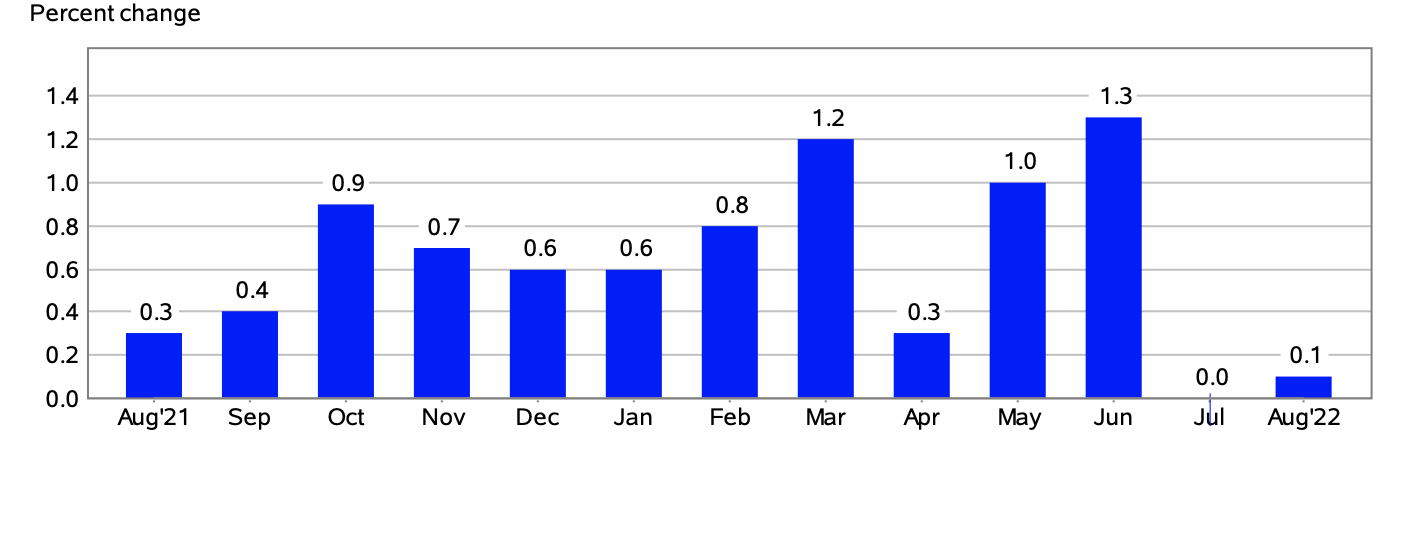
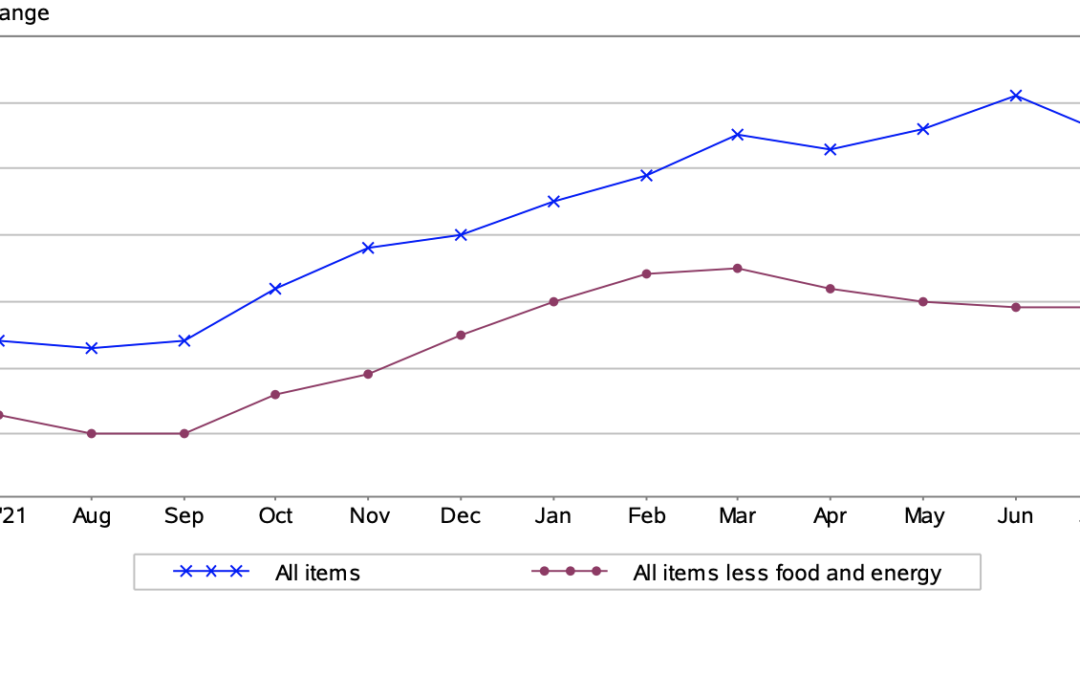
The Consumer Price Index for All Urban Consumers (CPI-U) edged up by 0.1% on a seasonally adjusted basis in August, reported the U.S. Bureau of Labor Statistics. Year-over-year, prior to seasonal adjustment the all items index rose 8.3%.
The principal reason for the percentage increase seen in August was a rise in the food, shelter, and medical care indexes. Conversely, there was a 10.6% decrease in the price of gasoline for the month which counteracted percentage increases seen with other indexes.
“The indexes for shelter, medical care, household furnishings and operations, new vehicles, motor vehicle insurance, and education were among those that increased over the month,” explained the Bureau of Labor Statistics in its monthly report.
For American consumers, this means that they paid more for foodstuffs at the grocery store, shelter costs, and medical care costs among other areas of everyday life. The continued acceleration in inflation means many Americans are still grappling with meeting basic daily needs.
Given the fact that inflation is still at historically high levels, last week the Fed indicated that there would likely be a significant increase in interest rates later this month.
(Source: U.S. Bureau of Labor Statistics)
Food
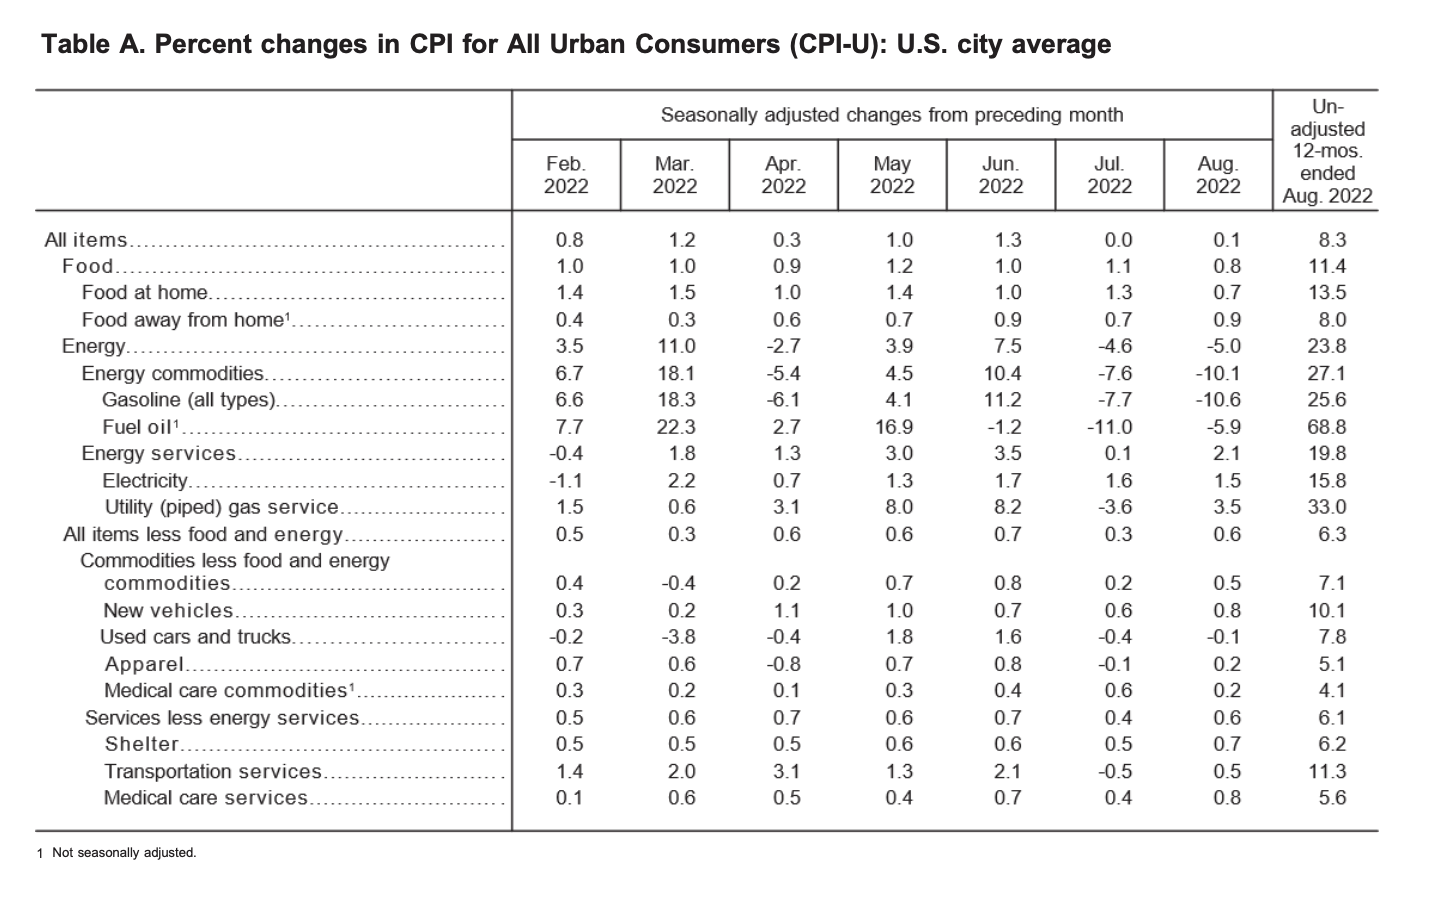
In August, the index for food rose 0.8%. Since this time last year, American consumers have paid 13.5% more for foodstuffs at grocery stores. It should be noted that this was the highest year-over-year percentage increase seen since May 1979.
Grocery items that were the main contributors to the overall rise in the index included fruits and vegetables, eggs, meat, poultry, fish, cereal products, bakery products, dairy products, and nonalcoholic beverages. In addition, American consumers paid more to dine out at restaurants in August.
The Price of Gasoline
Conversely, American consumers enjoyed a bit of respite at the gas pumps in August. The price of gasoline dropped by 10.6%. This is the second consecutive monthly decline in gas prices following a 7.7% drop at the pumps seen in July.
In August, prior to seasonal adjustment, the price of gasoline dropped by 12.2%.
Over the last 12-month period, gasoline prices soared 25.6%.
Energy
In August, the energy index decreased 5%, largely due to the decline in gas prices. Yet, American consumers paid 1.5% more for electricity over the month. Likewise, the natural gas index also rose by 3.5%.
Since this time last year, the index for energy increased by 23.8%. Year-over-year, the price of fuel oil skyrocketed an astounding 68.8%. Natural gas prices likewise soared 33% since this time last year. In addition, over the last 12-month period, American consumers paid 15.8% more for electricity – the largest year-over-year rise since August 1981.
(Source: U.S. Bureau of Labor Statistics)
All Items Less Food and Energy
In August, the all items less food and energy index edged up 0.6%. American consumers continued to pay more for shelter, as the index rose 0.7% over the month.
Rent prices also increased 0.7%, as did the index for owners’ equivalent rent, which is correlated to the value of housing prices.
Moreover, Americans also paid 0.7% more for medical costs over the month. In August, all major medical care composite indexes saw percentage increases. The hospital services index rose 0.7%, the price of prescription drugs grew by 0.4%, and the physicians’ services index also edged up by 0.2%.
Over the last 12-month period, the all items less food and energy index increased by 6.3%. Year-over-year, the composite index for shelter increased by 6.2%, which contributed to roughly 40% of the total growth of the index for all items less food and energy.
Likewise, American consumers paid 5.4% more for medical care since this time last year.
Want to learn more about how inflation is impacting the economy? Here is our table highlighting the 2022 CPI and Inflation Rate for the United States, try our U.S. inflation calculator, and subscribe to our newsletter.
Source Cited: https://www.bls.gov/news.release/archives/cpi_09132022.htm
by Sarah Bauder | Aug 11, 2022 | CPI
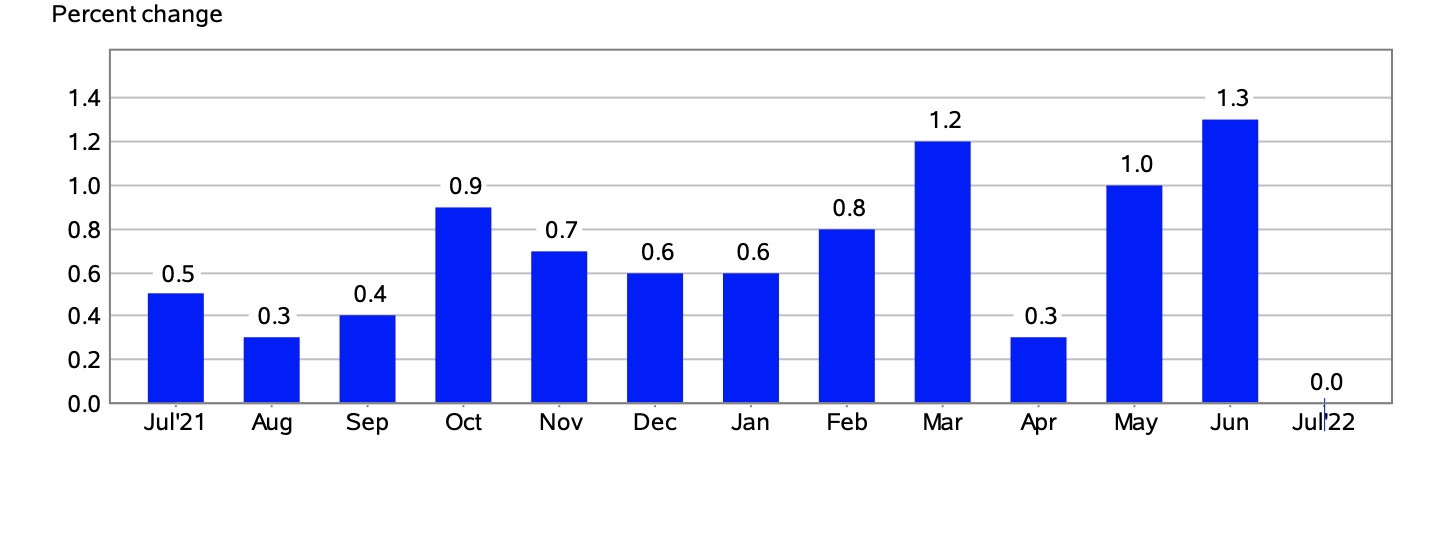
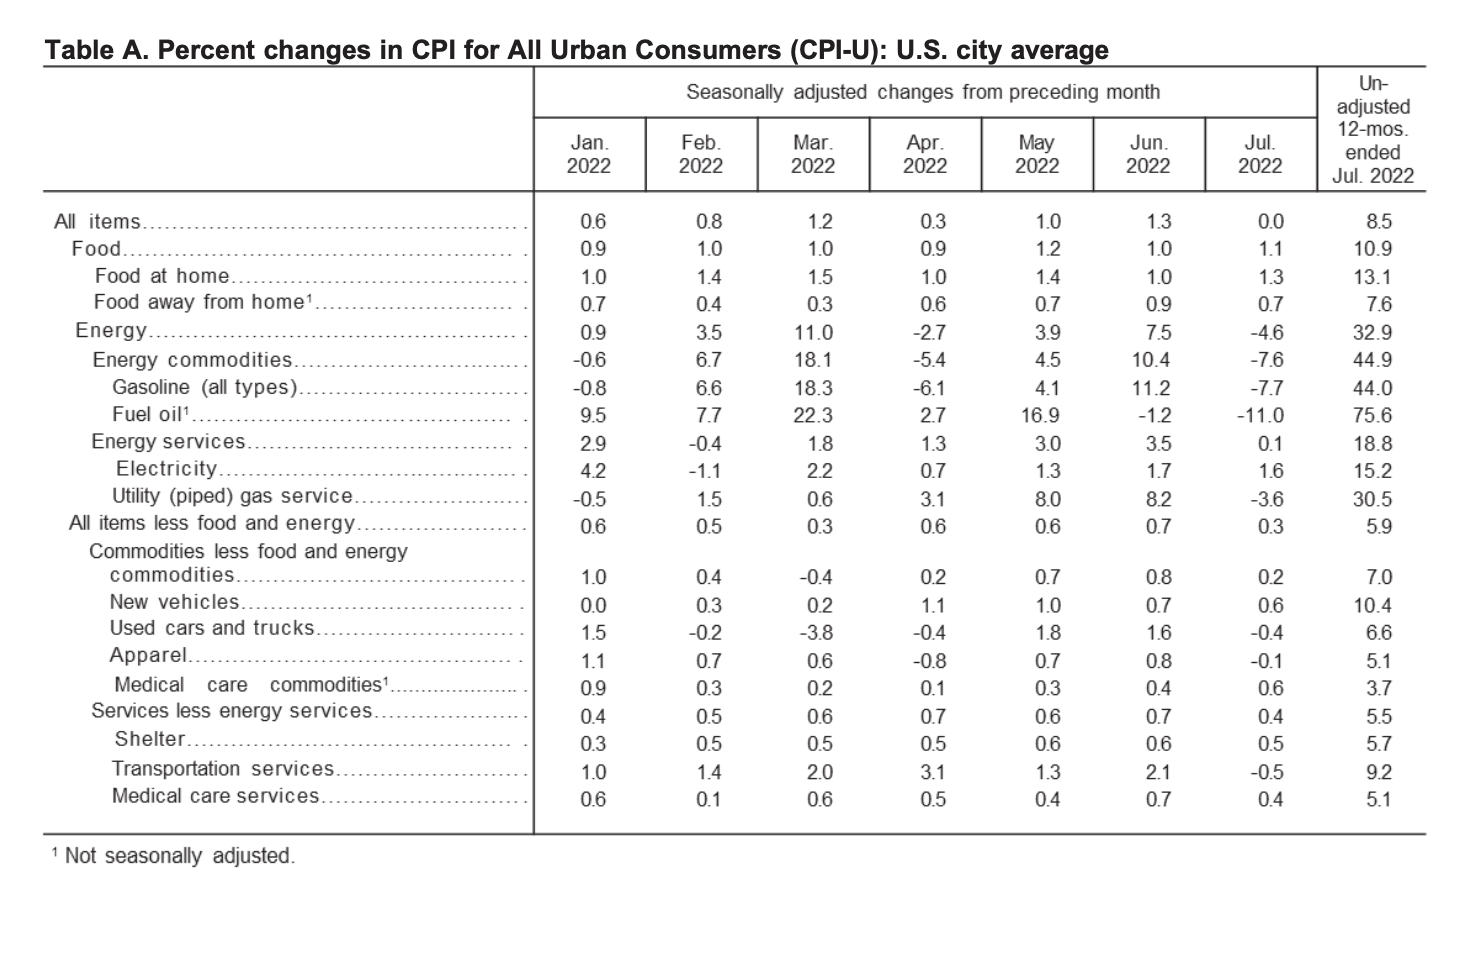
The Consumer Price Index for All Urban Consumers (CPI-U) remained unchanged in July on a seasonally adjusted basis, after a 1.3% increase seen in June, reported the U.S. Bureau of Labor Statistics (BLS). Since this time last year, prior to seasonal adjustment, the all items index grew 8.5%.
In July, American consumers received a bit of relief at the pumps, as gas prices dropped 7.7%. This decrease in the composite index for gasoline was the principal reason for the seasonally adjusted monthly CPI remaining unchanged. Likewise, the decrease in gas prices, as well as the natural gas index, also contributed to the 4.6% monthly decline in the energy index.
Conversely, the index for food rose 1.1% in July mainly because of the 1.3% increase in the composite index for food at home. This means that American consumers paid more for food from grocery stores over the month.
Overall, since this time last year, the all items index rose 8.5%. Additionally, the index for all items less food and energy also increased by 5.9% year-over-year. Most pointedly, the index for food rose 10.9% over the last 12-month period. This marked “ the largest 12-month increase since the period ending May 1979,” explained the U.S. Bureau of Labor Statistics in its monthly report.
The predominant sentiment among Americans is that of uncertainty pertaining to the overall health of the U.S. economy. Interestingly, a recent McKinsey & Company report found that a staggering 30% of U.S. consumers expressed trepidation about a looming recession.
(Source: U.S. Bureau of Labor Statistics)
Food
In July, the index for food rose 1.1%, marking the seventh consecutive monthly increase. The index for food at home increased by 1.3% for the month, with all six major grocery store food group indexes seeing a rise in percentage.
This underscores concerns about food inflation, and specifically how the average American is contending with rising food prices to meet basic daily expenses.
Furthermore, in July U.S. consumers paid more to dine out at restaurants. The index for food away from home edged up 0.7% for the month.
Year-over-year, food prices in grocery stores rose 13.1%. Foodstuffs that saw the most significant percentage increase over the last 12-month period included cereals and bakery products (15%), fruits and vegetables (9.3%), and dairy products (14.9%).
Energy
In July, the index for energy decreased 4.6%, after a 7.5% rise the previous month. The price of gasoline dropped by 7.7%, after rising in June by 11.2%. The natural gas index fell by 3.6%, while the index for electricity increased 1.6% for the month.
Year-over-year, the price of gas soared 44% in July. Overall, the index for energy grew by 32.9% since this time last year. American consumers also paid more for electricity (15.2%) and natural gas (30.5%) over the last 12-month span.
(Source: U.S. Bureau of Labor Statistics)
All Items Less Food and Energy
In July, the index for all items less food and energy edged up 0.3%. The index for shelter grew by 0.5%, the owners’ equivalent rent index increased 0.6%, and the rent index increased 0.7%.
Since this time last year, American consumers paid more to shelter themselves. Specifically, the index for shelter increased 5.7% year-over-year. The Bureau of Labor Statistics explained that this composite index percentage increase was the primary factor for the overall rise in the all items less food and energy index.
Want to learn more about how inflation is impacting the economy? Have a look at our table highlighting information regarding the 2022 CPI and Inflation Rate for the United States, try our calculator widget, and subscribe to our newsletter.
Source Cited: https://www.bls.gov/news.release/archives/cpi_08102022.htm
by Sarah Bauder | Jul 13, 2022 | CPI
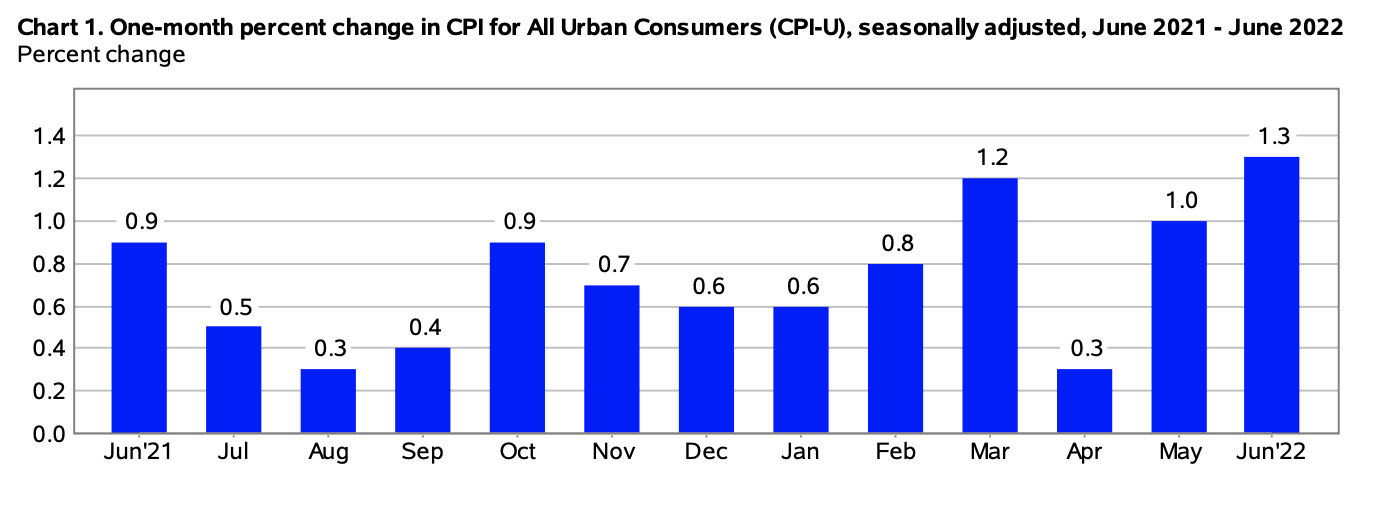
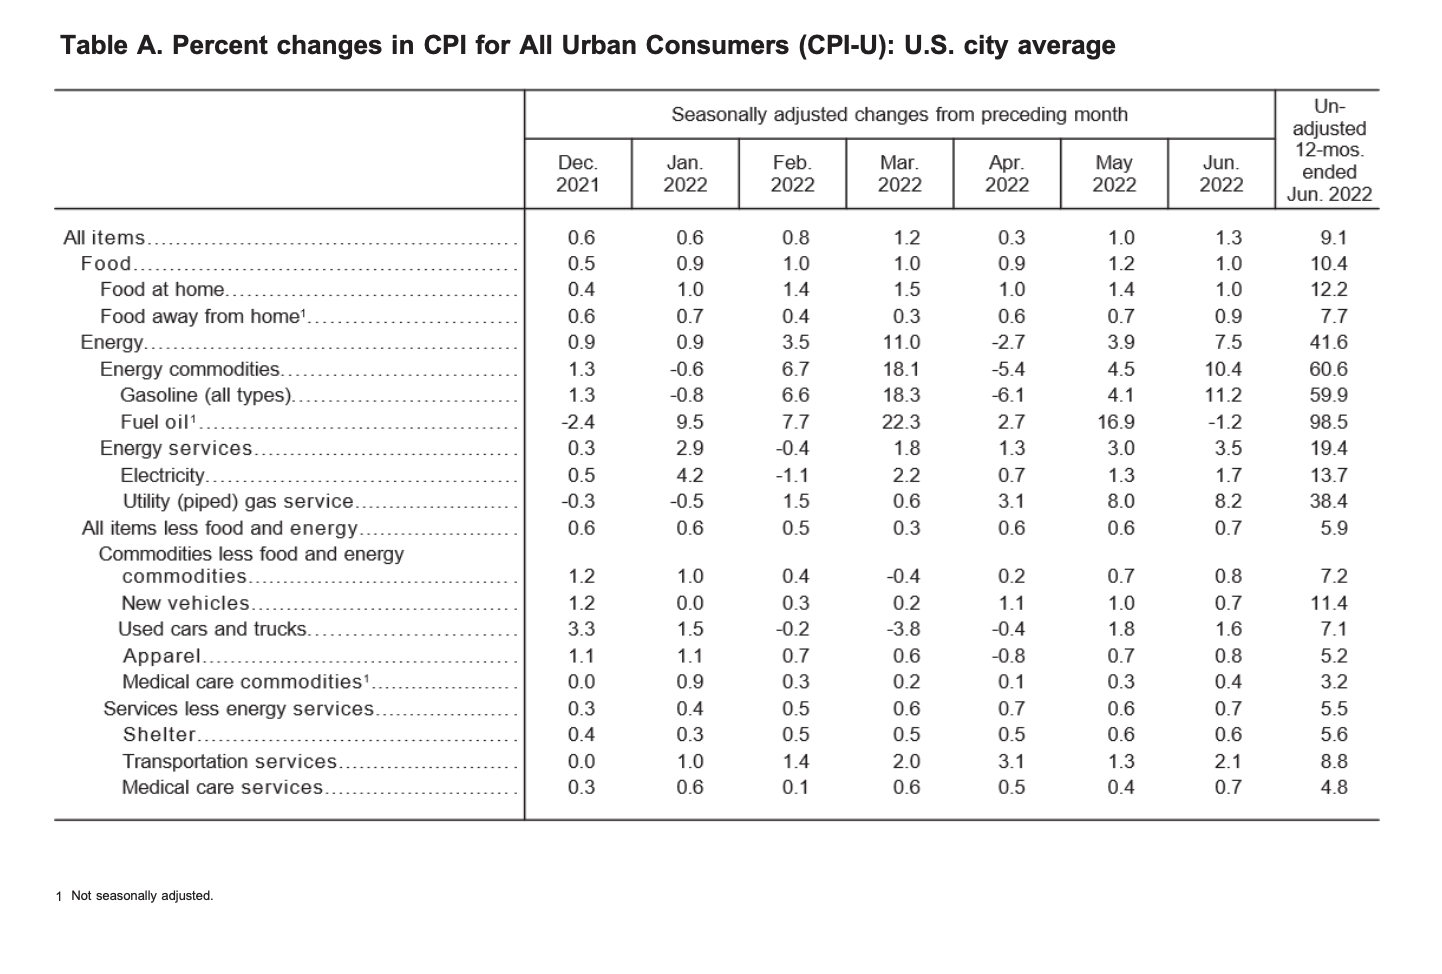
The Consumer Price Index for All Urban Consumers (CPI-U) grew by 1.3% on a seasonally adjusted basis in June, reported the U.S. Bureau of Labor Statistics. Over the last 12-month span, prior to seasonal adjustment, the all items index grew 9.1%.
“The increase was broad-based, with the indexes for gasoline, shelter, and food being the largest contributors. The energy index rose 7.5% over the month and contributed nearly half of the all items increase, with the gasoline index rising 11.2% and the other major component indexes also rising. The food index rose 1.0% in June, as did the food at home index.
The index for all items less food and energy rose 0.7% in June, after increasing 0.6% in the preceding two months. While almost all major component indexes increased over the month, the largest contributors were the indexes for shelter, used cars and trucks, medical care, motor vehicle insurance, and new vehicles. The indexes for motor vehicle repair, apparel, household furnishings and operations, and recreation also increased in June. Among the few major component indexes to decline in June were lodging away from home and airline fares.
The all items index increased 9.1% for the 12 months ending June, the largest 12-month increase since the period ending November 1981. The all items less food and energy index rose 5.9% over the last 12 months. The energy index rose 41.6% over the last year, the largest 12-month increase since the period ending April 1980. The food index increased 10.4% for the 12-months ending June, the largest 12-month increase since the period ending February 1981,” reported the Bureau of Labor Statistics.
Energy
In June, the index for energy rose 7.5%. The price of gas increased 11.2% for the month, after the 4.1% increase seen in May. The price of electricity also rose 1.7%, and the natural gas index soared 8.2%, “the largest monthly increase since October 2005”.
“The energy index rose 41.6% over the past 12 months. The gasoline index increased 59.9% over the span, the largest 12-month increase in that index since March 1980. The index for electricity rose 13.7%, the largest 12-month increase since the period ending April 2006. The index for natural gas increased 38.4% over the last 12 months, the largest such increase since the period ending October 2005,” explained the bureau in its report.
(Source: U.S. Bureau of Labor Statistics)
Food
In June, the index for food rose 1%. The food at home index likewise increased by 1% for the month, “the sixth consecutive increase of at least 1.0% in that index”. Over the month, five of the six major grocery store food group indexes saw percentage increases, stated the bureau.
“The food away from home index rose 0.9% in June after rising 0.7 percent in May. The index for full-service meals rose 0.8% over the month. The index for limited service meals increased 0.7% in June, as it did in May.
The food at home index rose 12.2% over the last 12 months, the largest 12-month increase since the period ending April 1979. All six major grocery store food group indexes increased over the span, with five of the six rising more than 10%. The index for other food at home increased the most, rising 14.4%, with the index for butter and margarine increasing 26.3%. The remaining groups saw increases ranging from 8.1 percent (fruits and vegetables) to 13.8%(cereals and bakery products).
The index for food away from home rose 7.7% over the last year, the largest 12-month change since the period ending November 1981. The index for full-service meals rose 8.9% over the last 12 months, and the index for limited service meals rose 7.4% over the last year,” said the US Bureau of Labor Statistics.
(Source: U.S. Bureau of Labor Statistics)
All Items Less Food and Energy
The all items less food and energy index grew by 0.7% for the month of June. The shelter index rose 0.6%, the owners’ equivalent rent index increased 0.7%, and the index of rent rose 0.8%, “the largest monthly increase since April 1986”.
“The index for all items less food and energy rose 5.9% over the past 12 months. The increase was broad-based, reflecting advances in almost all major component indexes. The shelter index rose 5.6% over the last year, the largest 12-month increase since the period ending February 1991. The index for household furnishings and operations increased 9.5% over the last 12 months. The index for new vehicles rose 11.4% and the index for used cars and trucks increased 7.1% over the year, while the index for airline fares rose 34.1%,” explained the bureau.
Source cited: https://www.bls.gov/news.release/archives/cpi_07132022.htm
by Sarah Bauder | Jun 10, 2022 | CPI
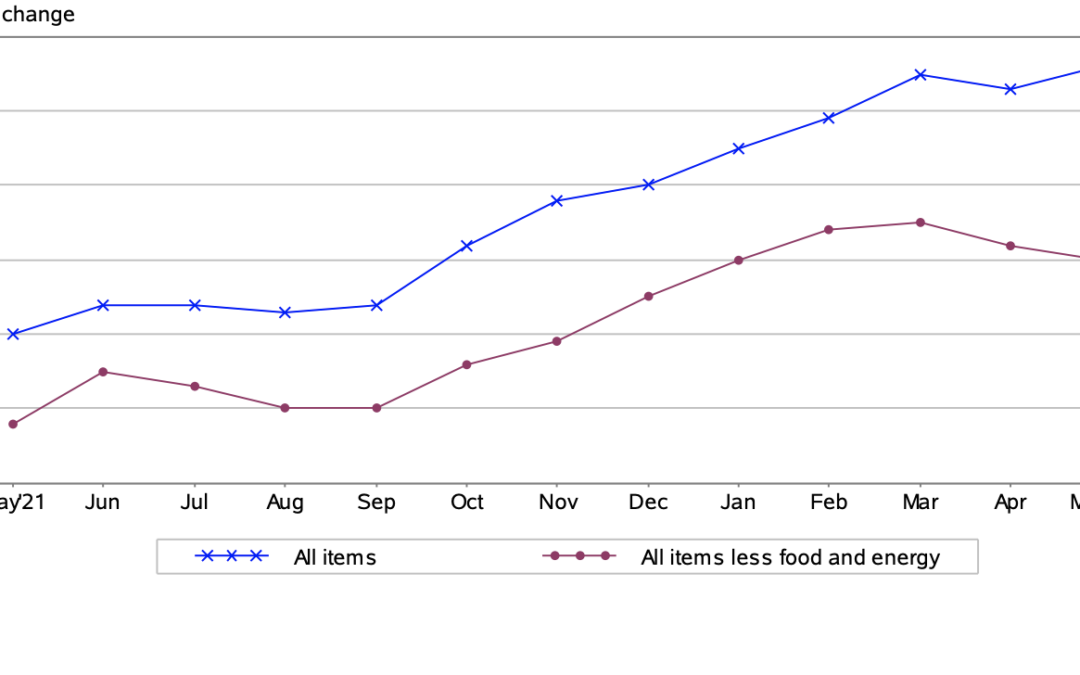
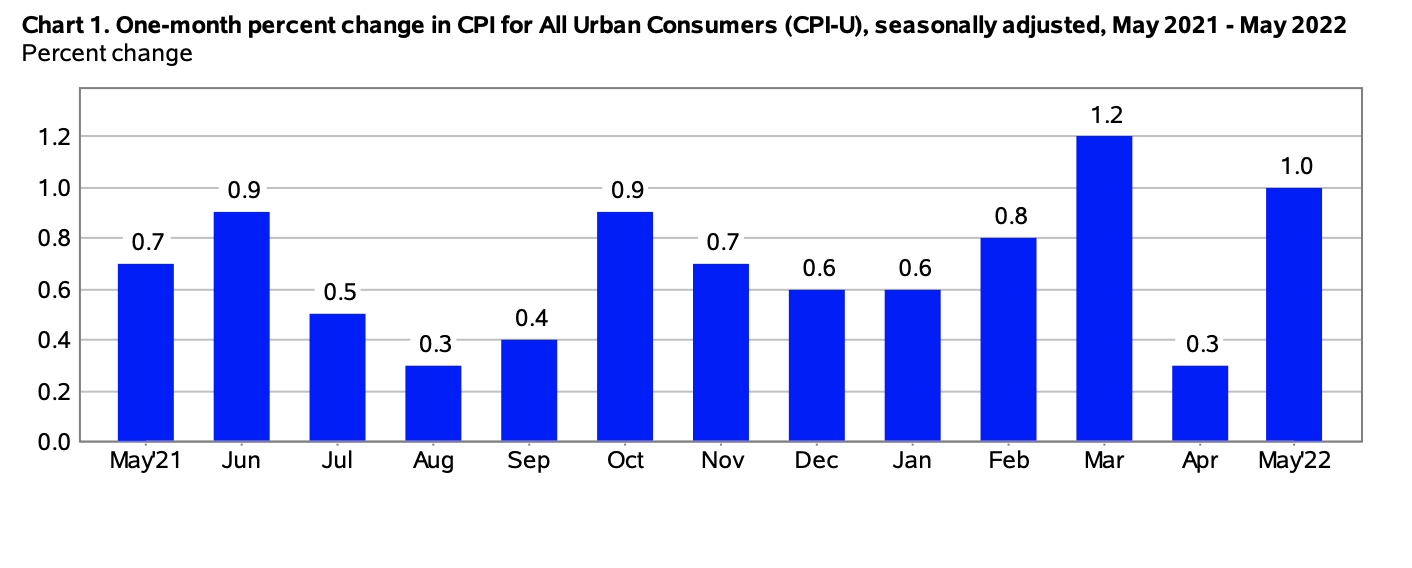
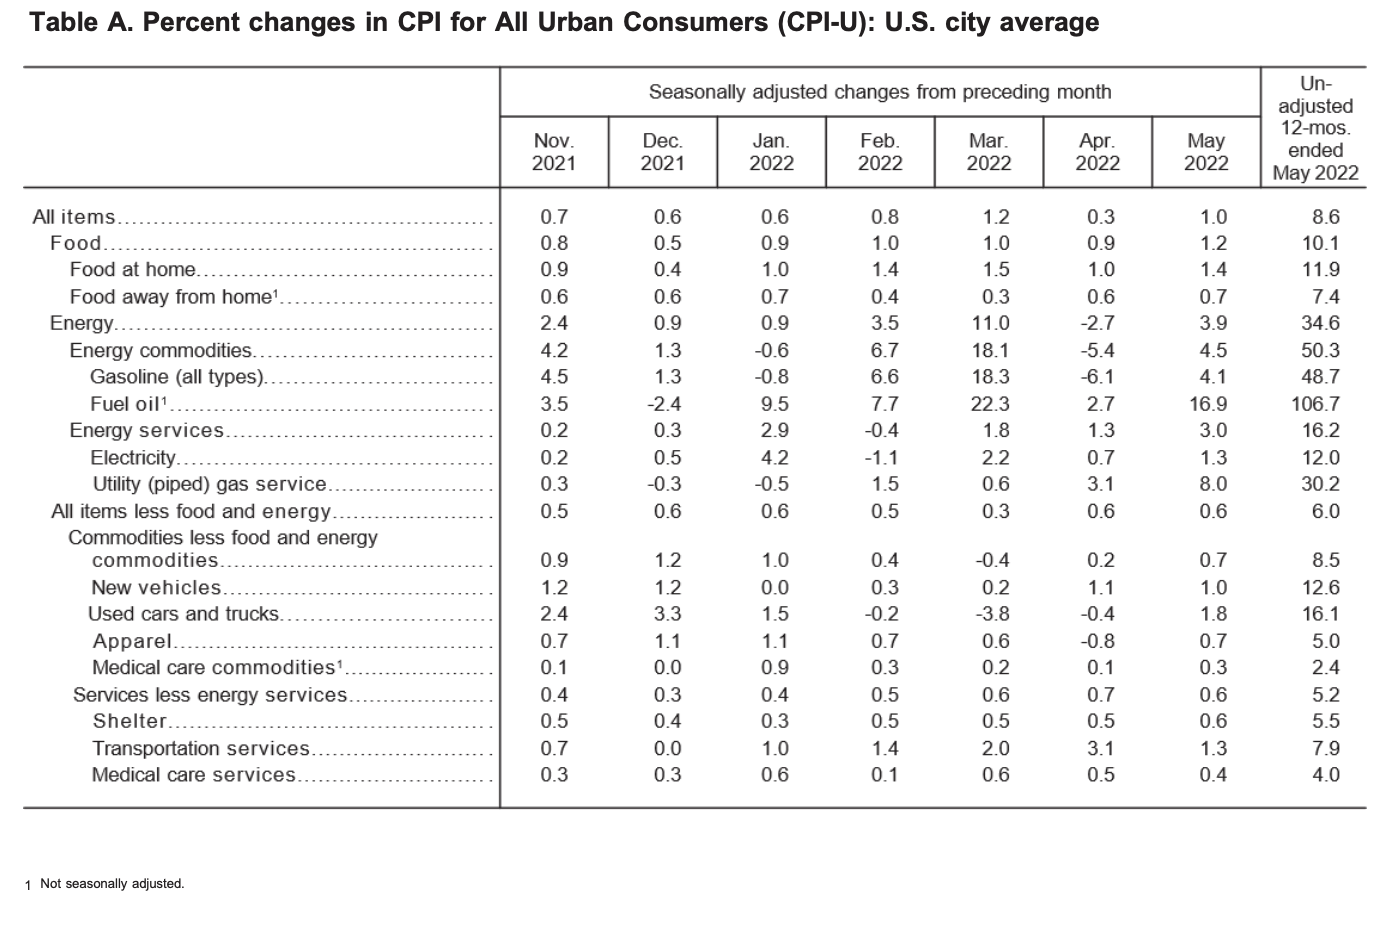
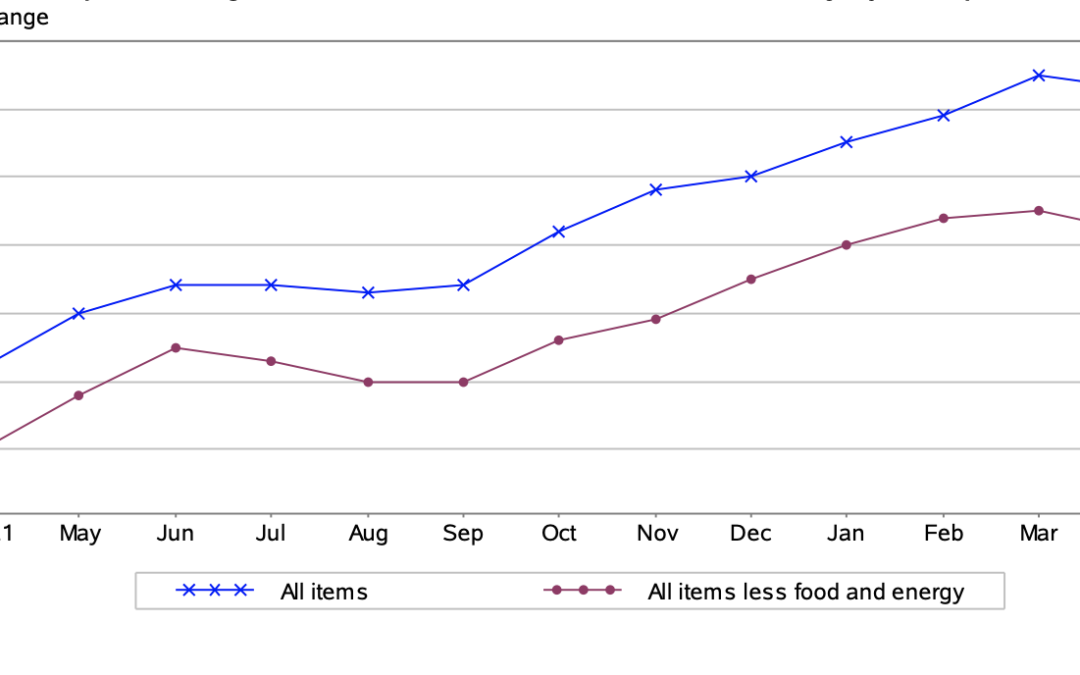
The Consumer Price Index for All Urban Consumers (CPI-U) grew 1% in May on a seasonally adjusted basis, reported the U.S. Bureau of Labor Statistics. Since this time last year, the all items index rose 8.6% prior to seasonal adjustment.
“The increase was broad-based, with the indexes for shelter, gasoline, and food being the largest contributors. After declining in April, the energy index rose 3.9% over the month with the gasoline index rising 4.1% and the other major component indexes also increasing. The food index rose 1.2% in May as the food at home index increased 1.4%.
The index for all items less food and energy rose 0.6% in May, the same increase as in April. While almost all major components increased over the month, the largest contributors were the indexes for shelter, airline fares, used cars and trucks, and new vehicles. The indexes for medical care, household furnishings and operations, recreation, and apparel also increased in May.
The all items index increased 8.6 percent for the 12 months ending May, the largest 12-month increase since the period ending December 1981. The all items less food and energy index rose 6% over the last 12 months. The energy index rose 34.6% over the last year, the largest 12-month increase since the period ending September 2005. The food index increased 10.1% for the 12-months ending May, the first increase of 10 percent or more since the period ending March 1981,” explained the Bureau of Labor Statistics in its report.
(Source: U.S. Bureau of Labor Statistics)
Energy
In May, the index for energy rose 3.9%. The price of gasoline increased 4.1% for the month after seeing a decrease the previous month. Composite energy indexes had percentage increases including the electricity index by 1.3%, and the natural gas index by 8%, “the largest monthly increase since October 2005”.
“The energy index rose 34.6 percent over the past 12 months. The gasoline index increased 48.7 percent over the span. The index for fuel oil more than doubled, rising 106.7 percent; this represents the largest increase in the history of the series, which dates to 1935. The index for electricity rose 12.0 percent, the largest 12-month increase since the period ending August 2006. The index for natural gas increased 30.2 percent over the last 12 months, the largest such increase since the period ending July 2008,” stated the bureau.
Food
In May, the food index rose 1.2%. The food at home index saw a 1.4% for the month – “the fifth consecutive increase of at least 1%,” remarked the bureau in its monthly report. All six grocery store food composite indexes all experienced percentage increases for the month of May. Additionally, the index for food away from home also edged up 0.7% for the month.
“The food at home index rose 11.9 percent over the last 12 months, the largest 12-month increase since the period ending April 1979. All six major grocery store food group indexes increased over the span, with five of the six rising more than 10 percent. The index for meats, poultry, fish, and eggs increased the most, rising 14.2 percent, with the index for eggs increasing 32.2 percent. The remaining groups saw increases ranging from 8.2 percent (fruits and vegetables) to 12.6 percent (other food at home).
The index for food away from home rose 7.4 percent over the last year, the largest 12-month change since the period ending November 1981. The index for full-service meals rose 9.0 percent over the last 12 months, and the index for limited-service meals rose 7.3 percent over the last year. The index for food at employee sites and schools fell 30.5 percent over the last 12 months, reflecting widespread free lunch programs,” said the bureau.
(Source: U.S. Bureau of Labor Statistics)
All Items Less Food and Energy
The all items less food and energy index increased 0.6% in May. The index for shelter rose 0.6%, the largest monthly percentage rise seen since March 2004. Both the index for rent and the owners’ equivalent rent index increased by 0.6%, respectively.
“The index for all items less food and energy rose 6% over the past 12 months. The increase was broad-based, reflecting advances in almost all major component indexes. The shelter index rose 5.5% over the last year, the largest 12-month increase since the period ending February 1991. The index for household furnishings and operations increased 8.9% over the last 12 months. The index for new vehicles rose 12.6% and the index for used cars and trucks increased 16.1% over the year, while the index for airline fares rose 37.8%,” stated the US Bureau of Labor Statistics.
Source cited: https://www.bls.gov/news.release/archives/cpi_06102022.htm
by Sarah Bauder | May 11, 2022 | CPI, Inflation
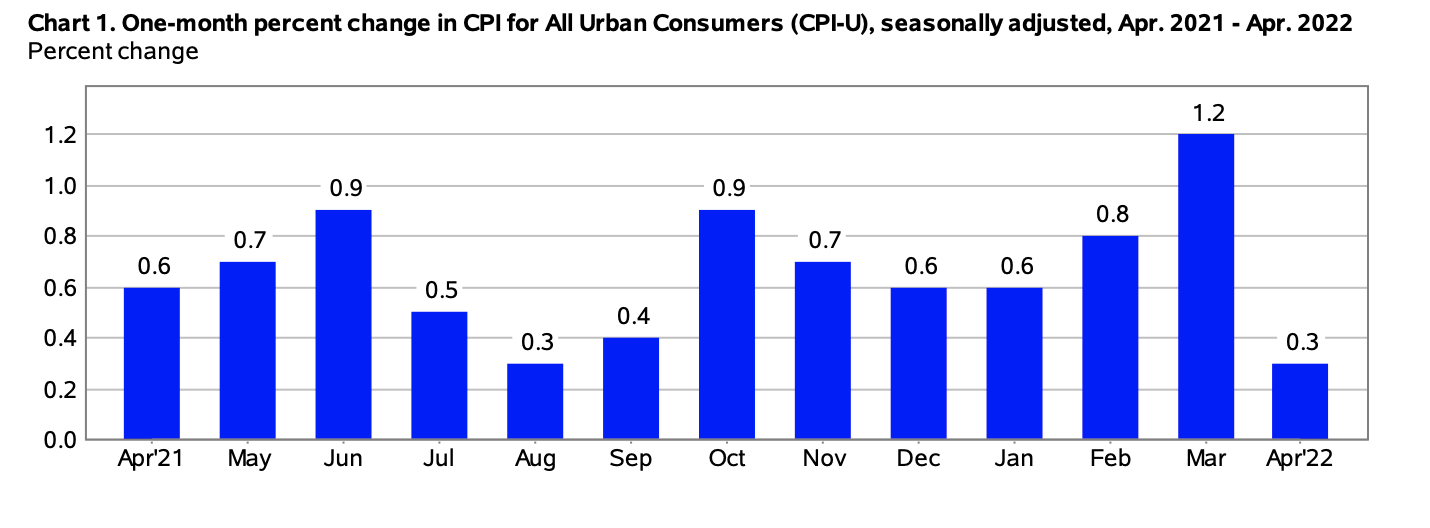
The Consumer Price Index for All Urban Consumers (CPI-U) rose by 0.3% on a seasonally adjusted basis in April, reported the U.S. Bureau of Labor Statistics. Since this time last year, the all items index grew by 8.3% prior to seasonal adjustment.
“Increases in the indexes for shelter, food, airline fares, and new vehicles were the largest contributors to the seasonally adjusted all items increase. The food index rose 0.9 percent over the month as the food at home index rose 1.0 percent. The energy index declined in April after rising in recent months. The index for gasoline fell 6.1 percent over the month, offsetting increases in the indexes for natural gas and electricity.
The index for all items less food and energy rose 0.6 percent in April following a 0.3-percent advance in March. Along with indexes for shelter, airline fares, and new vehicles, the indexes for medical care, recreation, and household furnishings and operations all increased in April. The indexes for apparel, communication, and used cars and trucks all declined over the month.
The all items index increased 8.3 percent for the 12 months ending April, a smaller increase than the 8.5-percent figure for the period ending in March. The all items less food and energy index rose 6.2 percent over the last 12 months. The energy index rose 30.3 percent over the last year, and the food index increased 9.4 percent, the largest 12-month increase since the period ending April 1981,” stated the Bureau of Labor Statistics in its monthly report.
(Source: U.S. Bureau of Labor Statistics)
Food
The index for food rose by 0.9% in April, marking the seventh consecutive monthly rise in this index. The food at home index saw a 1% for the month, with five of the six grocery store food composite indexes all experiencing percentage increases.
The food at home index rose 10.8% over the last 12 months, the largest 12-month increase since the period ending November 1980. The index for meats, poultry, fish, and eggs increased 14.3% over the last year, the largest 12-month increase since the period ending May 1979. The other major grocery store food group indexes also rose over the past year, with increases ranging from 7.8% (fruits and vegetables) to 11% (other food at home).
The index for food away from home rose 7.2% over the last year. The index for full-service meals rose 8.7% over the last 12 months, the largest 12-month increase since the inception of the index in 1997. The index for limited-service meals rose 7% over the last year, while the index for food at employee sites and schools fell 30%, reflecting widespread free lunch programs,” explained the bureau.
Energy
The index for energy decreased 2.7% in April, after soaring 11% the previous month. Gasoline prices dropped 6.1% after leaping 18.3% in March. Composite energy indexes all saw percentage rises including the natural gas index by 3.1% and the electricity index by 0.7%.
“The energy index rose 30.3% over the past 12 months. All the major energy component indexes increased over the year. The gasoline index increased 43.6% and the fuel oil index rose 80.5%. The index for electricity rose 11%, and the index for natural gas increased 22.7% over the last 12 months,” explained the Bureau of Labor Statistics.

(Source: U.S. Bureau of Labor Statistics)
All Items Less Food and Energy
The all items less food and energy index grew 0.6% in April. The index for shelter rose 0.5%. The index for rent increased 0.6% and the owners’ equivalent rent index increased by 0.5%.
“The index for all items less food and energy rose 6.2 percent over the past 12 months. Virtually all major components have increased over the span. The shelter index rose 5.1 percent over the last year, and the medical care index increased 3.2 percent. Several transportation indexes show notable increases including used cars and trucks (+22.7 percent) and new vehicles (+13.2 percent). The index for airline fares rose 33.3 percent over the last year, the largest 12-month increase since the period ending December 1980,” stated the bureau in its report.
Source cited: https://www.bls.gov/news.release/archives/cpi_05112022.htm
by Sarah Bauder | Apr 12, 2022 | CPI
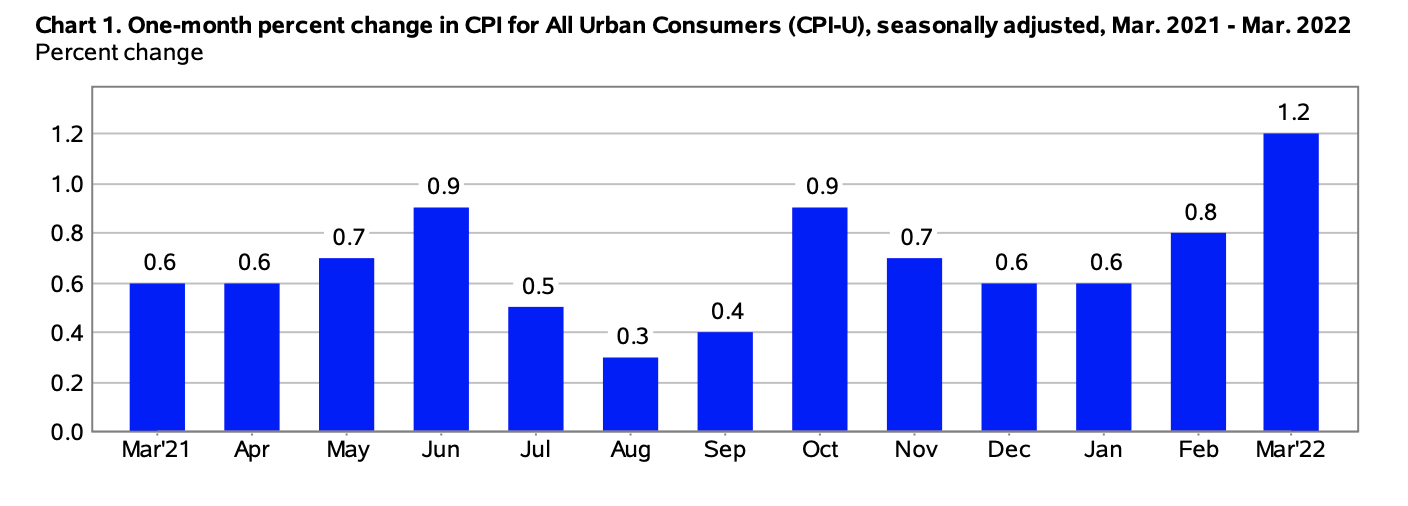
The Consumer Price Index for All Urban Consumers (CPI-U) grew by 1.2% on a seasonally adjusted basis in March, reported the U.S. Bureau of Labor Statistics. Over the last 12-month period, before seasonal adjustment, the all items index rose by 8.5%.
“Increases in the indexes for gasoline, shelter, and food were the largest contributors to the seasonally adjusted all items increase. The gasoline index rose 18.3% in March and accounted for over half of the all items monthly increase; other energy component indexes also increased. The food index rose 1% and the food at home index rose 1.5%.
The index for all items less food and energy rose 0.3% in March following a 0.5% increase the prior month. The shelter index was by far the biggest factor in the increase, with a broad set of other indexes also contributing, including those for airline fares, household furnishings and operations, medical care, and motor vehicle insurance. In contrast, the index for used cars and trucks fell 3.8% over the month.
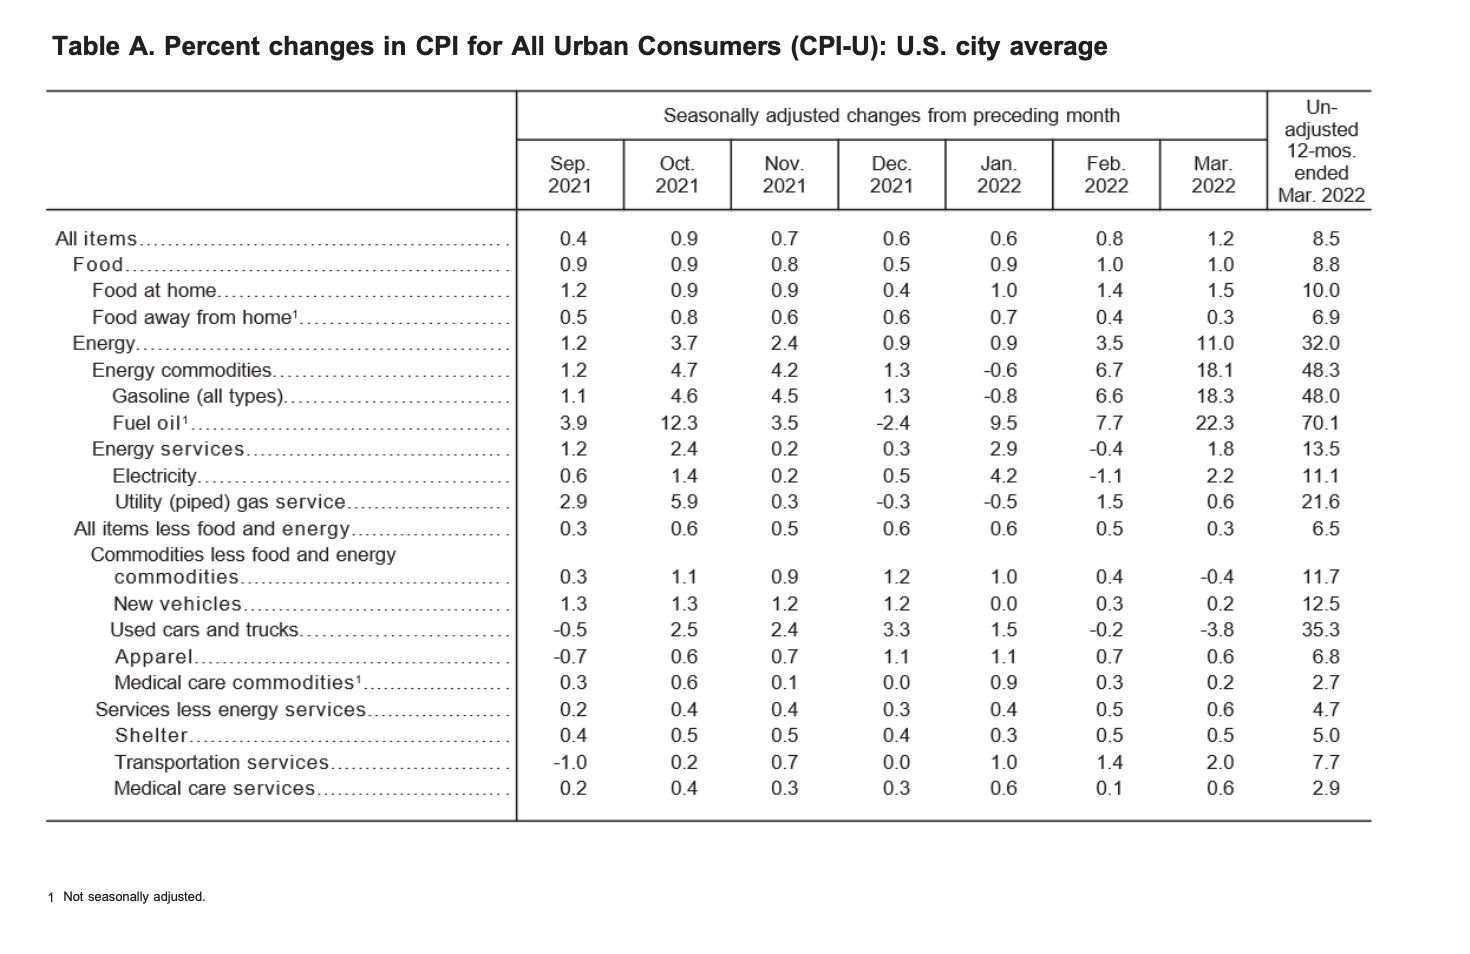
The all items index continued to accelerate, rising 8.5% for the 12 months ending March, the largest 12-month increase since the period ending December 1981. The all items less food and energy index rose 6.5%, the largest 12-month change since the period ending August 1982. The energy index rose 32% over the last year, and the food index increased 8.8 percent, the largest 12-month increase since the period ending May 1981,” explained the bureau in its monthly report.
(Source: U.S. Bureau of Labor Statistics)
Energy
In March, the index for energy leaped by 11%. The price of gas soared 18.3% after the 6.6% increase seen in February. The price of electricity rose 2.2%, and the natural gas index increased 0.6%.
Since this time last year, the index for energy soared by 32%. The price of gasoline surged 48%, with percentage increases for the index for natural gas rising 21.6%, and the electricity index increasing 11.1%.
Food
In March, the index for food rose 1%. The food at home index increased 1.5% for the month. Over the month, all six major grocery store food group indexes saw percentage increases, explained the bureau.
“The food at home index rose 10% over the last 12 months, the largest 12-month increase since the period ending March 1981. The index for meats, poultry, fish, and eggs increased 13.7% over the last year as the index for beef rose 16%. The other major grocery store food group indexes also rose over the past year, with increases ranging from 7% (dairy and related products) to 10.3% (other food at home).
The index for food away from home rose 6.9% over the last year, the largest 12-month increase since December 1981. The index for full-service meals rose 8% over the last 12 months, and the index for limited-service meals rose 7.2%. The index for food at employee sites and schools, in contrast, declined 30.5% over the past 12 months, reflecting widespread free lunch programs,” stated the Bureau of Labor Statistics.
(Source: U.S. Bureau of Labor Statistics)
All Items Less Food and Energy
The all items less food and energy index inched up 0.3% for March. The composite index largely responsible for the monthly increase was the shelter index, which saw a 0.5% rise. Both the indexes for rent and owners’ equivalent rent increased by 0.4%, respectively.
“The index for all items less food and energy rose 6.5% over the past 12 months, with virtually all of its major component indexes rising over the span. The shelter index rose 5% over the last 12 months, its largest 12-month increase since May 1991. The index for household furnishings and operations increased 10.1% over the past year, its largest 12-month increase since the period ending July 1975,” explained the bureau in its report.
Source cited: https://www.bls.gov/news.release/archives/cpi_04122022.htm
by Sarah Bauder | Mar 10, 2022 | CPI
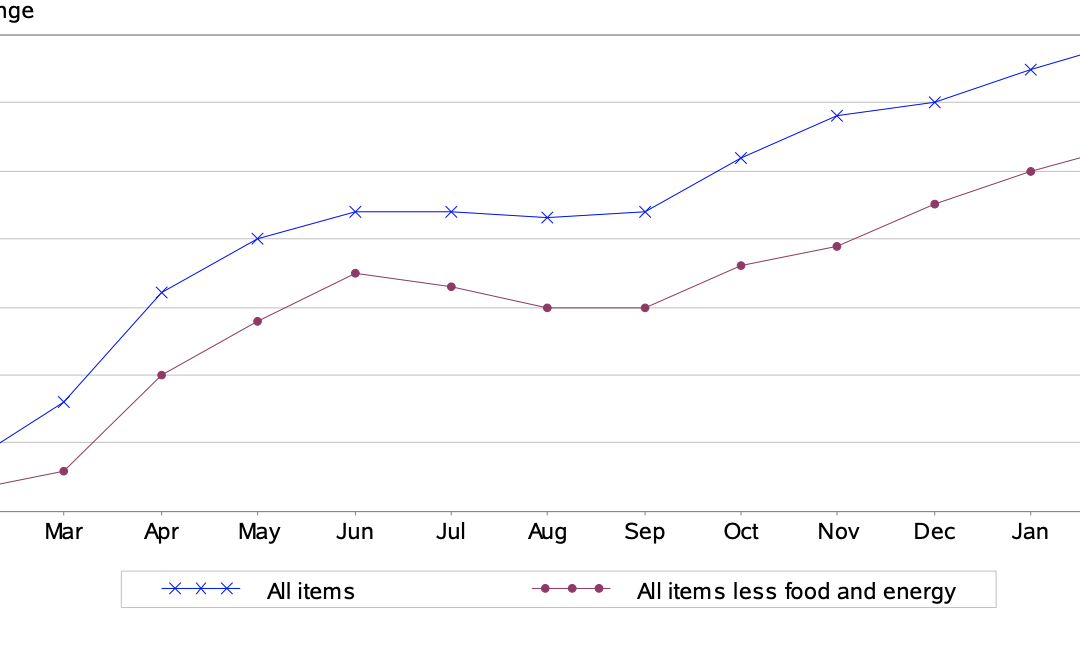
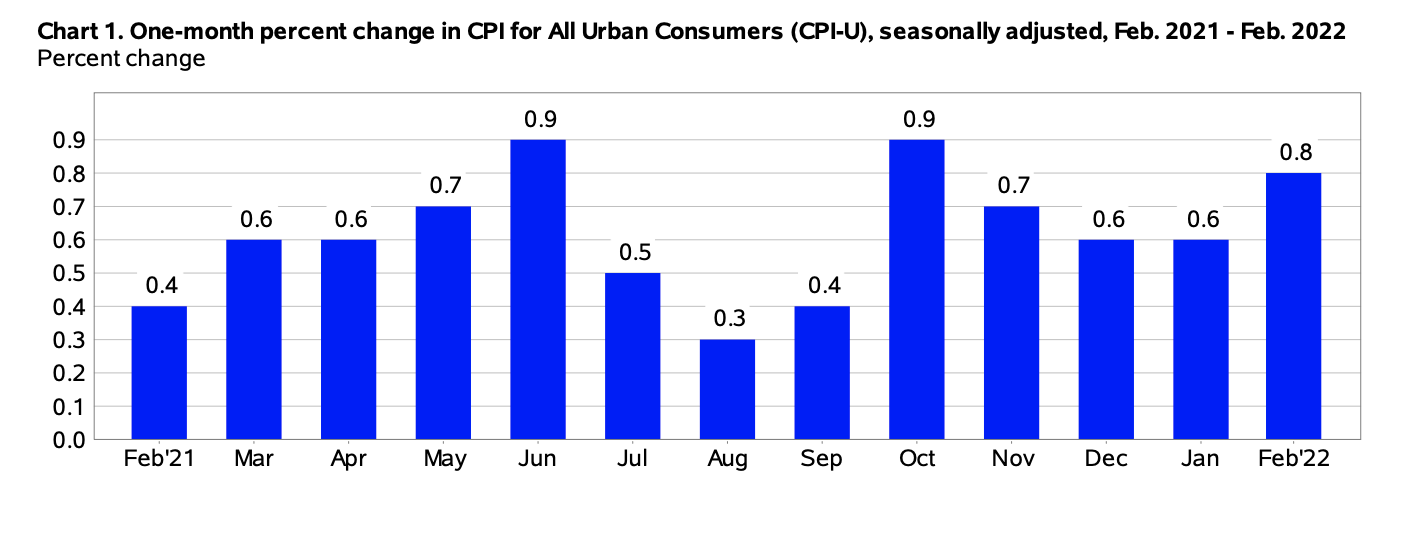
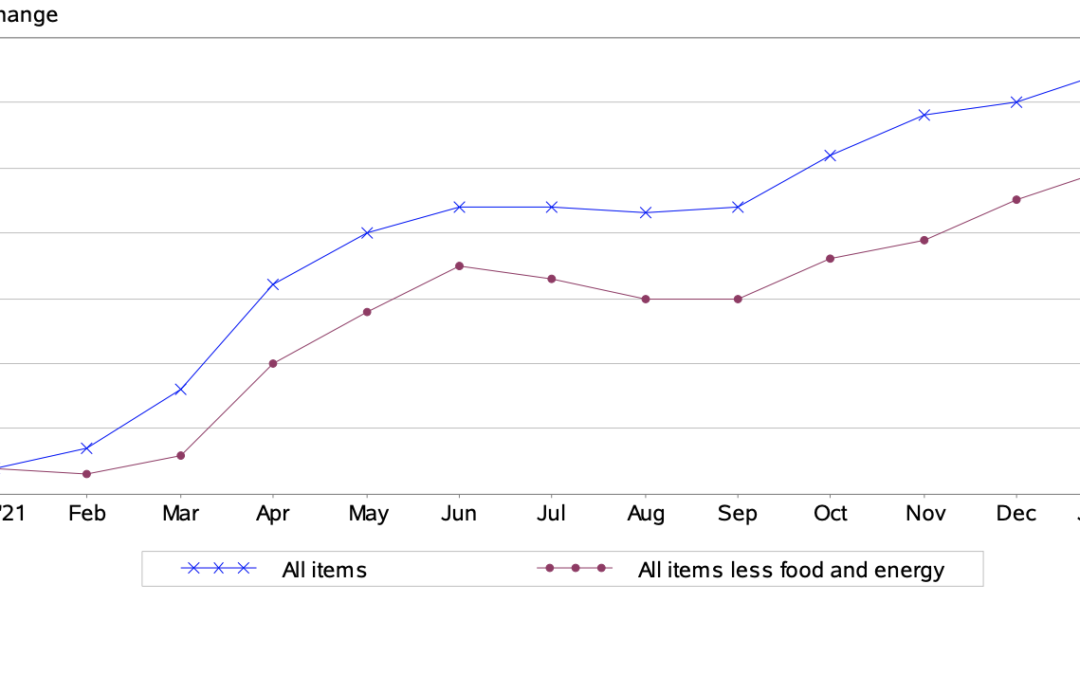
The Consumer Price Index for All Urban Consumers (CPI-U) grew by 0.8% on a seasonally adjusted basis in February, stated the U.S. Bureau of Labor Statistics in its monthly report. This is up from the 0.6% increase in January. Before seasonal adjustment, the all items index, the all items index increased 7.9% since this time last year.
“Increases in the indexes for gasoline, shelter, and food were the largest contributors to the seasonally adjusted all items increase. The gasoline index rose 6.6% in February and accounted for almost a third of the all items monthly increase; other energy component indexes were mixed. The food index rose 1% as the food at home index rose 1.4%; both were the largest monthly increases since April 2020.
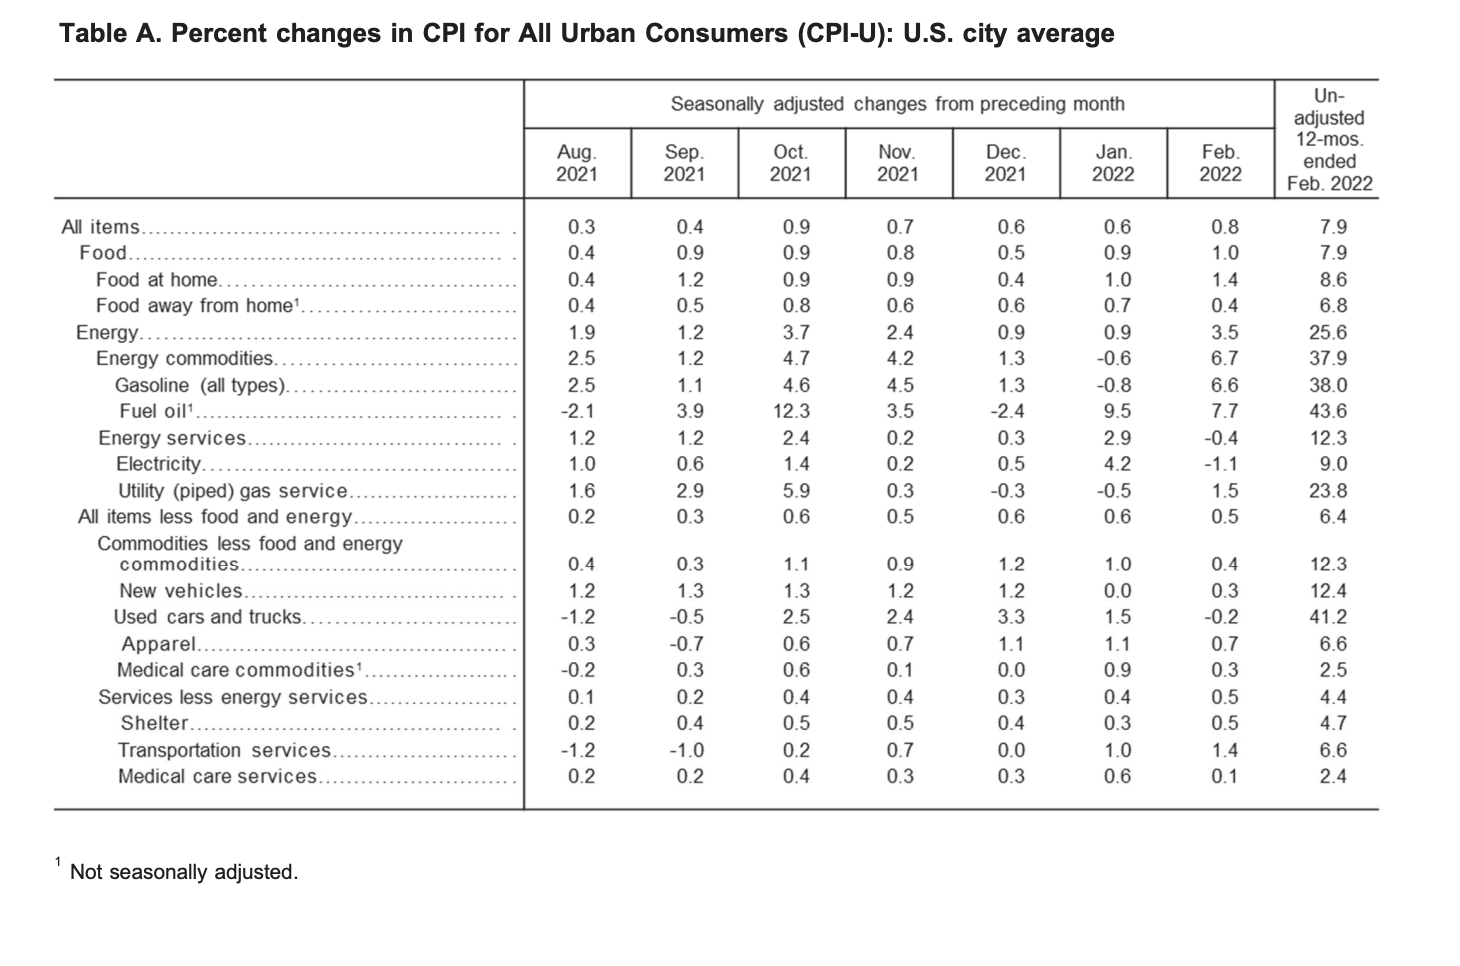
The all items index rose 7.9% for the 12 months ending February. The 12-month increase has been steadily rising and is now the largest since the period ending January 1982. The all items less food and energy index rose 6.4%, the largest 12-month change since the period ending August 1982. The energy index rose 25.6% over the last year, and the food index increased 7.9%, the largest 12-month increase since the period ending July 1981,” explained the bureau in its report.
(Source: U.S. Bureau of Labor Statistics)
Energy
In February, the index for energy saw a sharp increase by 3.5%, after the 0.9% rise the previous month. The price of gasoline soared 6.6% after dropping 0.8% in January. The natural gas index rose 1.5%, while the index for electricity decreased 1.1%.
Over the last 12-month period, the index for energy increased by an astounding 25.6%. The price of gasoline skyrocketed 38%, the natural gas index soared 23.8%, and the electricity index increased 9%.
Food
In February, the index for food rose by 1%, with the food at home index rising 1.4% over the month. All six of the component food group indexes saw percentage increases with the fruits and vegetable index up 2.3%, “, its largest monthly increase since March 2010”. Other monthly increases included the fresh fruits index by 3.7%, the fresh vegetables index by 1.3%, the dairy products index by 1.9%, which marked its largest monthly rise since April 2011.
“The food at home index rose 8.6% over the last 12 months, the largest 12-month increase since the period ending April 1981. The index for meats, poultry, fish, and eggs increased 13% over the last year as the index for beef rose 16.2%. The other major grocery store food group indexes also rose over the past year, with increases ranging from 5.2% (dairy and related products) to 8.2% (other food at home).
The index for food away from home rose 6.8% over the last year, the largest 12-month increase since December 1981. The index for limited-service meals rose 8% over the last 12 months, and the index for full-service meals rose 7.5%. The index for food at employee sites and schools, in contrast, declined 40.7% over the past 12 months, reflecting widespread free lunch programs,” explained the Bureau of Labor Statistics.
(Source: U.S. Bureau of Labor Statistics)
All Items Less Food and Energy
The all items less food and energy index inched up 0.5% for the month. Since this time last year, the index increased 6.4%.
“The index for all items less food and energy rose 6.4% over the past 12 months, with virtually all of its major component indexes rising over the span. The shelter index rose 4.7% over the last 12 months, its largest 12-month increase since May 1991. Several transportation indexes showed large increases over the past year, including used cars and trucks (+41.2%), new vehicles (+12.4%), and airline fares (+12.7%),” noted the Bureau of Labor Statistics in its report.
Source cited: https://www.bls.gov/news.release/archives/cpi_03102022.htm
by Sarah Bauder | Feb 10, 2022 | CPI
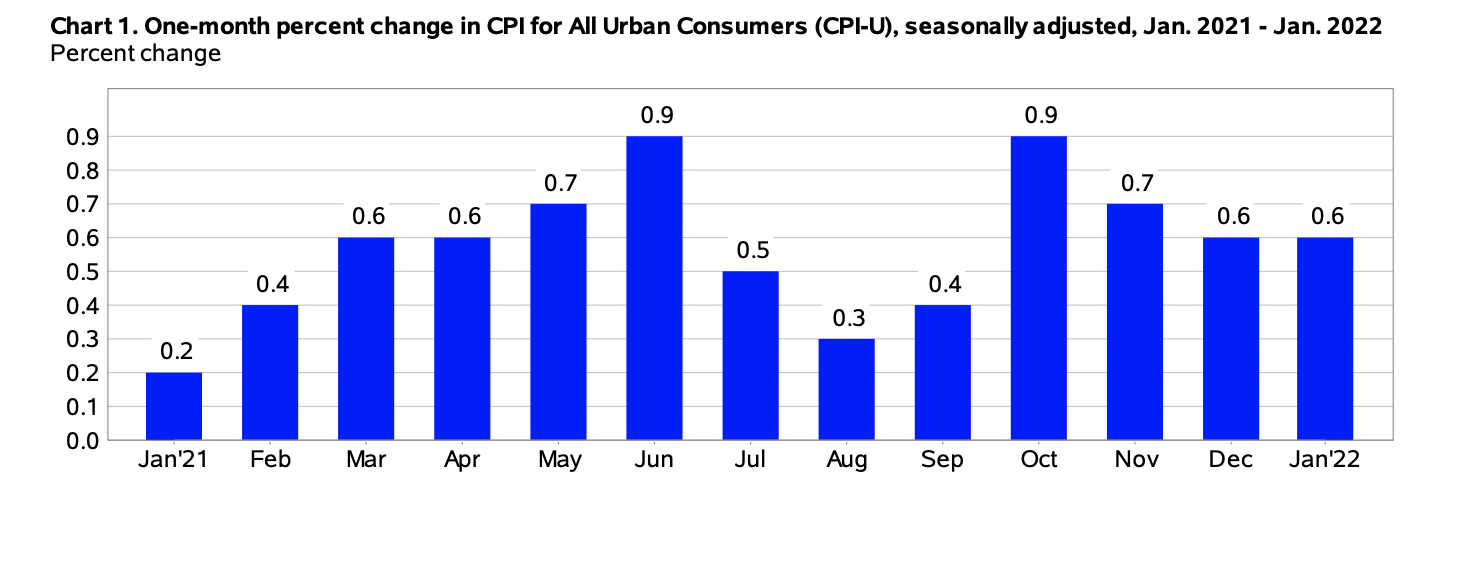
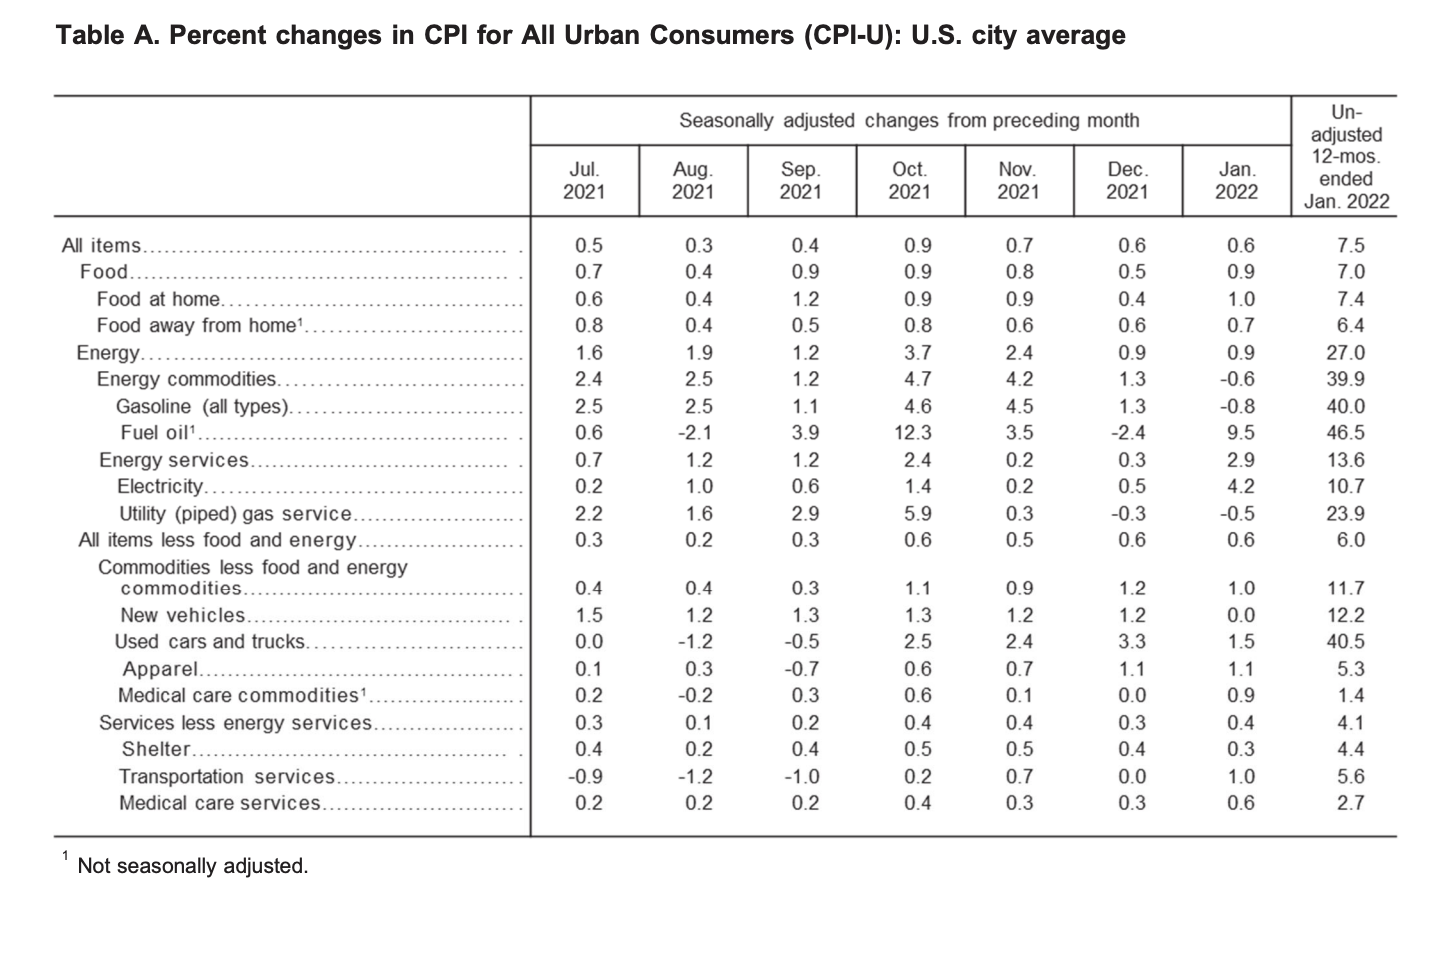
The Consumer Price Index for All Urban Consumers (CPI-U) grew by 0.6% on a seasonally adjusted basis in January, reported the U.S. Bureau of Labor Statistics – the same percentage increase seen in December. Since this time last year, before seasonal adjustment the all items index rose by 7.5%.
“Increases in the indexes for food, electricity, and shelter were the largest contributors to the seasonally adjusted all items increase. The food index rose 0.9% in January following a 0.5% increase in December. The energy index also increased 0.9% over the month, with an increase in the electricity index being partially offset by declines in the gasoline index and the natural gas index.
The index for all items less food and energy rose 0.6% in January, the same increase as in December. This was the seventh time in the last 10 months it has increased at least 0.5%. Along with the index for shelter, the indexes for household furnishings and operations, used cars and trucks, medical care, and apparel were among many indexes that increased over the month.
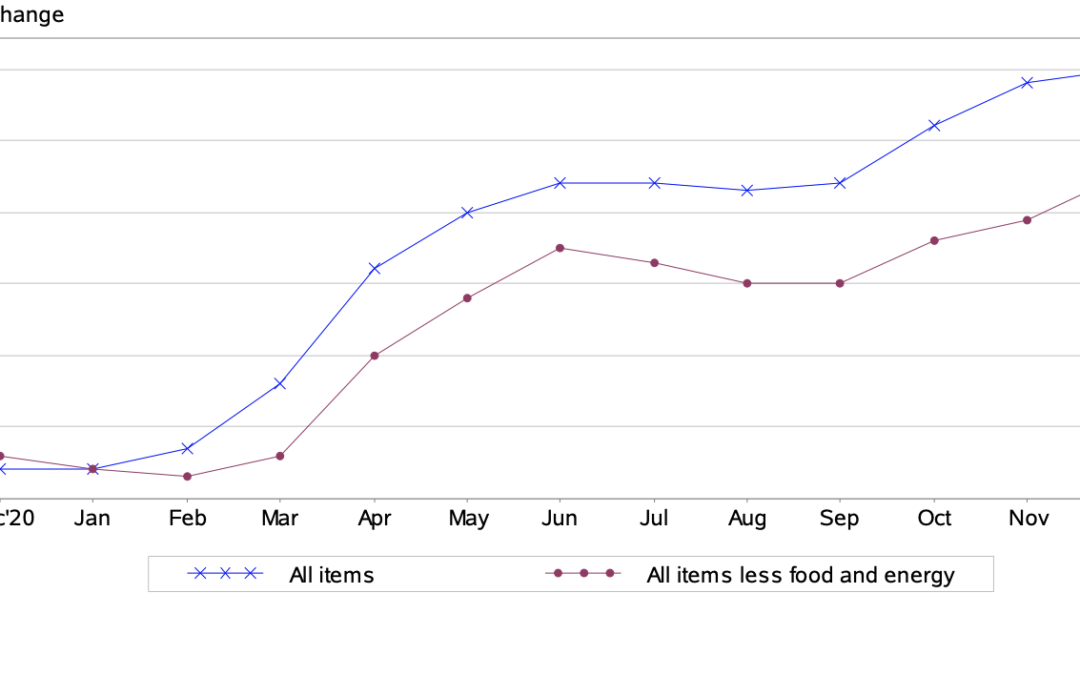
The all items index rose 7.5% for the 12 months ending January, the largest 12-month increase since the period ending February 1982. The all items less food and energy index rose 6%, the largest 12-month change since the period ending August 1982. The energy index rose 27% over the last year, and the food index increased 7%,” explained the bureau in the report.
(Source: U.S. Bureau of Labor Statistics)
Food
In January, the index for food rose 0.9%. The food at home index increased 1% over the month, after rising 0.4% in December, explained the bureau. Over the month, five of the six major grocery store food group indexes saw percentage increases. Likewise, the index for food away from home increased 0.7% in January.
“The food at home index rose 7.4% over the last 12 months. All of the six major grocery store food group indexes increased over the period. By far the largest increase was that of the index for meats, poultry, fish, and eggs, which rose 12.2% over the year. The index for dairy and related products increased 3.1%, the smallest 12-month increase among the groups.
The index for food away from home rose 6.4% over the last year, the largest 12-month increase since January 1982. The index for limited-service meals rose 8% over the last 12 months, and the index for full-service meals rose 7.1%. The index for food at employee sites and schools, in contrast, declined 46.9% over the past 12 months, reflecting widespread free lunch programs,” explained the U.S. Bureau of Labor Statistics in its report.
Energy
In January, the index for energy edged up 0.9%, reported the bureau. The price of electricity rose 4.2%. Conversely, gas prices dropped 0.8% as did the natural gas index by 0.5%.
Over the last 12-month period, the index for energy increased 27%. The price of gasoline surged 40%, with percentage increases for the index for natural gas rising 23.9%, and the electricity index increasing 10.7%.
(Source: U.S. Bureau of Labor Statistics)
All Items Less Food and Energy
The all items less food and energy index inched up 0.6% for January. The bureau reported that almost all major component indexes saw percentage increases in January including the shelter index by 0.3%, with the index for rent rising 0.5%, and owners’ equivalent rent by 0.4%.
“The index for all items less food and energy rose 6.0% over the past 12 months. Major contributors to this increase include shelter (+4.4%) and used cars and trucks (+40.5%). However, the increase is broad-based, with virtually all component indexes showing increases over the past 12 months,” stated the U.S. Bureau of Labor Statistics in its monthly report.
Source cited: https://www.bls.gov/news.release/archives/cpi_02102022.htm
by Sarah Bauder | Jan 12, 2022 | CPI
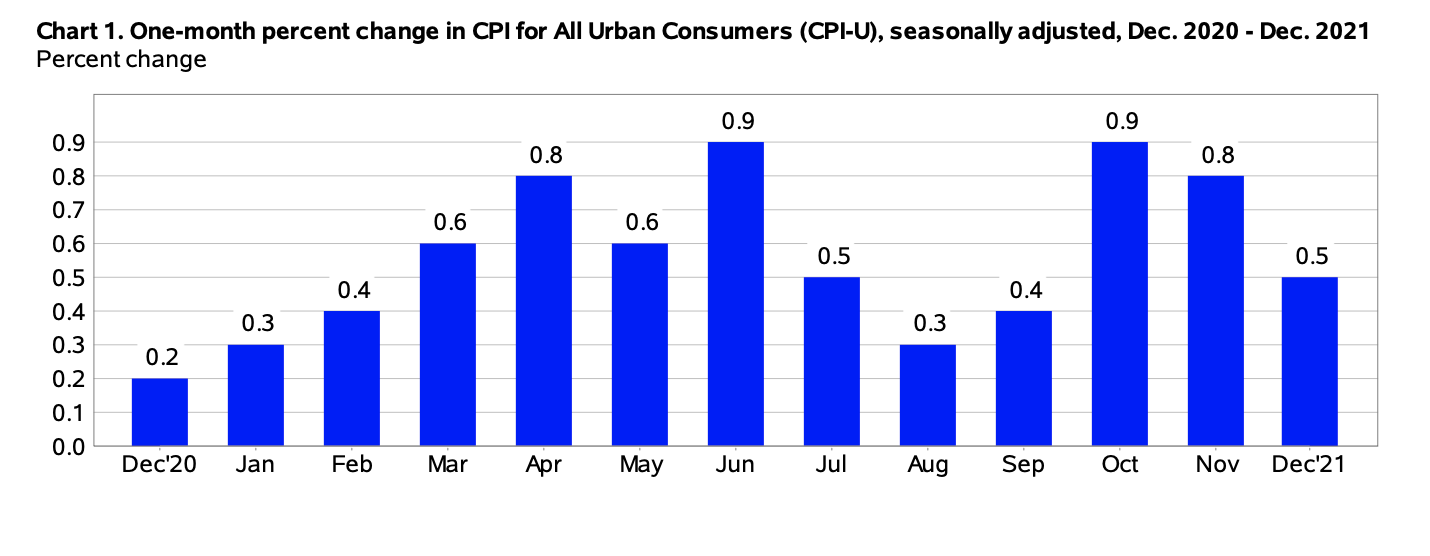
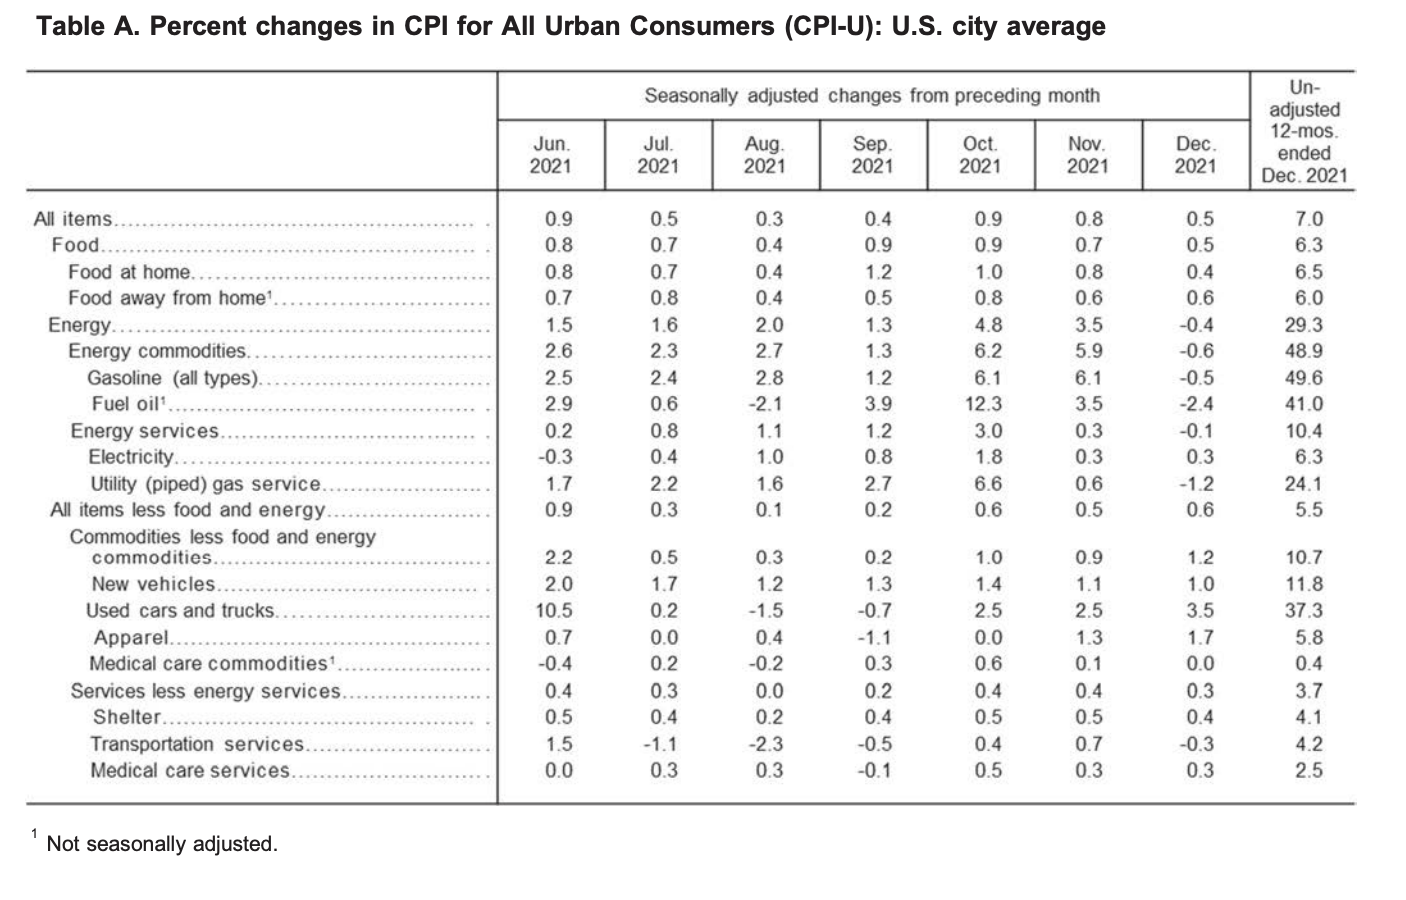
The Consumer Price Index for All Urban Consumers (CPI-U) rose 0.5% on a seasonally adjusted basis, reported the US Bureau of Labor Statistics. In November, it had risen by 0.8%. Over the last 12-month period, the index for all items increased 7% prior to seasonal adjustment.
“Increases in the indexes for shelter and for used cars and trucks were the largest contributors to the seasonally adjusted all items increase. The food index also contributed, although it increased less than in recent months, rising 0.5 percent in December. The energy index declined in December, ending a long series of increases; it fell 0.4 percent as the indexes for gasoline and natural gas both decreased.
The index for all items less food and energy rose 0.6 percent in December following a 0.5-percent increase in November. This was the sixth time in the last 9 months it has increased at least 0.5 percent. Along with the indexes for shelter and for used cars and trucks, the indexes for household furnishings and operations, apparel, new vehicles, and medical care all increased in December. As in November, the indexes for motor vehicle insurance and recreation were among the few to decline over the month,” reported the agency.
(Source: U.S. Bureau of Labor Statistics)
Food
In December, the index for food rose 0.5%. The food at home index rose 0.4%, with five of the six grocery store food group indexes seeing percentage increases for the month.
“The index for fruits and vegetables increased the most, rising 0.9 percent over the month as the index for fresh fruits increased 1.8 percent. The index for nonalcoholic beverages rose 0.8 percent in December, and the index for dairy and related products increased 0.7 percent. The index for other food at home rose 0.6 percent, and the index for cereals and bakery products increased 0.4 percent over the month. The index for meats, poultry, fish, and eggs declined in December, falling 0.4 percent after rising at least 0.7 percent in each of the last 7 months. The indexes for beef (-2.0 percent) and pork (-0.8 percent) declined after recent sharp increases,” explained the bureau in its report.
Over the last 12-month period, the index for food at home rose 6.5% – “this compares to a 1.5% annual increase over the last 10 years,” stated the bureau. All six of the component grocery store food group indexes saw percentage increases, with the index for meats, poultry, fish, and eggs rising 12.5%.
Likewise, over the last year, the food away from home index increased 6%, marking the largest percentage rise since January 1982.
Energy
The index for energy dropped 0.4% for the month. In December, gas prices declined 0.5%, after increasing consecutively by 6.1% in both October and November. The natural gas index also decreased 1.2% for the month. Conversely, the index for electricity edged up 0.3%.
Overall, over the last 12-month period, the energy index soared 29.3%. Gas prices skyrocketed 49.6%, the electricity index increased 6.3%, and the natural gas index surged 24.1%.
(Source: U.S. Bureau of Labor Statistics)
All Items Less Food and Energy
In December, the index for all items less food and energy increased by 0.6%. Several of the component indexes saw increases over the month including the shelter index by 0.4%, likewise, the indexes for rent and owners’ equivalent rent both increased 0.4%.
“The index for all items less food and energy rose 5.5% over the past 12 months, its largest 12- month increase since the period ending February 1991. Major contributors to this increase include shelter (+4.1%) and used cars and trucks (+37.3%). However, the increase is broad-based, with virtually all component indexes showing increases over the past 12 months,” explained the US Bureau of Labor Statistics.
The US Bureau of Labor Statistics released a statement regarding the impact of the COVID-19 pandemic on CPI data:
“Data collection by personal visit for the Consumer Price Index (CPI) program has been suspended almost entirely since March 16, 2020. When possible, data normally collected by personal visit were collected either online or by phone. Additionally, data collection in December was affected by the temporary closing or limited operations of certain types of establishments. These factors resulted in an increase in the number of prices considered temporarily unavailable and imputed. While the CPI program attempted to collect as much data as possible, many indexes are based on smaller amounts of collected prices than usual, and a small number of indexes that are normally published were not published this month. For each month from March 2020 to December 2021, BLS has published a summary of the impact of the pandemic on the Consumer Price Index news release and data. The impact summary for December is available at www.bls.gov/covid19/consumer-price-index-covid19-impacts-december2021.htm. Beginning with publication of January 2022 data in February 2022, this month-specific impact summary will be discontinued. However, information related to the impact of the pandemic will continue to be available at www.bls.gov/covid19/effects-of-covid-19-pandemic-on-consumerprice-index.htm.”
Source cited: https://www.bls.gov/news.release/archives/cpi_01122022.htm