by Sarah Bauder | Sep 13, 2022 | BLS, CPI
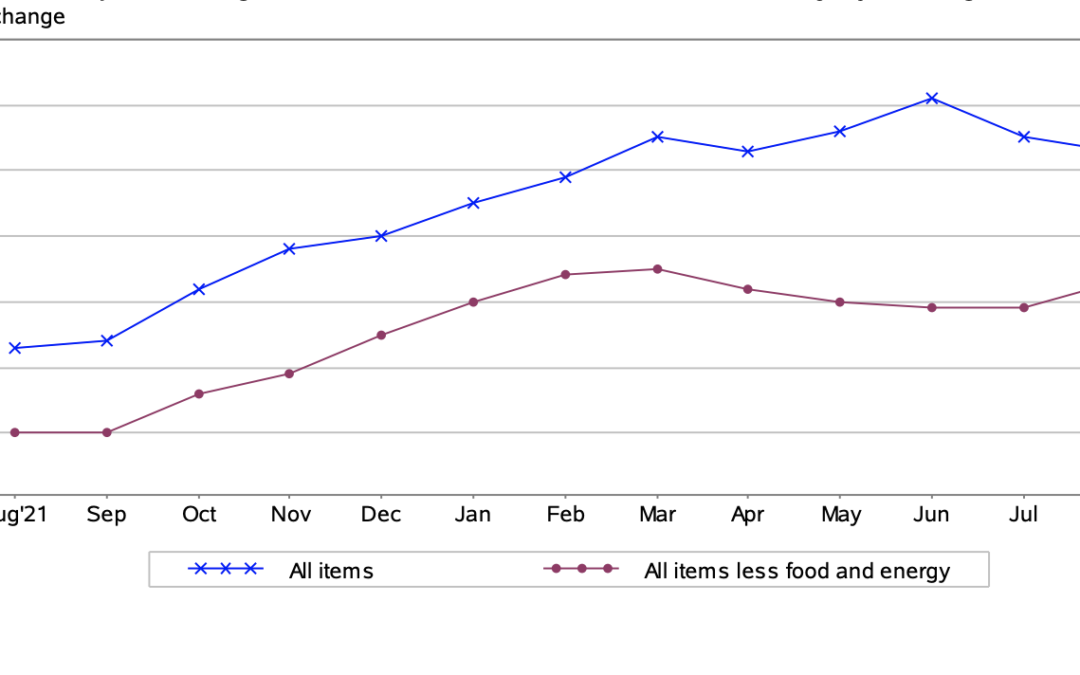
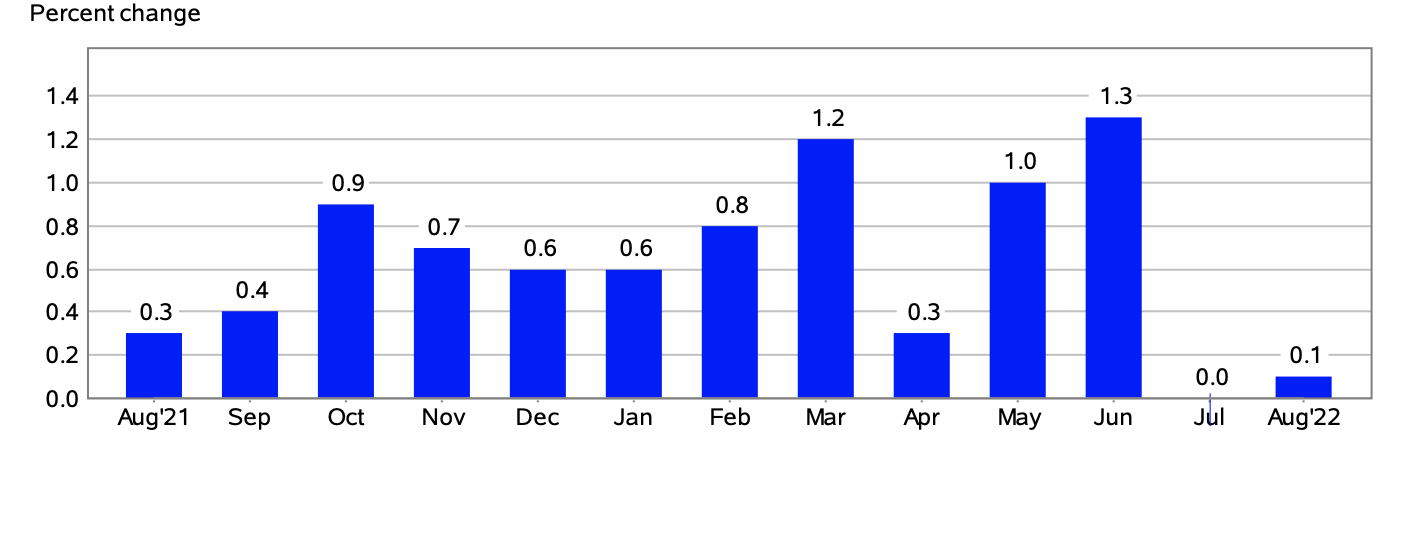
The Consumer Price Index for All Urban Consumers (CPI-U) edged up by 0.1% on a seasonally adjusted basis in August, reported the U.S. Bureau of Labor Statistics. Year-over-year, prior to seasonal adjustment the all items index rose 8.3%.
The principal reason for the percentage increase seen in August was a rise in the food, shelter, and medical care indexes. Conversely, there was a 10.6% decrease in the price of gasoline for the month which counteracted percentage increases seen with other indexes.
“The indexes for shelter, medical care, household furnishings and operations, new vehicles, motor vehicle insurance, and education were among those that increased over the month,” explained the Bureau of Labor Statistics in its monthly report.
For American consumers, this means that they paid more for foodstuffs at the grocery store, shelter costs, and medical care costs among other areas of everyday life. The continued acceleration in inflation means many Americans are still grappling with meeting basic daily needs.
Given the fact that inflation is still at historically high levels, last week the Fed indicated that there would likely be a significant increase in interest rates later this month.
(Source: U.S. Bureau of Labor Statistics)
Food
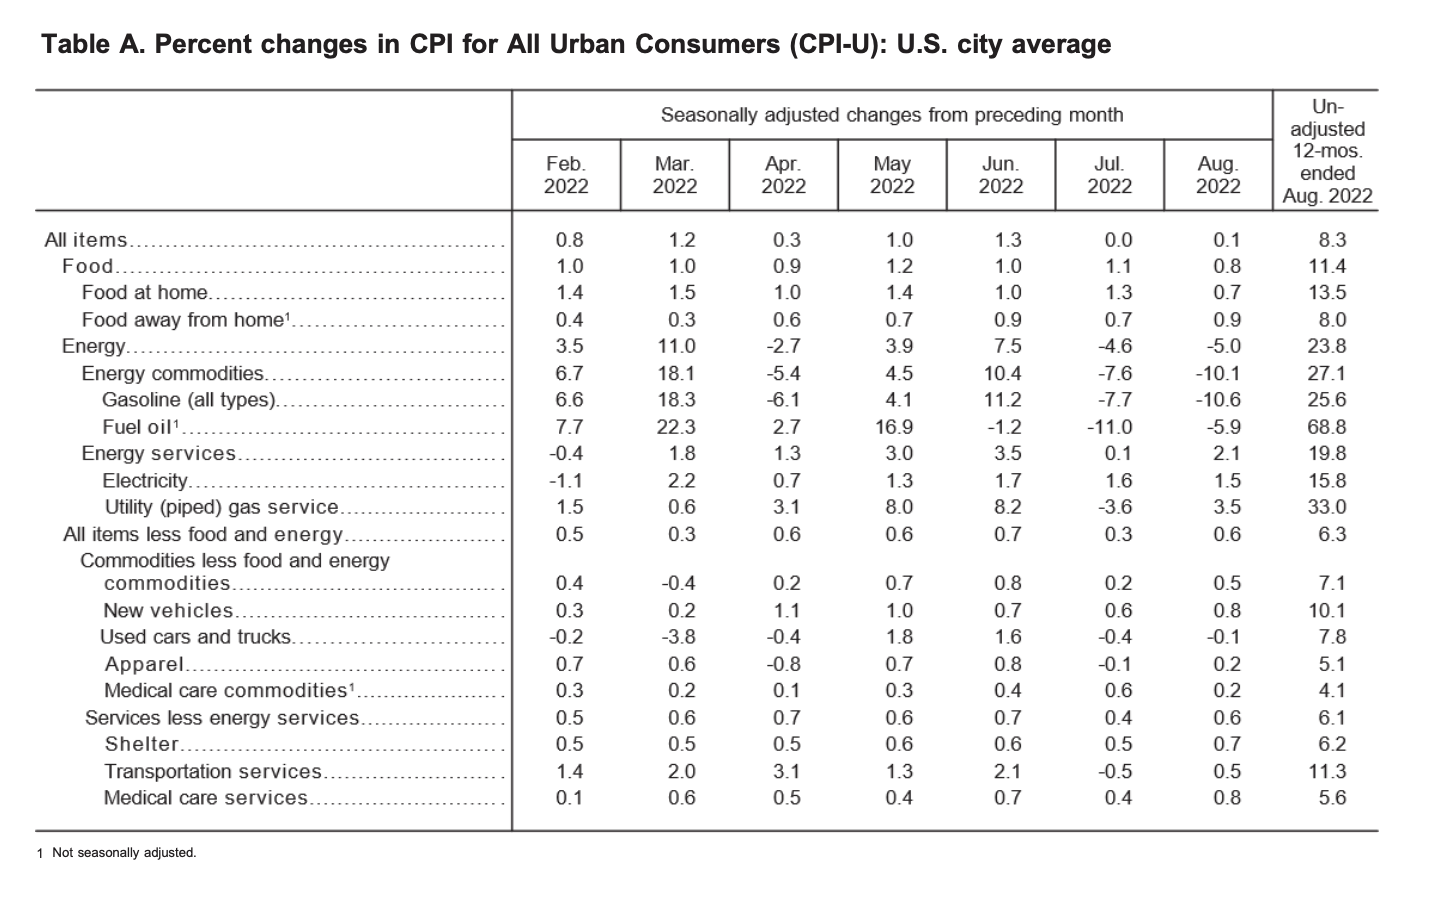
In August, the index for food rose 0.8%. Since this time last year, American consumers have paid 13.5% more for foodstuffs at grocery stores. It should be noted that this was the highest year-over-year percentage increase seen since May 1979.
Grocery items that were the main contributors to the overall rise in the index included fruits and vegetables, eggs, meat, poultry, fish, cereal products, bakery products, dairy products, and nonalcoholic beverages. In addition, American consumers paid more to dine out at restaurants in August.
The Price of Gasoline
Conversely, American consumers enjoyed a bit of respite at the gas pumps in August. The price of gasoline dropped by 10.6%. This is the second consecutive monthly decline in gas prices following a 7.7% drop at the pumps seen in July.
In August, prior to seasonal adjustment, the price of gasoline dropped by 12.2%.
Over the last 12-month period, gasoline prices soared 25.6%.
Energy
In August, the energy index decreased 5%, largely due to the decline in gas prices. Yet, American consumers paid 1.5% more for electricity over the month. Likewise, the natural gas index also rose by 3.5%.
Since this time last year, the index for energy increased by 23.8%. Year-over-year, the price of fuel oil skyrocketed an astounding 68.8%. Natural gas prices likewise soared 33% since this time last year. In addition, over the last 12-month period, American consumers paid 15.8% more for electricity – the largest year-over-year rise since August 1981.
(Source: U.S. Bureau of Labor Statistics)
All Items Less Food and Energy
In August, the all items less food and energy index edged up 0.6%. American consumers continued to pay more for shelter, as the index rose 0.7% over the month.
Rent prices also increased 0.7%, as did the index for owners’ equivalent rent, which is correlated to the value of housing prices.
Moreover, Americans also paid 0.7% more for medical costs over the month. In August, all major medical care composite indexes saw percentage increases. The hospital services index rose 0.7%, the price of prescription drugs grew by 0.4%, and the physicians’ services index also edged up by 0.2%.
Over the last 12-month period, the all items less food and energy index increased by 6.3%. Year-over-year, the composite index for shelter increased by 6.2%, which contributed to roughly 40% of the total growth of the index for all items less food and energy.
Likewise, American consumers paid 5.4% more for medical care since this time last year.
Want to learn more about how inflation is impacting the economy? Here is our table highlighting the 2022 CPI and Inflation Rate for the United States, try our U.S. inflation calculator, and subscribe to our newsletter.
Source Cited: https://www.bls.gov/news.release/archives/cpi_09132022.htm
by Andrew | Jul 17, 2015 | BLS, CPI, Definitions, In the news, Inflation, Monthly CPI Updates
U.S. consumer prices increased for the fifth consecutive month in June, led higher by a rebounding price of gasoline, although there was nothing in the latest release which should pose any immediate alarm for markets or consumers at large. The latest report from the BLS reported an overall increase in headline inflation of 0.3% month on month – an increase that was inline with nearly all economists polled prior to the announcement. Looking at the headline number on an annualized basis, inflation rose 0.1 percent In the 12 months through June, following an unchanged reading for the month of May.
Gasoline prices rose 3.4% month on month, following a 10.4 percent surge in May. Given the recent volatility in crude oil prices and inventory data in July, there could be scope for the influence of rising gas prices to subside in coming months. Oil is currently trading within the $50-60 / bbl range, well below the levels seen in May and June.
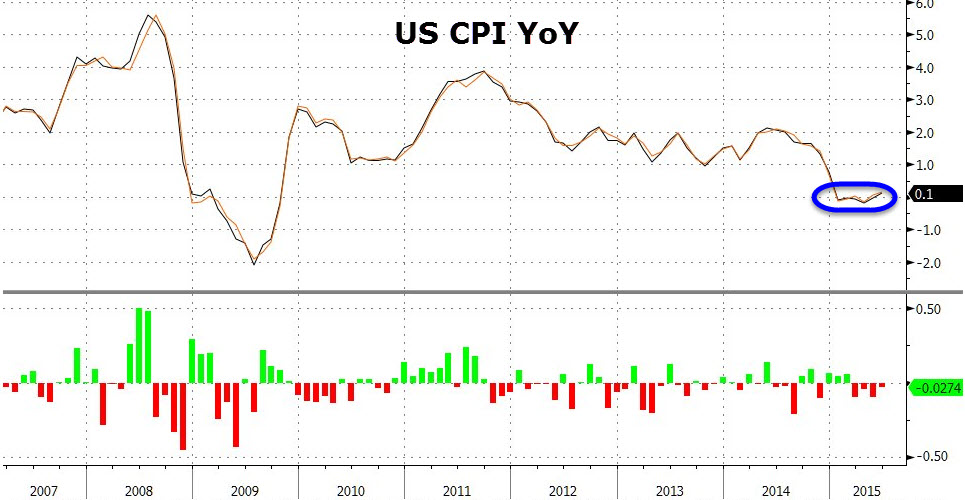
Core CPI, which excludes food and energy related costs, increased 0.2 percent month on month following a rise of 0.1% previously. On an annualized basis, core CPI has now risen 1.8 percent.The June reading continues to highlight just how tame the inflationary environment is within the US economy at present. The strong dollar is helping to keep a lid on inflation by reducing the price of imports and wholesale costs. The strong US dollar has been been spurred partly by a flight to safety due to concerns in Europe and China, and partly by the market’s anticipation of a Fed rate hike later this year. We should expect to start hearing comments regarding the damaging effects of the stronger dollar by Fed officials in the weeks and months ahead should this trend continue.
The food index posts largest increase since September 2014
The price of food increased 0.3% in June, largely to an ongoing shortage in wholesale eggs which has caused a sharp jump in retail egg prices across the nation. Egg prices jumped 18.3% in June, the largest monthly gain since August 1973. Elsewhere, the index for meats, poultry, fish, and eggs rose 1.4 percent in June, with the beef index rising 0.9 percent. Food prices are likely to remain elevated in the coming months as the aftermath of the bird flu epidemic works its way through the supply chain. Wholesale food costs have been consistently increasing in PPI surveys, and these costs are likely to make their way down to the consumer in the weeks and months ahead.
Medical Price Inflation starting to cool off
Medical related inflation cooled in June which will be a welcome deviation from the overall trend in 2015. The price for Medical Care Services fell -0.2% in June and the prices for Medical Care Commodities remained unchanged month on month. Health care costs have been one of the largest contributors to inflation over the past 12 months, with both indices rising 2.3 percent and 3.3 percent respectively.
Rent Prices continue to Climb Higher
The shelter index climbed 0.3% in June, and 3% on an annualized basis as the supply of housing continues to shrink in key regions. Rent increases are also amongst the largest contributors to overall inflation in the United States within the past 12 months.
Outlook for Rates
This month’s CPI data contains no surprises, and the relatively tame reading in the core number on the back of the strong US dollar will likely stick in the minds of Fed officials in the weeks ahead. Globally, sentiment continues to wane dramatically given the continued turmoil in Greece, and increasingly China. While Greece appears to be on the verge of some sort of political settlement, the headline risk remains. In China’s case, there is a very real danger of investor sentiment turning, which could spell disaster for emerging markets overall. Latin American and South East Asian markets look at particular risk, especially on the currency front. The fate of these regions would be sealed in no uncertain terms should the Fed raise rates, and it is for this reason that it appears increasingly unlikely that the Fed will raise by year end, despite all of their rhetoric and expressed intention to do so.
by Andrew | Mar 6, 2015 | BLS, CPI, Inflation
Inflation is one of the most important economic indicators for everyone, especially for investors, businesses, retirees, and policymakers. It affects the cost of groceries, rent, mortgage rates, wages, savings accounts, bond yields, retirement planning, and even the way the Federal Reserve thinks about interest rates.
But here is the part many people miss: there is not just one way to measure inflation.
On this site, we focus heavily on the CPI inflation calculator because the Consumer Price Index is one of the most widely recognized inflation measures in the United States. But CPI is only one part of the bigger picture. Economists, investors, journalists, and the Federal Reserve also look at PPI, PCE, Core CPI, Core PCE, Chained CPI, wage growth, commodity prices, and other indicators.
I have been writing about financial and investment-related topics for more than two decades, and one lesson I have learned is that inflation data can tell different stories depending on the measure you use. That does not mean one number is “fake” and another is “real.” It means each measure has a different purpose, a different method, and a different weakness.
Quick Answer: What Is the Best Way to Measure Inflation?
Honestly, there is no single perfect inflation measure. CPI is useful for understanding consumer price changes. PCE is closely watched by the Federal Reserve. PPI can show price pressure before it reaches consumers. Core inflation strips out volatile food and energy prices. The best approach is to understand what each measure is designed to show, then use them together.
The Bureau of Labor Statistics describes CPI as a measure of the average change over time in prices paid by urban consumers for a representative basket of consumer goods and services. The Bureau of Economic Analysis says the PCE Price Index captures inflation or deflation across a wide range of consumer expenses and reflects changes in consumer behavior. The Federal Reserve’s 2% longer-run inflation goal is measured using the annual change in the PCE Price Index, not CPI.
Why Inflation Is Measured in Different Ways
Inflation sounds simple: prices go up, and money buys less. But measuring inflation across a large, complex economy is not simple at all.
Different people spend money differently. A retiree, a renter, a homeowner, a student, a family with young children, and a small business owner may all experience inflation in very different ways. One person may feel food inflation most. Another may feel rent, insurance, healthcare, or gasoline more sharply.
That is why different inflation measures exist. Each one answers a slightly different question.
| Inflation Measure |
What It Measures |
Why It Matters |
| CPI |
Prices paid by urban consumers for a basket of goods and services. |
Commonly used by consumers, media, contracts, and inflation calculators. |
| PPI |
Prices received by domestic producers for goods and services. |
Can show inflation pressure before it reaches consumers. |
| PCE |
Prices paid for goods and services consumed by people in the U.S. |
The Federal Reserve’s preferred inflation measure. |
| Core CPI / Core PCE |
Inflation excluding food and energy. |
Helps show underlying inflation trends without the noisiest categories. |
| Chained CPI |
Consumer inflation adjusted for substitution behavior. |
Can reflect how consumers change purchases when prices shift. |
| Alternative indicators |
Gold, commodities, wages, rents, market expectations, and private estimates. |
Can provide context, but should not replace official inflation data. |
Official Government Inflation Measures: CPI and PPI
The Bureau of Labor Statistics has the difficult job of collecting and publishing several major U.S. inflation measures. Two of the most widely followed are the Consumer Price Index and the Producer Price Index.
Consumer Price Index: CPI
The Consumer Price Index, or CPI, measures the average change over time in prices paid by consumers for a representative basket of goods and services. It is probably the inflation measure most people recognize because it appears in news headlines, wage discussions, cost-of-living adjustments, and many personal finance calculations.
The CPI includes major categories such as food, housing, apparel, transportation, medical care, recreation, education, and other goods and services. If you want a deeper explanation of the method, we have a guide on what the Consumer Price Index is and how it is calculated.
One reason CPI matters so much is that it gives consumers a practical way to understand changes in purchasing power. When CPI rises, the same dollar generally buys less than it did before. You can see this clearly by comparing historical prices with our historical CPI tables.
The image above shows why the CPI is sometimes described as a “basket of goods” measure. In simple terms, the BLS tracks a representative mix of consumer spending categories and uses that basket to estimate how prices are changing over time. You can read more about this concept in our guide to what a basket of goods means.
Best use of CPI: CPI is useful when you want to understand consumer-facing inflation, cost-of-living changes, or how much purchasing power has changed over time.
Producer Price Index: PPI
The Producer Price Index, or PPI, measures price changes from the producer side of the economy. According to the BLS, PPI measures the average change over time in selling prices received by domestic producers for goods and services.
PPI matters because producer prices can sometimes move before consumer prices. If businesses pay more for raw materials, labor, energy, shipping, or wholesale goods, those higher costs may eventually show up in consumer prices.
That does not always happen immediately. Some companies absorb higher costs to stay competitive. Others pass costs on quickly. The result depends on demand, competition, pricing power, profit margins, and the broader economy.
Still, PPI is worth watching because it can provide an early signal of inflation pressure inside the production pipeline.
Best use of PPI: PPI is useful when you want to understand inflation pressure before it fully reaches consumers. It can be especially helpful for investors, business owners, and analysts watching supply chains and profit margins.
PCE Inflation: The Fed’s Preferred Measure
The Personal Consumption Expenditures Price Index, usually called the PCE Price Index, is another major inflation measure. It is produced by the Bureau of Economic Analysis rather than the Bureau of Labor Statistics.
PCE is especially important because it is the Federal Reserve’s preferred inflation measure. The Federal Reserve says it seeks inflation of 2% over the longer run as measured by the annual change in the PCE Price Index.
One reason economists like PCE is that it can better reflect changes in consumer behavior. For example, if beef prices rise sharply and consumers buy more chicken instead, PCE is designed to capture this kind of substitution more flexibly than traditional CPI.
PCE also covers a broader range of expenditures, including some purchases made on behalf of consumers, such as certain healthcare costs paid by employers or government programs.
| CPI |
PCE |
| Produced by the Bureau of Labor Statistics. |
Produced by the Bureau of Economic Analysis. |
| Focuses on out-of-pocket prices paid by urban consumers. |
Covers a broader range of consumption expenditures. |
| Often used in media, contracts, calculators, and cost-of-living discussions. |
Preferred by the Federal Reserve for its inflation target. |
| May show a different inflation rate than PCE. |
Can better reflect substitution and changing spending patterns. |
For everyday consumers, CPI is often easier to understand. For monetary policy, PCE is often more important. If you are trying to understand what the Fed may do with interest rates, you should pay attention to PCE and Core PCE as well as CPI.
Core Inflation: Why Food and Energy Are Often Excluded
Core inflation usually refers to inflation excluding food and energy. At first, this can sound strange. Food and energy are not optional for most households. Anyone who buys groceries or fills up a car knows these prices matter.
So why exclude them?
The reason is not that food and energy are unimportant. The reason is that food and energy prices can swing sharply from month to month because of weather, wars, supply disruptions, seasonal changes, oil markets, and other temporary shocks. By removing those categories, economists try to get a cleaner view of the underlying inflation trend.
Core CPI and Core PCE are both widely watched. The BEA notes that Core PCE, which excludes food and energy, is closely watched by the Federal Reserve as it conducts monetary policy.
In my view, consumers should look at both headline and core inflation. Headline inflation shows what people are actually paying across the full basket. Core inflation helps show whether inflation pressure is becoming more deeply embedded in the economy.
How to Think About Headline vs. Core Inflation
- Headline inflation includes food and energy, so it can better reflect what households feel month to month.
- Core inflation excludes food and energy, so it may better reflect the underlying trend.
- Both matter because consumers live with headline inflation, while policymakers often focus closely on core inflation.
Chained CPI: Measuring Substitution Behavior
Chained CPI is another inflation measure that tries to account for changes in consumer behavior. When prices rise, people often substitute cheaper products for more expensive ones. For example, if one type of meat becomes much more expensive, a household might buy a different protein instead.
Traditional CPI measures price changes based on a basket of goods and services. Chained CPI adjusts more directly for the way consumers shift spending when relative prices change.
This can make Chained CPI grow more slowly than traditional CPI in some periods. Supporters argue that it reflects real consumer behavior more accurately. Critics argue that it may understate the pressure felt by households that cannot easily substitute away from rising costs like rent, healthcare, insurance, or utilities.
That is a key theme across inflation measurement: every method has tradeoffs.
Median CPI and Trimmed Mean Inflation
Some economists use inflation measures that remove extreme price movements, not just food and energy. Two examples are Median CPI and trimmed mean inflation.
The idea is simple. In any given month, a few categories can jump or fall dramatically. Those outliers can distort the headline number. Median and trimmed mean measures try to show the middle of the inflation distribution by reducing the influence of extreme categories.
The Federal Reserve Bank of Cleveland has also explained how CPI and PCE differ, including why the Fed’s preferred measure is PCE. Regional Federal Reserve banks often publish useful inflation research, including measures such as median CPI and trimmed mean inflation.
These measures are more technical, but they can be helpful when headline inflation is being distorted by one-time spikes in categories like energy, used cars, airline fares, or shelter.
Wage Inflation and Labor Costs
Inflation is not only about consumer prices. Wages and labor costs also matter.
If wages rise faster than productivity, businesses may raise prices to protect margins. On the other hand, if consumer prices rise faster than wages, households lose purchasing power. That is why wage growth and inflation are often discussed together.
For consumers, the practical question is simple: is your income rising faster than your cost of living?
A 4% raise does not feel like a raise if your personal cost of living rises 6%. This is one reason many households can feel financially squeezed even when the official economy looks stable.
To understand why inflation affects households so differently, it helps to read our guide on how CPI affects inflation.
Commodity Prices, Gold, and Market-Based Inflation Signals
Some investors also watch commodity prices, including oil, copper, agricultural products, and gold, for clues about inflation. These indicators can be useful, but they need to be handled carefully.
Gold has historically been seen by many investors as a store of value and a hedge against currency weakness, inflation risk, and financial stress. When investors lose confidence in paper currencies, central banks, or the broader financial system, gold may attract more attention.
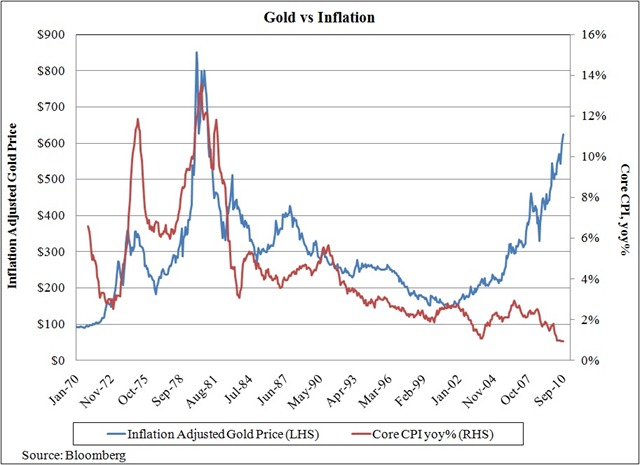
The chart above reflects the older version of this article’s discussion around gold and inflation. I still think gold is worth watching, but I would not treat it as a clean inflation measure. Gold prices can be influenced by real interest rates, the U.S. dollar, central bank buying, geopolitical risk, investor fear, and long-term demand for hard assets.
That means gold can provide useful context, but it should not replace CPI, PCE, or other official inflation data. If you are interested in that topic, we have a dedicated article on whether gold is a good inflation hedge, as well as an inflation-adjusted gold return calculator.
Investor note: Gold, oil, copper, and other commodities can provide signals about inflation pressure, but they also react to many non-inflation factors. I view them as context, not replacements for official inflation indexes.
Private and Alternative Inflation Estimates
Some investors and analysts are skeptical of official inflation statistics and prefer to track alternative estimates. This skepticism has existed for a long time, especially among people who believe CPI does not fully capture the cost pressures they feel in daily life.
I understand the frustration. Official inflation data can feel disconnected from your household experience if your rent, insurance, groceries, or healthcare costs are rising faster than the national average.
At the same time, I would be careful about treating private inflation estimates as automatically more accurate. Official statistics have limitations, but they also use transparent methodologies, large datasets, and long historical series. Private estimates can be useful as a second opinion, but they may also use assumptions that produce very different results.
The better approach is not to rely blindly on any single number. Look at multiple indicators and understand what each one is measuring.
Why Your Personal Inflation Rate May Differ From CPI
One of the most important points in this article is that the official inflation rate may not match your personal inflation rate.
CPI is based on average spending patterns. But your household is not average. Your budget might be heavily weighted toward rent, childcare, gasoline, insurance, healthcare, or food. If those categories rise faster than the overall CPI, your personal inflation rate may feel much higher.
| Household Type |
Inflation They May Feel Most |
| Renter |
Rent increases, utilities, insurance, transportation. |
| Homeowner |
Property taxes, insurance, repairs, maintenance, utilities. |
| Retiree |
Healthcare, food, insurance, utilities, fixed-income pressure. |
| Commuter |
Gasoline, auto insurance, repairs, financing costs. |
| Family with children |
Food, childcare, housing, education, clothing, medical costs. |
This is why I usually recommend looking at both official inflation and your own budget. The CPI tells you what is happening broadly. Your bank statement tells you what is happening personally.
How Investors Can Use Different Inflation Measures
Investors should pay attention to inflation because it affects interest rates, bond yields, stock valuations, commodity prices, real estate, cash returns, and retirement planning.
For example:
- CPI helps investors understand consumer-facing inflation and purchasing power.
- PPI can show cost pressure on companies before it reaches consumers.
- PCE matters because the Fed uses it for its inflation target.
- Core inflation helps show whether inflation pressure is broad and persistent.
- Commodity prices can offer market-based clues, especially around energy and materials.
- Wage growth can show whether consumers are keeping up with price increases.
If you are building a portfolio, inflation matters because what counts is your real return, not just your nominal return. A 5% investment return looks good until inflation is 4%. In that case, your real return before taxes is only about 1%.
For more on that topic, read our guide to investing during inflation and deflation or our article on inflation-resistant investment ideas.
How Consumers Can Use Inflation Data
You do not need to be an economist to use inflation data. For regular households, inflation data can help with budgeting, wage negotiations, retirement planning, debt decisions, and savings goals.
Here are a few practical ways to use it:
- Use CPI to understand how prices have changed over time.
- Compare your wage growth with inflation to see whether your real income is rising.
- Review your savings rate against inflation to understand your real return.
- Use inflation assumptions when estimating future retirement expenses.
- Watch PCE and Core PCE if you are trying to understand the Federal Reserve’s likely policy direction.
- Track CPI release dates using our CPI release schedule.
Inflation can also connect to broader economic cycles. If you want to understand the relationship between inflation, slowdowns, and contractions, read our explainer on inflation vs. recession vs. depression.
Which Inflation Measure Should You Trust?
The honest answer is that you should not rely on one measure alone.
CPI is useful for understanding consumer prices. PCE is important for Federal Reserve policy. PPI can provide early warnings about business cost pressures. Core inflation can help identify underlying trends. Gold and commodities can provide market context. Your personal budget tells you what inflation feels like in your real life.
If I had to simplify it, I would say this:
My Practical Inflation Dashboard
- For household purchasing power: CPI and your own monthly spending.
- For Federal Reserve policy: PCE and Core PCE.
- For business cost pressure: PPI.
- For underlying trend: Core CPI, Core PCE, median CPI, and trimmed mean measures.
- For market sentiment: gold, oil, commodities, bond yields, and inflation expectations.
No measure is perfect. But together, they can give you a much more complete picture of inflation than any single headline number.
Final Thoughts: Cover All Bases
There is no single inflation measure that tells the whole story. CPI, PPI, PCE, Core PCE, Chained CPI, commodities, wages, and private estimates all provide different pieces of the inflation puzzle.
The important thing is to understand what each measure is good at and where it falls short.
For most consumers, CPI is the easiest inflation measure to understand. For monetary policy, PCE is crucial. For investors and business owners, PPI and core inflation can help reveal pressure building beneath the surface. For your own household, your personal budget may be the most important inflation measure of all.
That is why I believe the best approach is to cover all bases. Follow the official numbers, understand their limitations, and compare them with your real-life spending. Inflation is not just a government statistic. It is something you feel every time your money buys less than it used to…

