-v3")

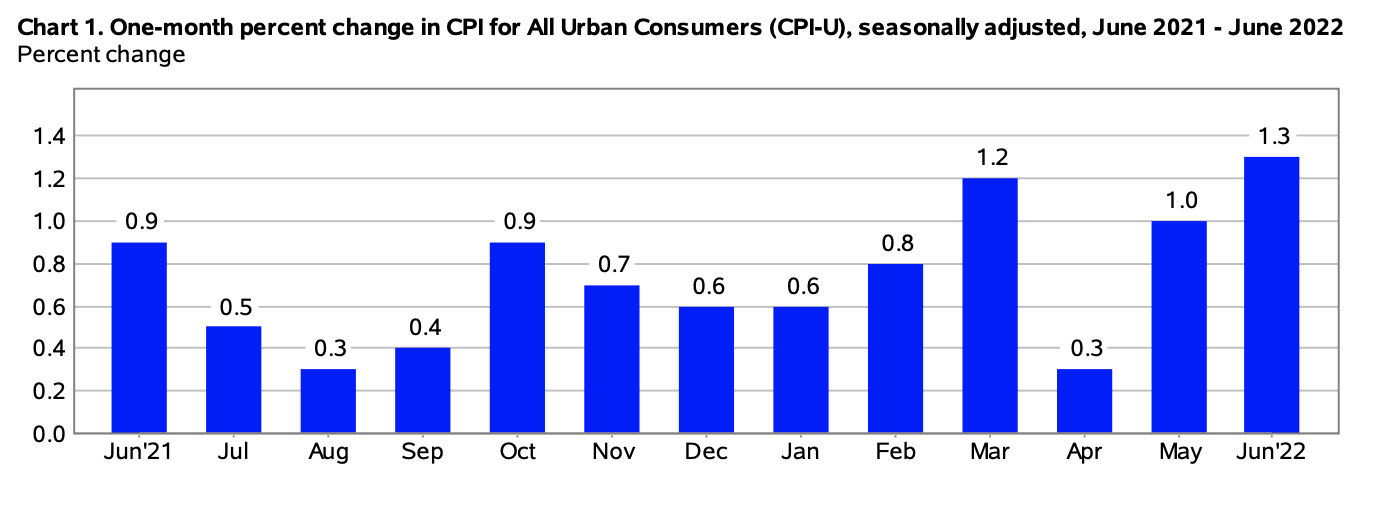
The Consumer Price Index for All Urban Consumers (CPI-U) grew by 1.3% on a seasonally adjusted basis in June, reported the U.S. Bureau of Labor Statistics. Over the last 12-month span, prior to seasonal adjustment, the all items index grew 9.1%.
“The increase was broad-based, with the indexes for gasoline, shelter, and food being the largest contributors. The energy index rose 7.5% over the month and contributed nearly half of the all items increase, with the gasoline index rising 11.2% and the other major component indexes also rising. The food index rose 1.0% in June, as did the food at home index.
The index for all items less food and energy rose 0.7% in June, after increasing 0.6% in the preceding two months. While almost all major component indexes increased over the month, the largest contributors were the indexes for shelter, used cars and trucks, medical care, motor vehicle insurance, and new vehicles. The indexes for motor vehicle repair, apparel, household furnishings and operations, and recreation also increased in June. Among the few major component indexes to decline in June were lodging away from home and airline fares.
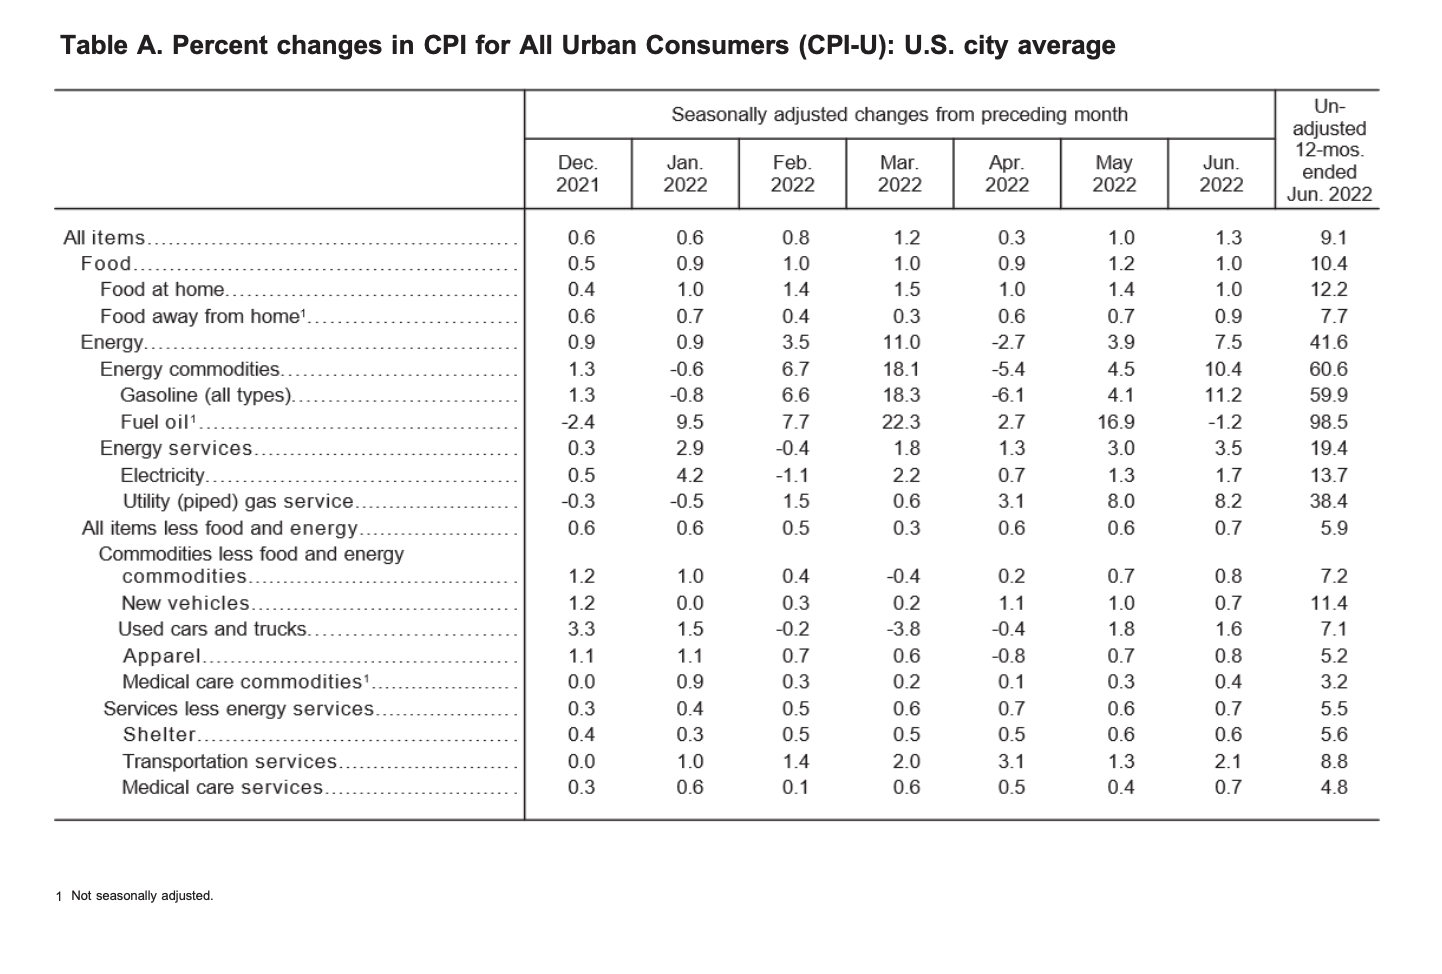
The all items index increased 9.1% for the 12 months ending June, the largest 12-month increase since the period ending November 1981. The all items less food and energy index rose 5.9% over the last 12 months. The energy index rose 41.6% over the last year, the largest 12-month increase since the period ending April 1980. The food index increased 10.4% for the 12-months ending June, the largest 12-month increase since the period ending February 1981,” reported the Bureau of Labor Statistics.
Energy
In June, the index for energy rose 7.5%. The price of gas increased 11.2% for the month, after the 4.1% increase seen in May. The price of electricity also rose 1.7%, and the natural gas index soared 8.2%, “the largest monthly increase since October 2005”.
“The energy index rose 41.6% over the past 12 months. The gasoline index increased 59.9% over the span, the largest 12-month increase in that index since March 1980. The index for electricity rose 13.7%, the largest 12-month increase since the period ending April 2006. The index for natural gas increased 38.4% over the last 12 months, the largest such increase since the period ending October 2005,” explained the bureau in its report.
(Source: U.S. Bureau of Labor Statistics)
Food
In June, the index for food rose 1%. The food at home index likewise increased by 1% for the month, “the sixth consecutive increase of at least 1.0% in that index”. Over the month, five of the six major grocery store food group indexes saw percentage increases, stated the bureau.
“The food away from home index rose 0.9% in June after rising 0.7 percent in May. The index for full-service meals rose 0.8% over the month. The index for limited service meals increased 0.7% in June, as it did in May.
The food at home index rose 12.2% over the last 12 months, the largest 12-month increase since the period ending April 1979. All six major grocery store food group indexes increased over the span, with five of the six rising more than 10%. The index for other food at home increased the most, rising 14.4%, with the index for butter and margarine increasing 26.3%. The remaining groups saw increases ranging from 8.1 percent (fruits and vegetables) to 13.8%(cereals and bakery products).
The index for food away from home rose 7.7% over the last year, the largest 12-month change since the period ending November 1981. The index for full-service meals rose 8.9% over the last 12 months, and the index for limited service meals rose 7.4% over the last year,” said the US Bureau of Labor Statistics.
(Source: U.S. Bureau of Labor Statistics)
All Items Less Food and Energy
The all items less food and energy index grew by 0.7% for the month of June. The shelter index rose 0.6%, the owners’ equivalent rent index increased 0.7%, and the index of rent rose 0.8%, “the largest monthly increase since April 1986”.
“The index for all items less food and energy rose 5.9% over the past 12 months. The increase was broad-based, reflecting advances in almost all major component indexes. The shelter index rose 5.6% over the last year, the largest 12-month increase since the period ending February 1991. The index for household furnishings and operations increased 9.5% over the last 12 months. The index for new vehicles rose 11.4% and the index for used cars and trucks increased 7.1% over the year, while the index for airline fares rose 34.1%,” explained the bureau.
Source cited: https://www.bls.gov/news.release/archives/cpi_07132022.htm

Sarah has been writing on the topics of politics, history and finance for over a decade. She is currently an editor at CPI Inflation Calculator, covering the topics of CPI, inflation, US economy and economic commentary.
