-v3")

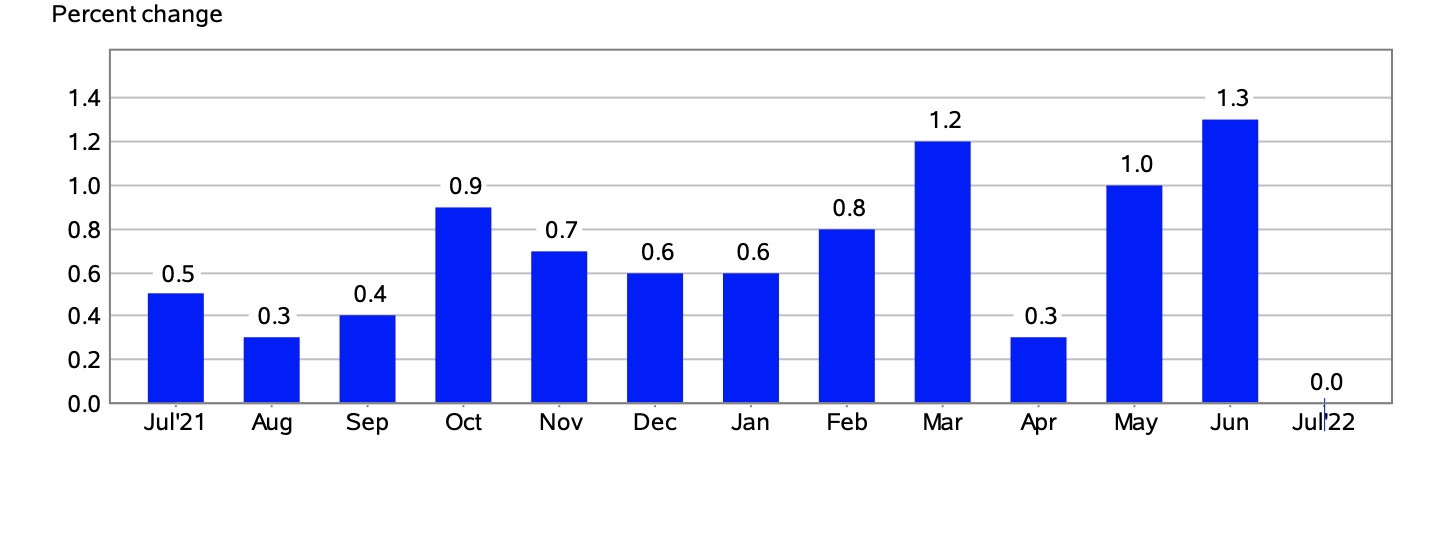
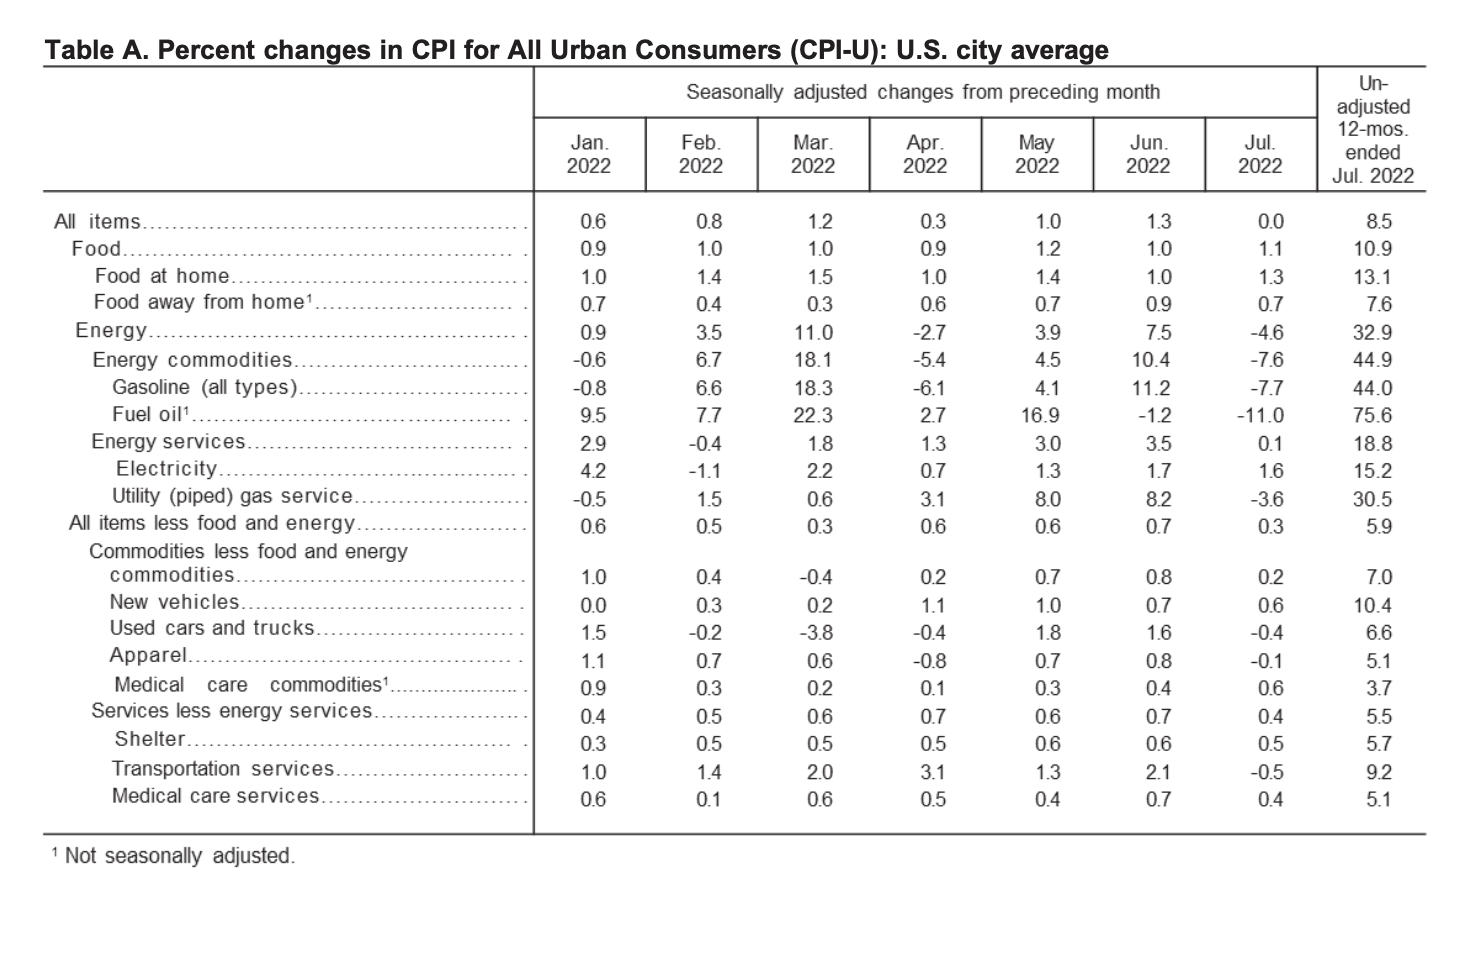
The Consumer Price Index for All Urban Consumers (CPI-U) remained unchanged in July on a seasonally adjusted basis, after a 1.3% increase seen in June, reported the U.S. Bureau of Labor Statistics (BLS). Since this time last year, prior to seasonal adjustment, the all items index grew 8.5%.
In July, American consumers received a bit of relief at the pumps, as gas prices dropped 7.7%. This decrease in the composite index for gasoline was the principal reason for the seasonally adjusted monthly CPI remaining unchanged. Likewise, the decrease in gas prices, as well as the natural gas index, also contributed to the 4.6% monthly decline in the energy index.
Conversely, the index for food rose 1.1% in July mainly because of the 1.3% increase in the composite index for food at home. This means that American consumers paid more for food from grocery stores over the month.
Overall, since this time last year, the all items index rose 8.5%. Additionally, the index for all items less food and energy also increased by 5.9% year-over-year. Most pointedly, the index for food rose 10.9% over the last 12-month period. This marked “ the largest 12-month increase since the period ending May 1979,” explained the U.S. Bureau of Labor Statistics in its monthly report.
The predominant sentiment among Americans is that of uncertainty pertaining to the overall health of the U.S. economy. Interestingly, a recent McKinsey & Company report found that a staggering 30% of U.S. consumers expressed trepidation about a looming recession.
(Source: U.S. Bureau of Labor Statistics)
Food
In July, the index for food rose 1.1%, marking the seventh consecutive monthly increase. The index for food at home increased by 1.3% for the month, with all six major grocery store food group indexes seeing a rise in percentage.
This underscores concerns about food inflation, and specifically how the average American is contending with rising food prices to meet basic daily expenses.
Furthermore, in July U.S. consumers paid more to dine out at restaurants. The index for food away from home edged up 0.7% for the month.
Year-over-year, food prices in grocery stores rose 13.1%. Foodstuffs that saw the most significant percentage increase over the last 12-month period included cereals and bakery products (15%), fruits and vegetables (9.3%), and dairy products (14.9%).
Energy
In July, the index for energy decreased 4.6%, after a 7.5% rise the previous month. The price of gasoline dropped by 7.7%, after rising in June by 11.2%. The natural gas index fell by 3.6%, while the index for electricity increased 1.6% for the month.
Year-over-year, the price of gas soared 44% in July. Overall, the index for energy grew by 32.9% since this time last year. American consumers also paid more for electricity (15.2%) and natural gas (30.5%) over the last 12-month span.
(Source: U.S. Bureau of Labor Statistics)
All Items Less Food and Energy
In July, the index for all items less food and energy edged up 0.3%. The index for shelter grew by 0.5%, the owners’ equivalent rent index increased 0.6%, and the rent index increased 0.7%.
Since this time last year, American consumers paid more to shelter themselves. Specifically, the index for shelter increased 5.7% year-over-year. The Bureau of Labor Statistics explained that this composite index percentage increase was the primary factor for the overall rise in the all items less food and energy index.
Want to learn more about how inflation is impacting the economy? Have a look at our table highlighting information regarding the 2022 CPI and Inflation Rate for the United States, try our calculator widget, and subscribe to our newsletter.
Source Cited: https://www.bls.gov/news.release/archives/cpi_08102022.htm

Sarah has been writing on the topics of politics, history and finance for over a decade. She is currently an editor at CPI Inflation Calculator, covering the topics of CPI, inflation, US economy and economic commentary.
