-v3")

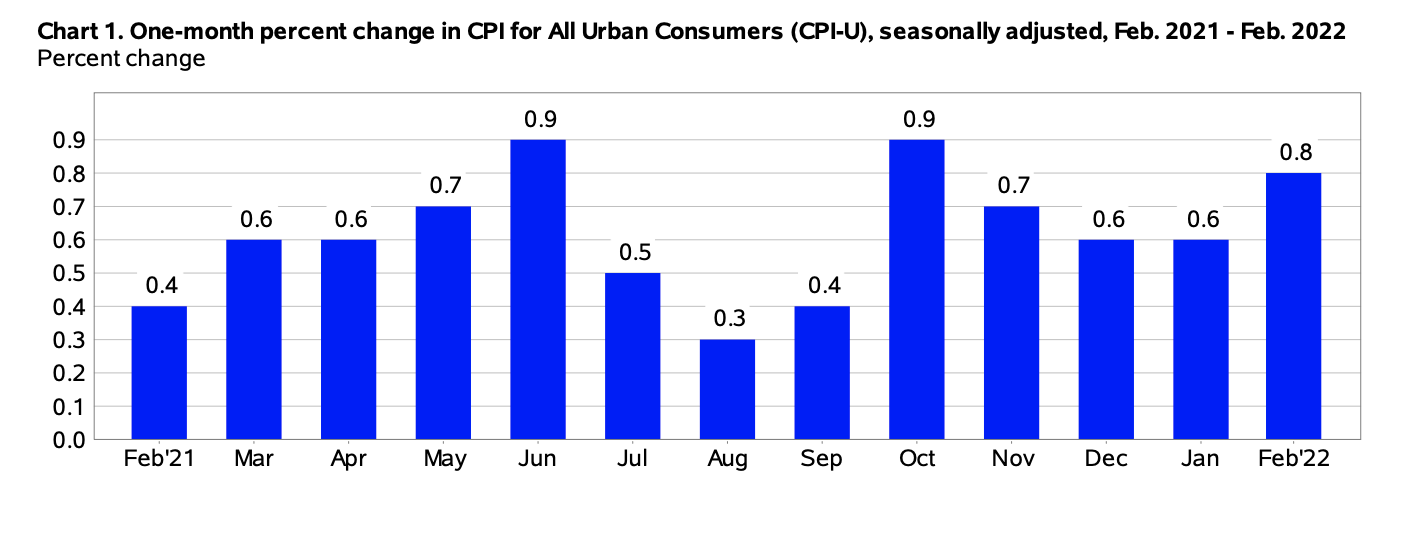
The Consumer Price Index for All Urban Consumers (CPI-U) grew by 0.8% on a seasonally adjusted basis in February, stated the U.S. Bureau of Labor Statistics in its monthly report. This is up from the 0.6% increase in January. Before seasonal adjustment, the all items index, the all items index increased 7.9% since this time last year.
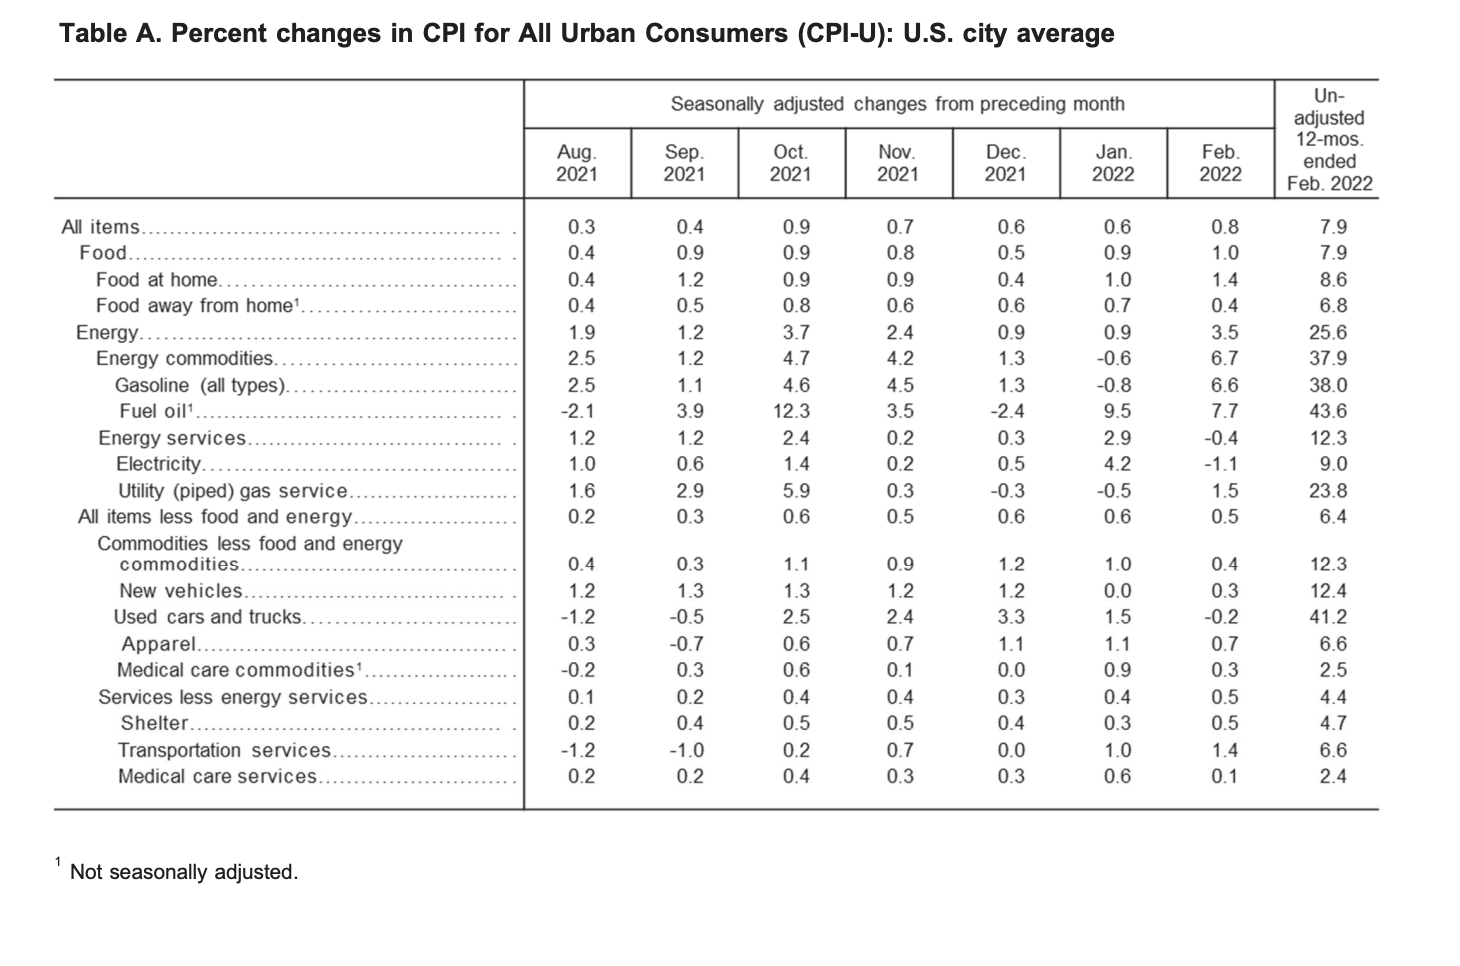
“Increases in the indexes for gasoline, shelter, and food were the largest contributors to the seasonally adjusted all items increase. The gasoline index rose 6.6% in February and accounted for almost a third of the all items monthly increase; other energy component indexes were mixed. The food index rose 1% as the food at home index rose 1.4%; both were the largest monthly increases since April 2020.
The all items index rose 7.9% for the 12 months ending February. The 12-month increase has been steadily rising and is now the largest since the period ending January 1982. The all items less food and energy index rose 6.4%, the largest 12-month change since the period ending August 1982. The energy index rose 25.6% over the last year, and the food index increased 7.9%, the largest 12-month increase since the period ending July 1981,” explained the bureau in its report.
(Source: U.S. Bureau of Labor Statistics)
Energy
In February, the index for energy saw a sharp increase by 3.5%, after the 0.9% rise the previous month. The price of gasoline soared 6.6% after dropping 0.8% in January. The natural gas index rose 1.5%, while the index for electricity decreased 1.1%.
Over the last 12-month period, the index for energy increased by an astounding 25.6%. The price of gasoline skyrocketed 38%, the natural gas index soared 23.8%, and the electricity index increased 9%.
Food
In February, the index for food rose by 1%, with the food at home index rising 1.4% over the month. All six of the component food group indexes saw percentage increases with the fruits and vegetable index up 2.3%, “, its largest monthly increase since March 2010”. Other monthly increases included the fresh fruits index by 3.7%, the fresh vegetables index by 1.3%, the dairy products index by 1.9%, which marked its largest monthly rise since April 2011.
“The food at home index rose 8.6% over the last 12 months, the largest 12-month increase since the period ending April 1981. The index for meats, poultry, fish, and eggs increased 13% over the last year as the index for beef rose 16.2%. The other major grocery store food group indexes also rose over the past year, with increases ranging from 5.2% (dairy and related products) to 8.2% (other food at home).
The index for food away from home rose 6.8% over the last year, the largest 12-month increase since December 1981. The index for limited-service meals rose 8% over the last 12 months, and the index for full-service meals rose 7.5%. The index for food at employee sites and schools, in contrast, declined 40.7% over the past 12 months, reflecting widespread free lunch programs,” explained the Bureau of Labor Statistics.
(Source: U.S. Bureau of Labor Statistics)
All Items Less Food and Energy
The all items less food and energy index inched up 0.5% for the month. Since this time last year, the index increased 6.4%.
“The index for all items less food and energy rose 6.4% over the past 12 months, with virtually all of its major component indexes rising over the span. The shelter index rose 4.7% over the last 12 months, its largest 12-month increase since May 1991. Several transportation indexes showed large increases over the past year, including used cars and trucks (+41.2%), new vehicles (+12.4%), and airline fares (+12.7%),” noted the Bureau of Labor Statistics in its report.
Source cited: https://www.bls.gov/news.release/archives/cpi_03102022.htm

Sarah has been writing on the topics of politics, history and finance for over a decade. She is currently an editor at CPI Inflation Calculator, covering the topics of CPI, inflation, US economy and economic commentary.
