-v3")

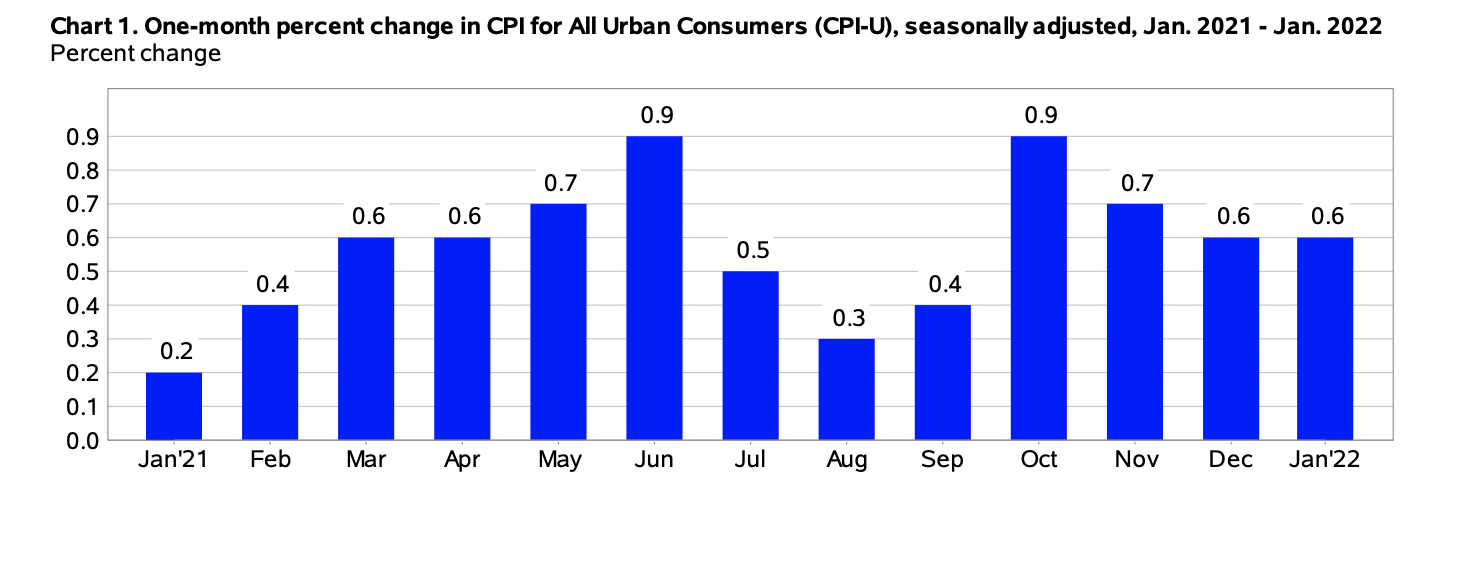
The Consumer Price Index for All Urban Consumers (CPI-U) grew by 0.6% on a seasonally adjusted basis in January, reported the U.S. Bureau of Labor Statistics – the same percentage increase seen in December. Since this time last year, before seasonal adjustment the all items index rose by 7.5%.
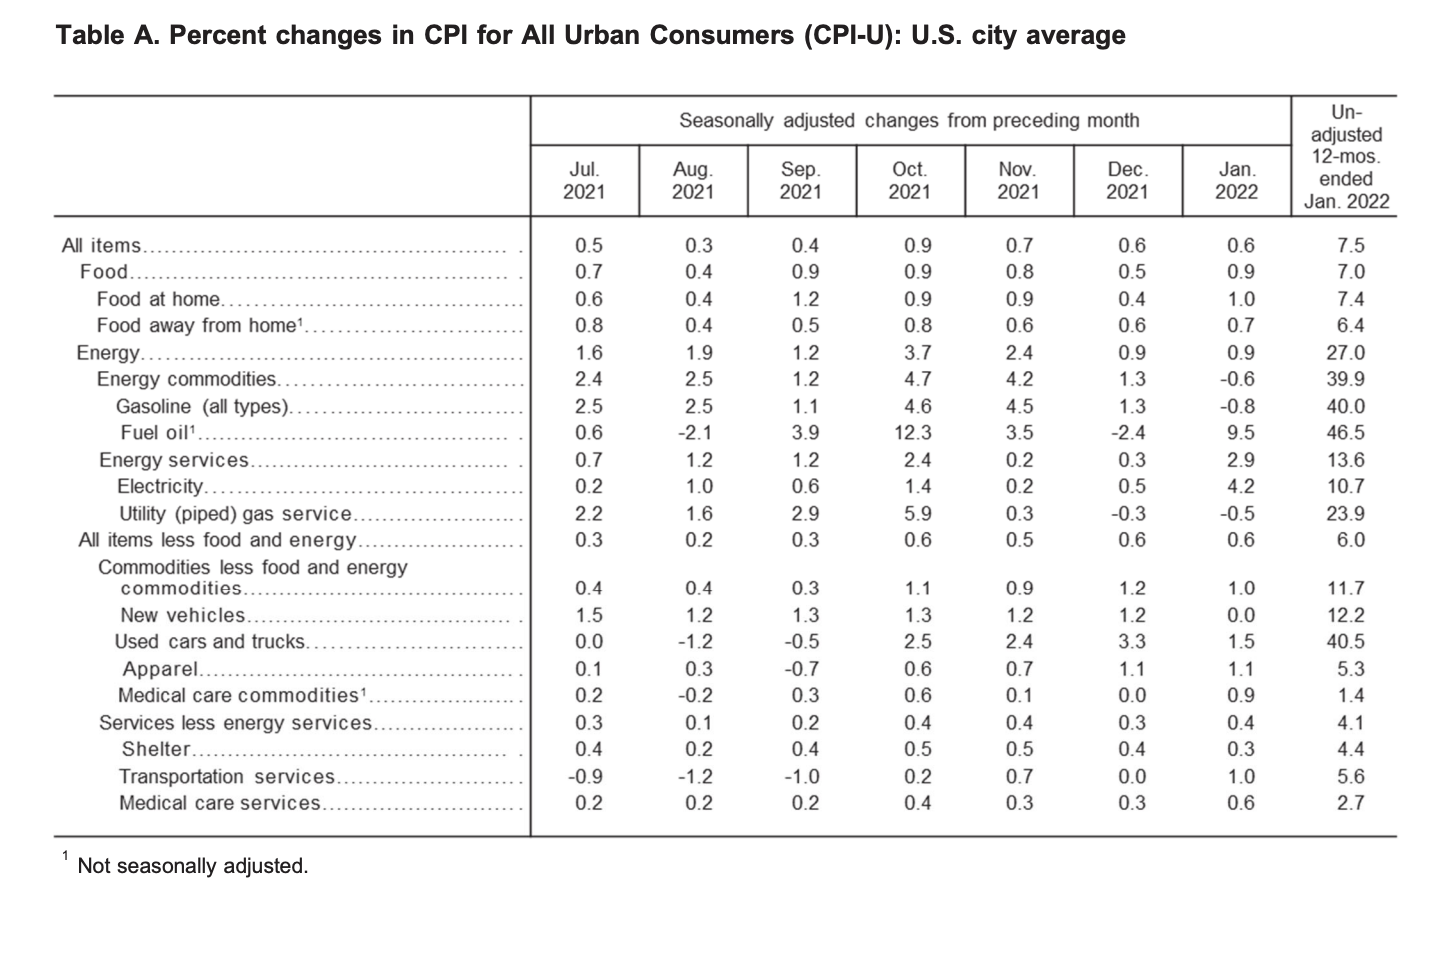
“Increases in the indexes for food, electricity, and shelter were the largest contributors to the seasonally adjusted all items increase. The food index rose 0.9% in January following a 0.5% increase in December. The energy index also increased 0.9% over the month, with an increase in the electricity index being partially offset by declines in the gasoline index and the natural gas index.
The index for all items less food and energy rose 0.6% in January, the same increase as in December. This was the seventh time in the last 10 months it has increased at least 0.5%. Along with the index for shelter, the indexes for household furnishings and operations, used cars and trucks, medical care, and apparel were among many indexes that increased over the month.
The all items index rose 7.5% for the 12 months ending January, the largest 12-month increase since the period ending February 1982. The all items less food and energy index rose 6%, the largest 12-month change since the period ending August 1982. The energy index rose 27% over the last year, and the food index increased 7%,” explained the bureau in the report.
(Source: U.S. Bureau of Labor Statistics)
Food
In January, the index for food rose 0.9%. The food at home index increased 1% over the month, after rising 0.4% in December, explained the bureau. Over the month, five of the six major grocery store food group indexes saw percentage increases. Likewise, the index for food away from home increased 0.7% in January.
“The food at home index rose 7.4% over the last 12 months. All of the six major grocery store food group indexes increased over the period. By far the largest increase was that of the index for meats, poultry, fish, and eggs, which rose 12.2% over the year. The index for dairy and related products increased 3.1%, the smallest 12-month increase among the groups.
The index for food away from home rose 6.4% over the last year, the largest 12-month increase since January 1982. The index for limited-service meals rose 8% over the last 12 months, and the index for full-service meals rose 7.1%. The index for food at employee sites and schools, in contrast, declined 46.9% over the past 12 months, reflecting widespread free lunch programs,” explained the U.S. Bureau of Labor Statistics in its report.
Energy
In January, the index for energy edged up 0.9%, reported the bureau. The price of electricity rose 4.2%. Conversely, gas prices dropped 0.8% as did the natural gas index by 0.5%.
Over the last 12-month period, the index for energy increased 27%. The price of gasoline surged 40%, with percentage increases for the index for natural gas rising 23.9%, and the electricity index increasing 10.7%.
(Source: U.S. Bureau of Labor Statistics)
All Items Less Food and Energy
The all items less food and energy index inched up 0.6% for January. The bureau reported that almost all major component indexes saw percentage increases in January including the shelter index by 0.3%, with the index for rent rising 0.5%, and owners’ equivalent rent by 0.4%.
“The index for all items less food and energy rose 6.0% over the past 12 months. Major contributors to this increase include shelter (+4.4%) and used cars and trucks (+40.5%). However, the increase is broad-based, with virtually all component indexes showing increases over the past 12 months,” stated the U.S. Bureau of Labor Statistics in its monthly report.
Source cited: https://www.bls.gov/news.release/archives/cpi_02102022.htm

Sarah has been writing on the topics of politics, history and finance for over a decade. She is currently an editor at CPI Inflation Calculator, covering the topics of CPI, inflation, US economy and economic commentary.
