-v3")

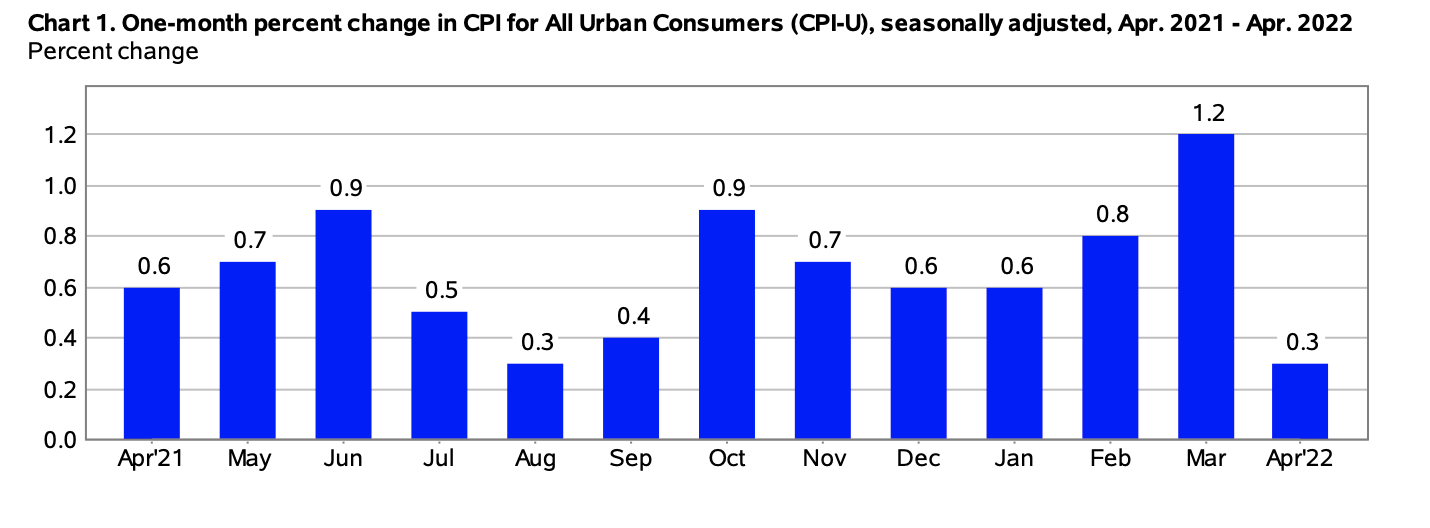
The Consumer Price Index for All Urban Consumers (CPI-U) rose by 0.3% on a seasonally adjusted basis in April, reported the U.S. Bureau of Labor Statistics. Since this time last year, the all items index grew by 8.3% prior to seasonal adjustment.
“Increases in the indexes for shelter, food, airline fares, and new vehicles were the largest contributors to the seasonally adjusted all items increase. The food index rose 0.9 percent over the month as the food at home index rose 1.0 percent. The energy index declined in April after rising in recent months. The index for gasoline fell 6.1 percent over the month, offsetting increases in the indexes for natural gas and electricity.
The index for all items less food and energy rose 0.6 percent in April following a 0.3-percent advance in March. Along with indexes for shelter, airline fares, and new vehicles, the indexes for medical care, recreation, and household furnishings and operations all increased in April. The indexes for apparel, communication, and used cars and trucks all declined over the month.
The all items index increased 8.3 percent for the 12 months ending April, a smaller increase than the 8.5-percent figure for the period ending in March. The all items less food and energy index rose 6.2 percent over the last 12 months. The energy index rose 30.3 percent over the last year, and the food index increased 9.4 percent, the largest 12-month increase since the period ending April 1981,” stated the Bureau of Labor Statistics in its monthly report.
(Source: U.S. Bureau of Labor Statistics)
Food
The index for food rose by 0.9% in April, marking the seventh consecutive monthly rise in this index. The food at home index saw a 1% for the month, with five of the six grocery store food composite indexes all experiencing percentage increases.
The food at home index rose 10.8% over the last 12 months, the largest 12-month increase since the period ending November 1980. The index for meats, poultry, fish, and eggs increased 14.3% over the last year, the largest 12-month increase since the period ending May 1979. The other major grocery store food group indexes also rose over the past year, with increases ranging from 7.8% (fruits and vegetables) to 11% (other food at home).
The index for food away from home rose 7.2% over the last year. The index for full-service meals rose 8.7% over the last 12 months, the largest 12-month increase since the inception of the index in 1997. The index for limited-service meals rose 7% over the last year, while the index for food at employee sites and schools fell 30%, reflecting widespread free lunch programs,” explained the bureau.
Energy
The index for energy decreased 2.7% in April, after soaring 11% the previous month. Gasoline prices dropped 6.1% after leaping 18.3% in March. Composite energy indexes all saw percentage rises including the natural gas index by 3.1% and the electricity index by 0.7%.
“The energy index rose 30.3% over the past 12 months. All the major energy component indexes increased over the year. The gasoline index increased 43.6% and the fuel oil index rose 80.5%. The index for electricity rose 11%, and the index for natural gas increased 22.7% over the last 12 months,” explained the Bureau of Labor Statistics.

(Source: U.S. Bureau of Labor Statistics)
All Items Less Food and Energy
The all items less food and energy index grew 0.6% in April. The index for shelter rose 0.5%. The index for rent increased 0.6% and the owners’ equivalent rent index increased by 0.5%.
“The index for all items less food and energy rose 6.2 percent over the past 12 months. Virtually all major components have increased over the span. The shelter index rose 5.1 percent over the last year, and the medical care index increased 3.2 percent. Several transportation indexes show notable increases including used cars and trucks (+22.7 percent) and new vehicles (+13.2 percent). The index for airline fares rose 33.3 percent over the last year, the largest 12-month increase since the period ending December 1980,” stated the bureau in its report.
Source cited: https://www.bls.gov/news.release/archives/cpi_05112022.htm

Sarah has been writing on the topics of politics, history and finance for over a decade. She is currently an editor at CPI Inflation Calculator, covering the topics of CPI, inflation, US economy and economic commentary.
