-v3")

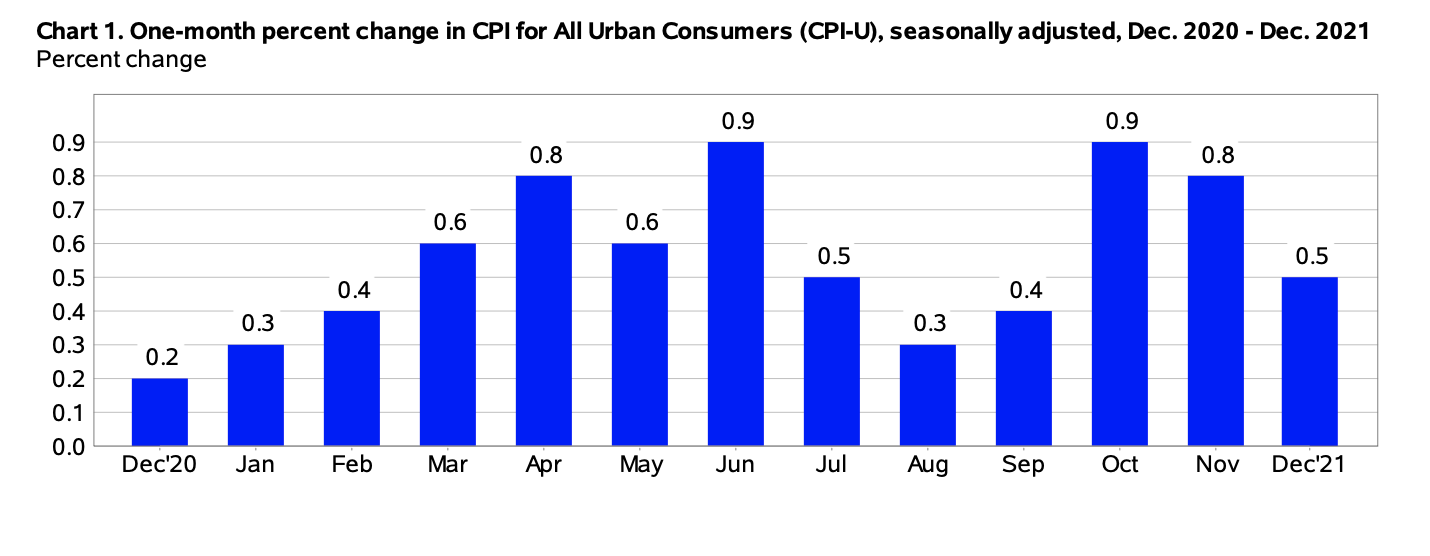
The Consumer Price Index for All Urban Consumers (CPI-U) rose 0.5% on a seasonally adjusted basis, reported the US Bureau of Labor Statistics. In November, it had risen by 0.8%. Over the last 12-month period, the index for all items increased 7% prior to seasonal adjustment.
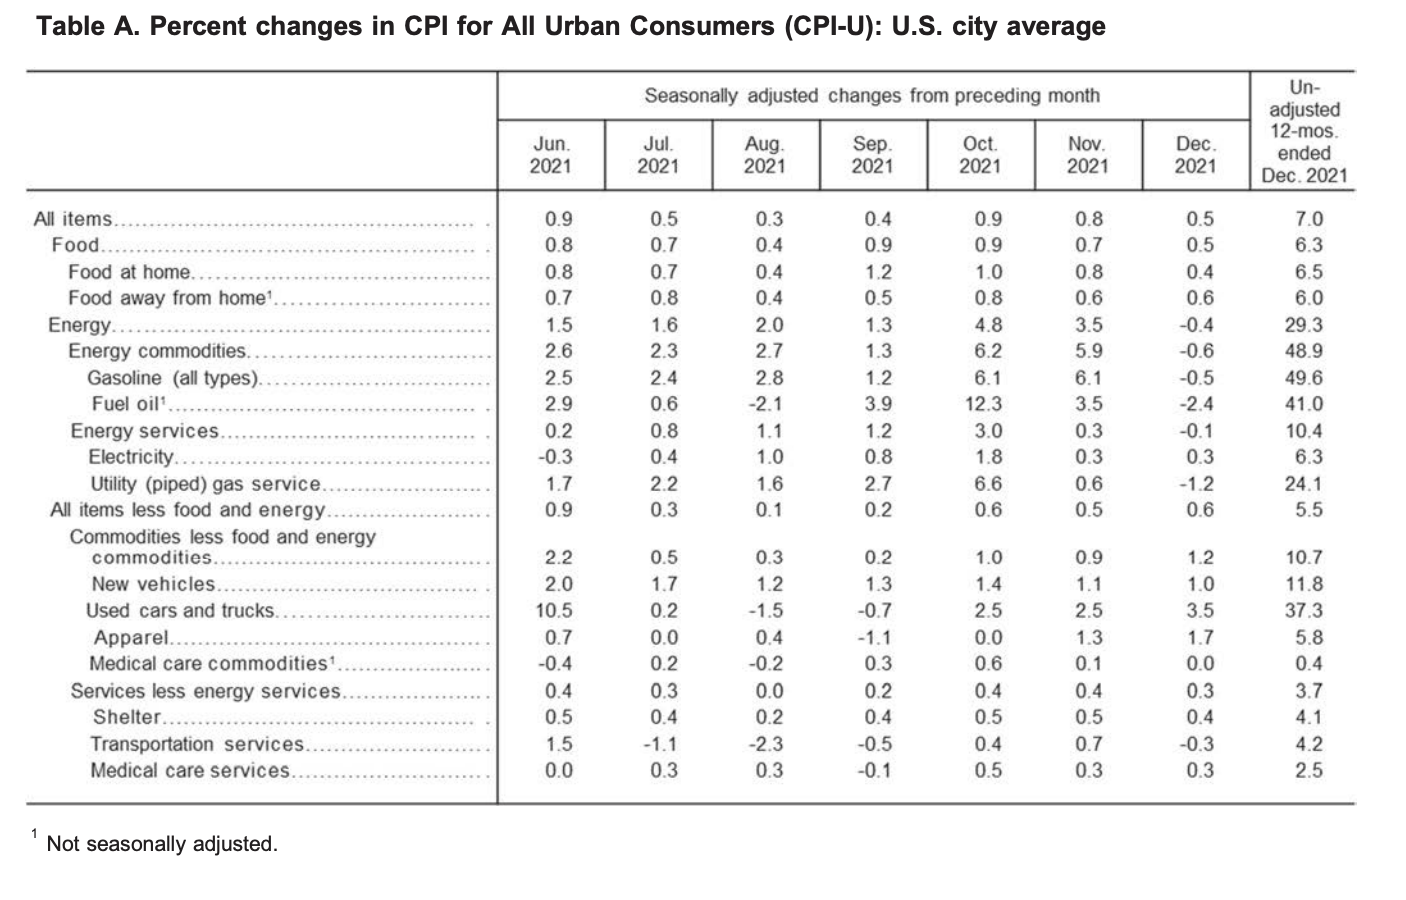
“Increases in the indexes for shelter and for used cars and trucks were the largest contributors to the seasonally adjusted all items increase. The food index also contributed, although it increased less than in recent months, rising 0.5 percent in December. The energy index declined in December, ending a long series of increases; it fell 0.4 percent as the indexes for gasoline and natural gas both decreased.
The index for all items less food and energy rose 0.6 percent in December following a 0.5-percent increase in November. This was the sixth time in the last 9 months it has increased at least 0.5 percent. Along with the indexes for shelter and for used cars and trucks, the indexes for household furnishings and operations, apparel, new vehicles, and medical care all increased in December. As in November, the indexes for motor vehicle insurance and recreation were among the few to decline over the month,” reported the agency.
(Source: U.S. Bureau of Labor Statistics)
Food
In December, the index for food rose 0.5%. The food at home index rose 0.4%, with five of the six grocery store food group indexes seeing percentage increases for the month.
“The index for fruits and vegetables increased the most, rising 0.9 percent over the month as the index for fresh fruits increased 1.8 percent. The index for nonalcoholic beverages rose 0.8 percent in December, and the index for dairy and related products increased 0.7 percent. The index for other food at home rose 0.6 percent, and the index for cereals and bakery products increased 0.4 percent over the month. The index for meats, poultry, fish, and eggs declined in December, falling 0.4 percent after rising at least 0.7 percent in each of the last 7 months. The indexes for beef (-2.0 percent) and pork (-0.8 percent) declined after recent sharp increases,” explained the bureau in its report.
Over the last 12-month period, the index for food at home rose 6.5% – “this compares to a 1.5% annual increase over the last 10 years,” stated the bureau. All six of the component grocery store food group indexes saw percentage increases, with the index for meats, poultry, fish, and eggs rising 12.5%.
Likewise, over the last year, the food away from home index increased 6%, marking the largest percentage rise since January 1982.
Energy
The index for energy dropped 0.4% for the month. In December, gas prices declined 0.5%, after increasing consecutively by 6.1% in both October and November. The natural gas index also decreased 1.2% for the month. Conversely, the index for electricity edged up 0.3%.
Overall, over the last 12-month period, the energy index soared 29.3%. Gas prices skyrocketed 49.6%, the electricity index increased 6.3%, and the natural gas index surged 24.1%.
(Source: U.S. Bureau of Labor Statistics)
All Items Less Food and Energy
In December, the index for all items less food and energy increased by 0.6%. Several of the component indexes saw increases over the month including the shelter index by 0.4%, likewise, the indexes for rent and owners’ equivalent rent both increased 0.4%.
“The index for all items less food and energy rose 5.5% over the past 12 months, its largest 12- month increase since the period ending February 1991. Major contributors to this increase include shelter (+4.1%) and used cars and trucks (+37.3%). However, the increase is broad-based, with virtually all component indexes showing increases over the past 12 months,” explained the US Bureau of Labor Statistics.
The US Bureau of Labor Statistics released a statement regarding the impact of the COVID-19 pandemic on CPI data:
“Data collection by personal visit for the Consumer Price Index (CPI) program has been suspended almost entirely since March 16, 2020. When possible, data normally collected by personal visit were collected either online or by phone. Additionally, data collection in December was affected by the temporary closing or limited operations of certain types of establishments. These factors resulted in an increase in the number of prices considered temporarily unavailable and imputed. While the CPI program attempted to collect as much data as possible, many indexes are based on smaller amounts of collected prices than usual, and a small number of indexes that are normally published were not published this month. For each month from March 2020 to December 2021, BLS has published a summary of the impact of the pandemic on the Consumer Price Index news release and data. The impact summary for December is available at www.bls.gov/covid19/consumer-price-index-covid19-impacts-december2021.htm. Beginning with publication of January 2022 data in February 2022, this month-specific impact summary will be discontinued. However, information related to the impact of the pandemic will continue to be available at www.bls.gov/covid19/effects-of-covid-19-pandemic-on-consumerprice-index.htm.”
Source cited: https://www.bls.gov/news.release/archives/cpi_01122022.htm

Sarah has been writing on the topics of politics, history and finance for over a decade. She is currently an editor at CPI Inflation Calculator, covering the topics of CPI, inflation, US economy and economic commentary.
