by Sarah Bauder | Oct 13, 2021 | CPI
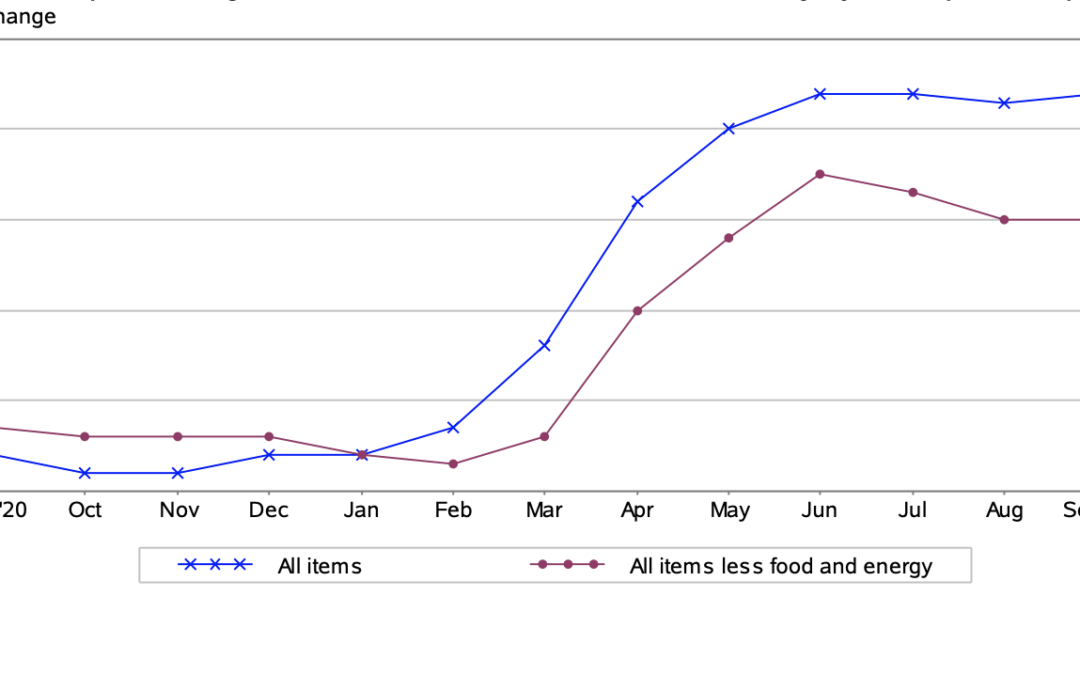
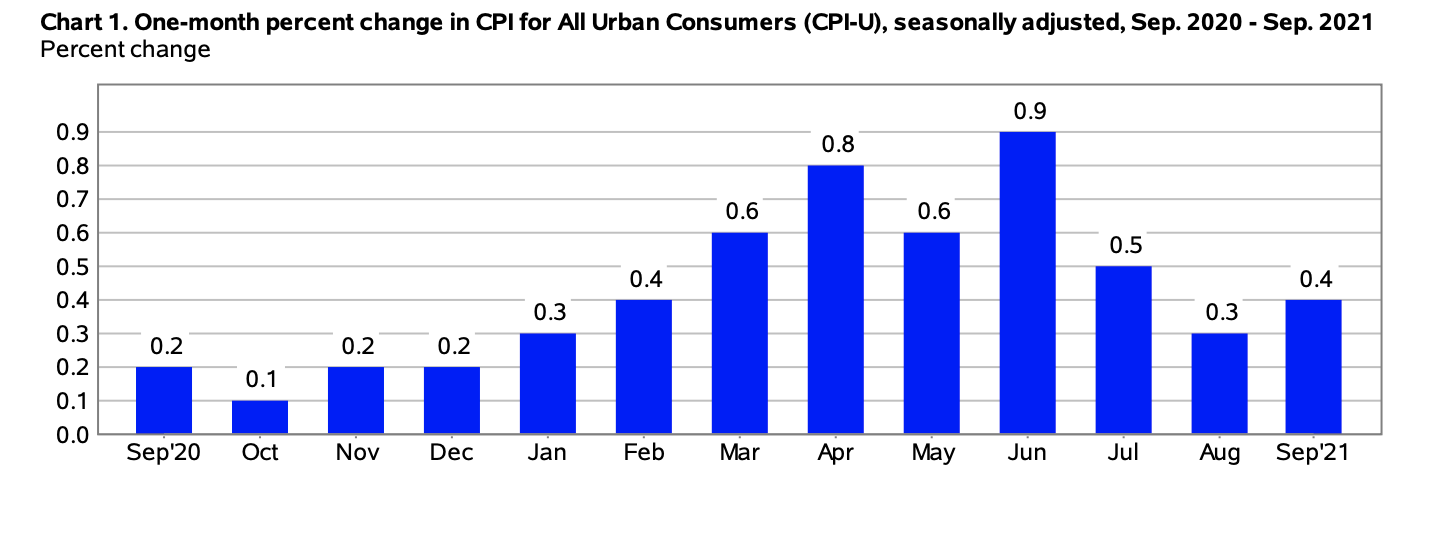
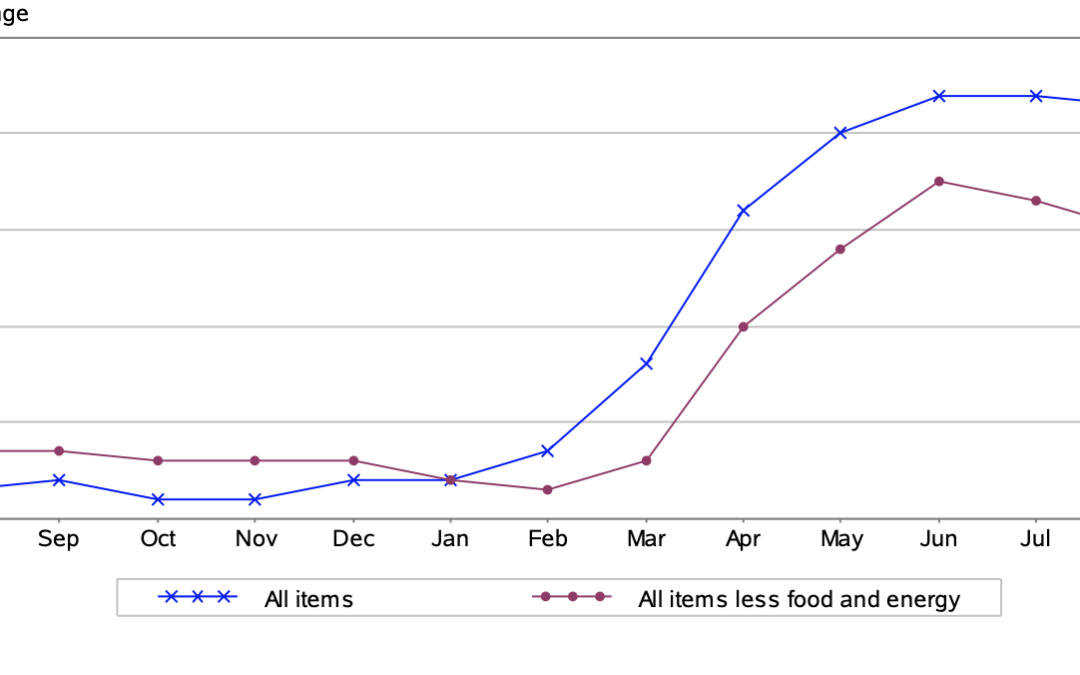
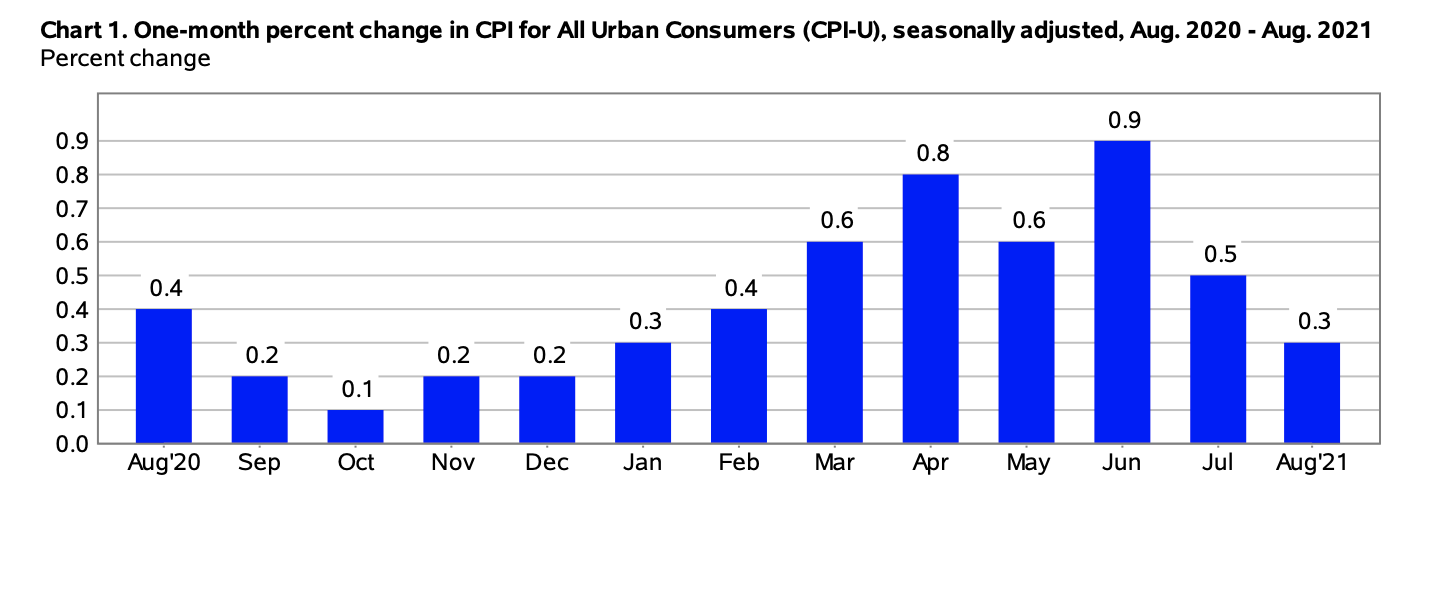
The Consumer Price Index for All Urban Consumers (CPI-U) rose 0.4% in September on a seasonally adjusted basis, reported the US Bureau of Labor Statistics. In August, it had increased by 0.3%. Over the last 12-month period, the index for all items increased by 5.4% prior to seasonal adjustment.
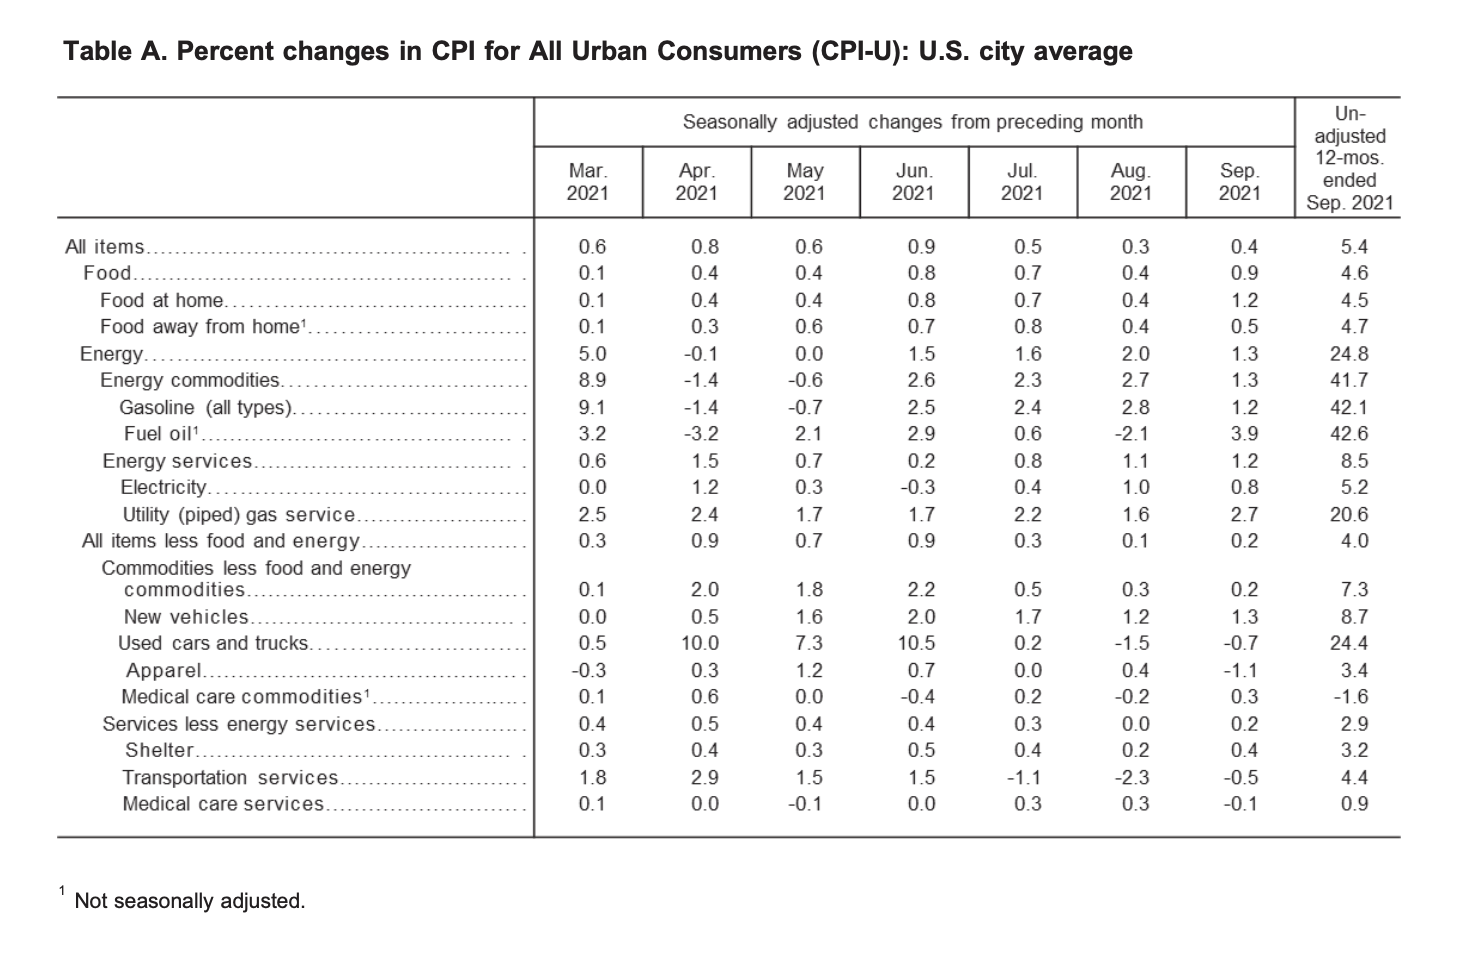
“The indexes for food and shelter rose in September and together contributed more than half of the monthly all items seasonally adjusted increase. The index for food rose 0.9 percent, with the index for food at home increasing 1.2 percent. The energy index increased 1.3 percent, with the gasoline index rising 1.2 percent.
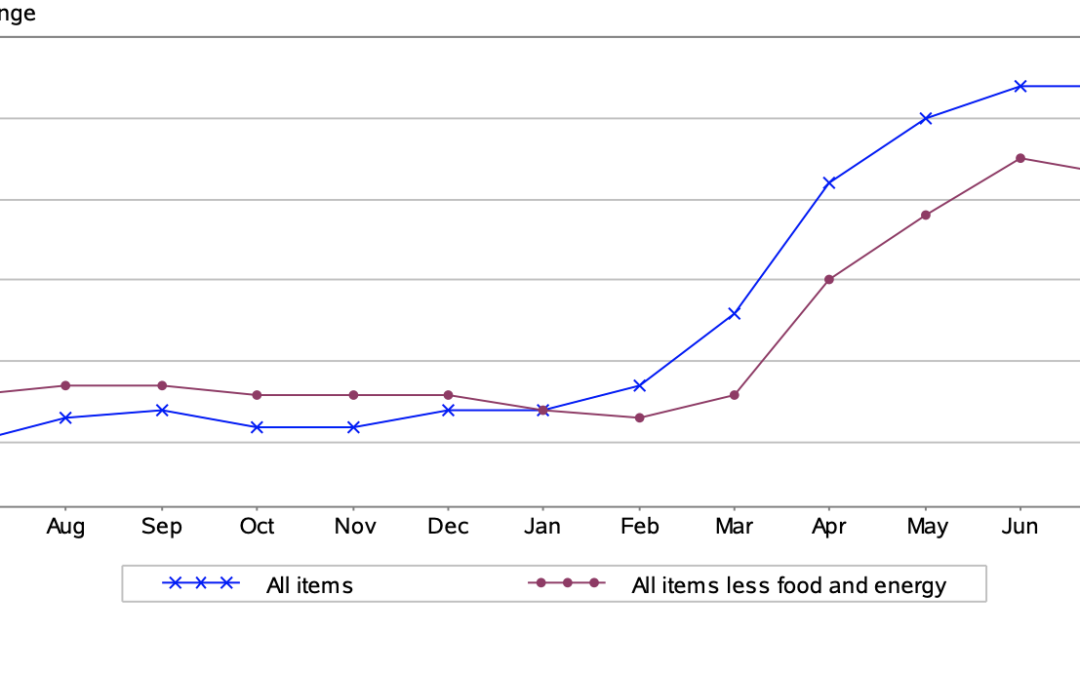
The index for all items less food and energy rose 0.2 percent in September, after increasing 0.1 percent in August. Along with the index for shelter, the indexes for new vehicles, household furnishings and operations, and motor vehicle insurance also rose in September. The indexes for airline fares, apparel, and used cars and trucks all declined over the month,” reported the bureau.
(Source: U.S. Bureau of Labor Statistics)
Energy
In September, the index of energy rose 1.3% – marking the fourth consecutive monthly increase in percentage. Gas prices increased 1.2% over the month (the gasoline index increased 0.3% in September before seasonal adjustment). Likewise, the indexes for electricity and natural gas both increased – 0.8% and 2.7%, respectively.
Over the last 12 months, the index for energy skyrocketed by 24.8%. Since this time last year, the price of gas has increased an astounding 42.1%. The US Bureau of Labor Statistics reported that “all the major energy component indexes increased” in percentage.
Food
The food index 0.9% for the month. There were percentage increases in all the major composite indexes for grocery store food.
“The index for meats, poultry, fish, and eggs rose 2.2% over the month as the index for beef rose 4.8%. The index for other food at home increased 1.1% in September after rising 0.6% in August. The index for nonalcoholic beverages increased 1.2% in September, its fourth consecutive monthly increase. The index for fruits and vegetables rose 0.6% in September, a larger increase than the 0.2% increase reported in August. The index for cereals and bakery products increased 1.1% over the month, while the index for dairy and related products rose 0.7%,” stated the US Bureau of Labor Statistics.
Over the last 12-month span, the food at home index rose 4.5%. All six of the component grocery store food group indexes saw percentage increases, with the index for meats, poultry, fish, and eggs rising 10.5%. The beef index increased 17.6% over the same period.
(Source: U.S. Bureau of Labor Statistics)
All Items Less Food and Energy
In September, the index for all items less food and energy saw a slight increase of 0.2%. Several of the component indexes all saw increases over the month including the shelter index by 0.4%, likewise, the index for owners’ equivalent rent rose 0.4%, and the rent index edged up 0.5%.
“In contrast to these increases, several indexes declined in September. The index for airline fares continued to fall sharply, decreasing 6.4% over the month after falling 9.1% in August. The apparel index also decreased in September, declining 1.1% over the month after rising 0.4% in the previous month. The index for used cars and trucks fell 0.7% this month, continuing to decline after it decreased 1.5% in August.
The index for all items less food and energy rose 4.0% over the past 12 months. The index for used cars and trucks increased 24.4% over the span. The index for new vehicles rose 8.7%, the largest 12-month increase since the period ending September 1980. The shelter index increased 3.2% over the last 12 months, and the household furnishings and operations index rose 5.1%. The index for medical care rose 0.4% over the last year, with the index for physicians’ services rising 3.8% and the index for hospital services increasing 3.2%. The prescription drugs index fell 1.6%, one of the few indexes to show a 12-month decline,” explained the US Bureau of Labor Statistics in its report.
Source cited: https://www.bls.gov/news.release/archives/cpi_10132021.htm
by Sarah Bauder | Sep 17, 2021 | CPI
The Consumer Price Index for All Urban Consumers (CPI-U) edged up 0.3% in August on a seasonally adjusted basis, reported the US Bureau of Labor Statistics. In July, it had increased 0.5%.
“The indexes for gasoline, household furnishings and operations, food, and shelter all rose in August and contributed to the monthly all items seasonally adjusted increase. The energy index increased 2.0%, mainly due to a 2.8% increase in the gasoline index. The index for food rose 0.4%, with the indexes for food at home and food away from home both increasing 0.4%.
The index for all items less food and energy rose 0.1% in August, its smallest increase since February 2021. Along with the indexes for household operations and shelter, the indexes for new vehicles, recreation, and medical care also rose in August. The indexes for airline fares, used cars and trucks, and motor vehicle insurance all declined over the month.”
(Source: U.S. Bureau of Labor Statistics)
Food Index
The index for food edged up 0.4% for August, as did the index for food away from home. The index for food at home likewise increased 0.4% for the month. Four of the six major grocery store category indexes all saw percentage increases over the month.
Over the last 12-month period, the food at home index rose 3%. Five of the six component grocery store food group indexes saw percentage rises.
“The largest increase was the index for meats, poultry, fish, and eggs, which increased 8.0 percent as the index for beef rose 12.2 percent over the year. The only group to decline was dairy and related products, which fell 0.5 percent over the last 12 months. The index for food away from home rose 4.7 percent over the last year,” said the Bureau for Labor Statistics.
(Source: U.S. Bureau of Labor Statistics)
Energy
In August, the index of energy rose 3% – marking the third consecutive monthly increase in percentage. The index for gasoline rose 2.8% over the month. Both the indexes for electricity and natural gas increased – with 1%, and 1.6%, respectively.
Overall, energy soared 25% in the last 12-month span. The price of gas leapt an astounding 42.7%.
“The index for electricity increased 5.2 percent, its largest 12-month increase since the period ending March 2014. The index for natural gas rose 21.1 percent over the last 12 months, the largest increase since the period ending August 2008,” said the bureau in its report.
All Items Less Food and Energy
In August, the index for all items less food and energy crept up 0.1%. Several of the component indexes all saw increases over the month including the shelter index by 0.2%, the indexes for rent and owners’ equivalent rent both rose 0.3% in August.
“In contrast to these increases, several indexes declined in August. The index for airline fares fell sharply, decreasing 9.1 percent over the month. The index for used cars and trucks declined 1.5 percent in August, ending a series of five consecutive monthly increases. The index for motor vehicle insurance fell 2.8 percent in August, the same decline as in July.
The index for all items less food and energy rose 4.0 percent over the past 12 months. The index for used cars and trucks increased 31.9 percent over the span. The index for new vehicles rose 7.6 percent, the largest 12-month increase since the period ending June 1981. The shelter index increased 2.8 percent over the last 12 months, and the medical care index rose 0.4 percent. The index for physicians’ services rose 3.9 percent and the index for hospital services increased 3.5 percent. The prescription drugs index fell 2.7 percent, one of the few indexes to show a 12-month decline,” explained the Bureau of Labor Statistics.
Source cited: https://www.bls.gov/news.release/archives/cpi_09142021.htm
by Sarah Bauder | Aug 11, 2021 | CPI
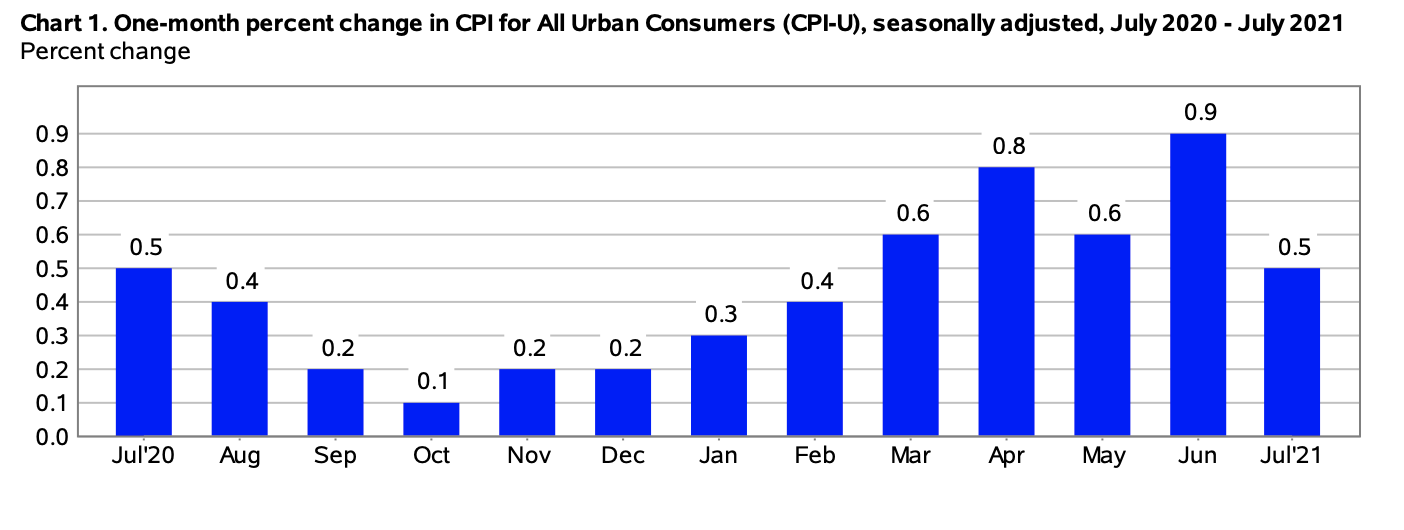
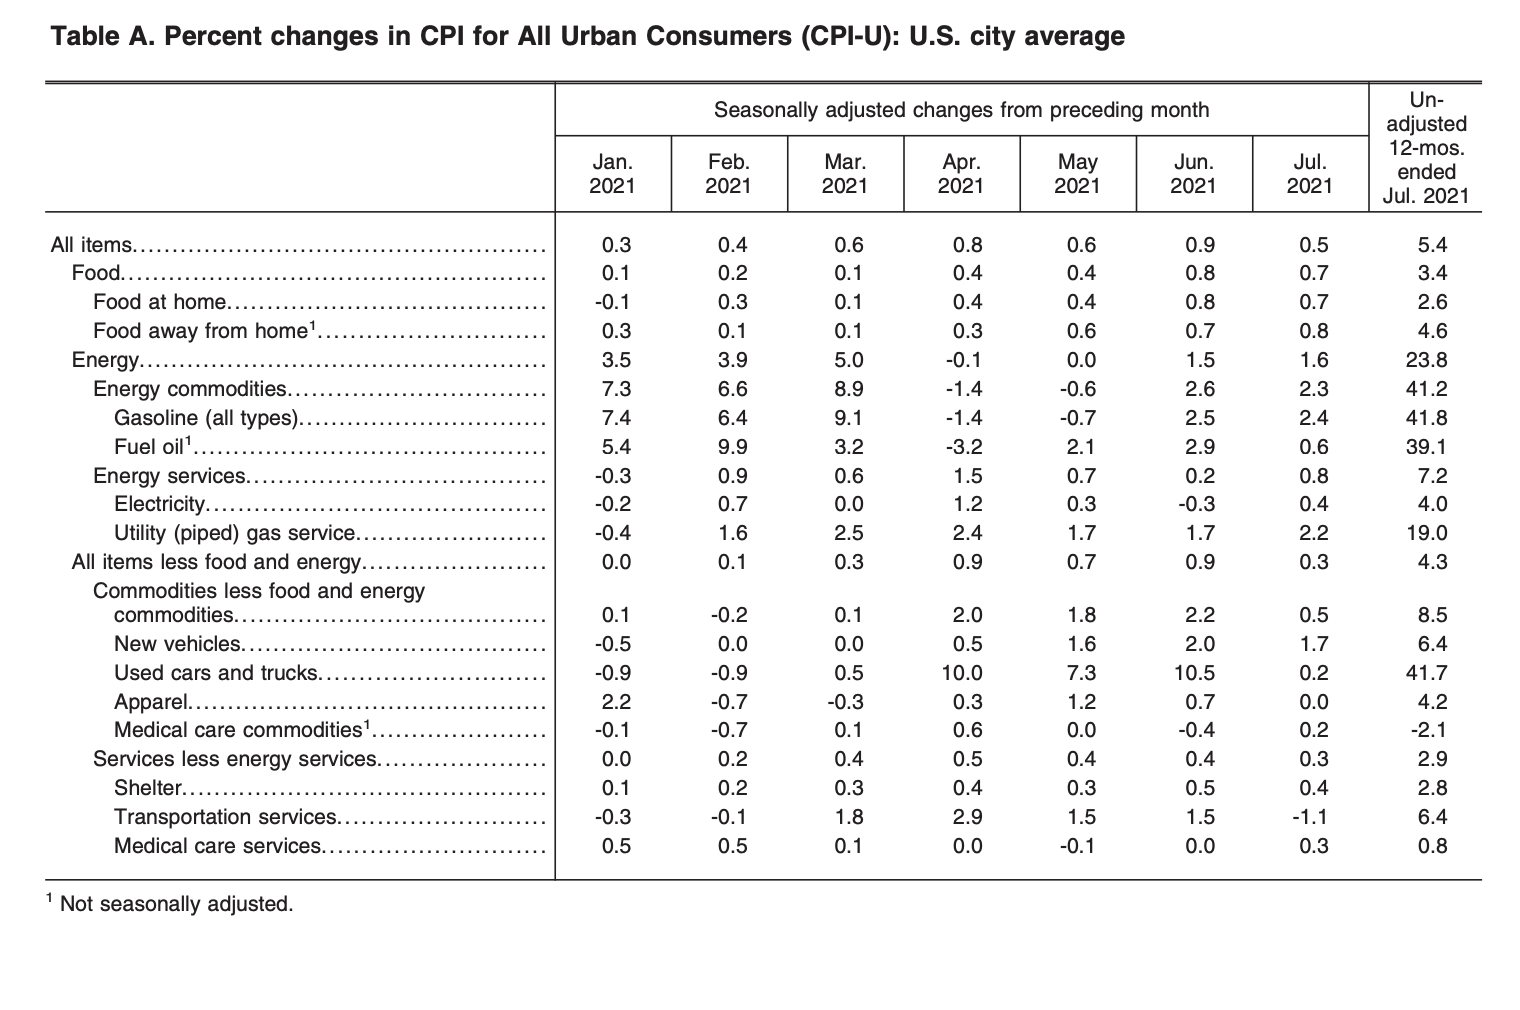
The Consumer Price Index for All Urban Consumers (CPI-U) edged up 0.5% in July on a seasonally adjusted basis, reported the U.S. Bureau of Labor Statistics. Before seasonal adjustment, the all items index rose 5.4% since this time last year.
(Source: U.S. Bureau of Labor Statistics)
Energy Index
In July, the index for energy rose 1.6%. The price of gasoline increased 2.4% for the month. “Before seasonal adjustment, gasoline prices rose 2.5 in July,” reported the bureau.
The indexes for electricity and natural gas both increased in July – 0.4% and 2.2%, respectively.
Over the last 12-month period, the energy index soared 23.8%.
“The gasoline index rose 41.8% since July 2020. The index for natural gas rose 19% over the last 12 months, while the index for electricity increased 4.0%,” stated the U.S. Bureau of Labor Statistics.
Food Index
The index for food edged up 0.7% for the month. The food at home index rose 0.7%, while the food away from home index rose 0.8% – “its largest monthly increase since February 1981”.
“The food at home index increased 2.6% over the past 12 months. All six major grocery store food group indexes rose over the span, with increases ranging from 1.1% (nonalcoholic beverages) to 5.9% (meats, poultry, fish, and eggs). The index for food away from home rose 4.6% over the last year. The index for limited-service meals rose 6.6% over the last 12 months, and the index for full-service meals rose 4.3%. Both 12-month increases were the largest in the history of the respective series, which were first published in 1998,” explained the bureau in its report.
(Source: U.S. Bureau of Labor Statistics)
All Items Less Food and Energy
The all items less food and energy index increased 0.3% for the month – “, its smallest monthly increase in 4 months” reported the bureau. Several component indexes saw percentage increases in July including the shelter index by 0.4%, the owners’ equivalent rent index by 0.3%, and the rent index by 0.2%.
Over the last 12-month period the all items less food and energy index increased 4.3%.
“The index for used cars and trucks increased 41.7% over the span. The index for new vehicles rose 6.4%, the largest 12-month increase since the period ending January 1982. The shelter index increased 2.8% over the last 12 months, and the medical care index rose only 0.3%. Few major component indexes declined over the past 12 months,” explained the U.S. Bureau of Labor Statistics.
The U.S. Bureau of Labor Statistics released the following with its report:
“Coronavirus (COVID-19) Pandemic Impact on July 2021 Consumer Price Index Data
Data collection by personal visit for the Consumer Price Index (CPI) program has been suspended since March 16, 2020. When possible, data normally collected by personal visit were collected either online or by phone. Additionally, data collection in July was affected by the temporary closing or limited operations of certain types of establishments. These factors resulted in an increase in the number of prices considered temporarily unavailable and imputed. While the CPI program attempted to collect as much data as possible, many indexes are based on smaller amounts of collected prices than usual, and a small number of indexes that are normally published were not published this month. Additional information is available at www.bls.gov/covid19/effects-of-covid-19-pandemic-on-consumer-price-index.htm.”
Source cited: https://www.bls.gov/news.release/archives/cpi_08112021.htm
by Sarah Bauder | Jul 13, 2021 | CPI, Definitions
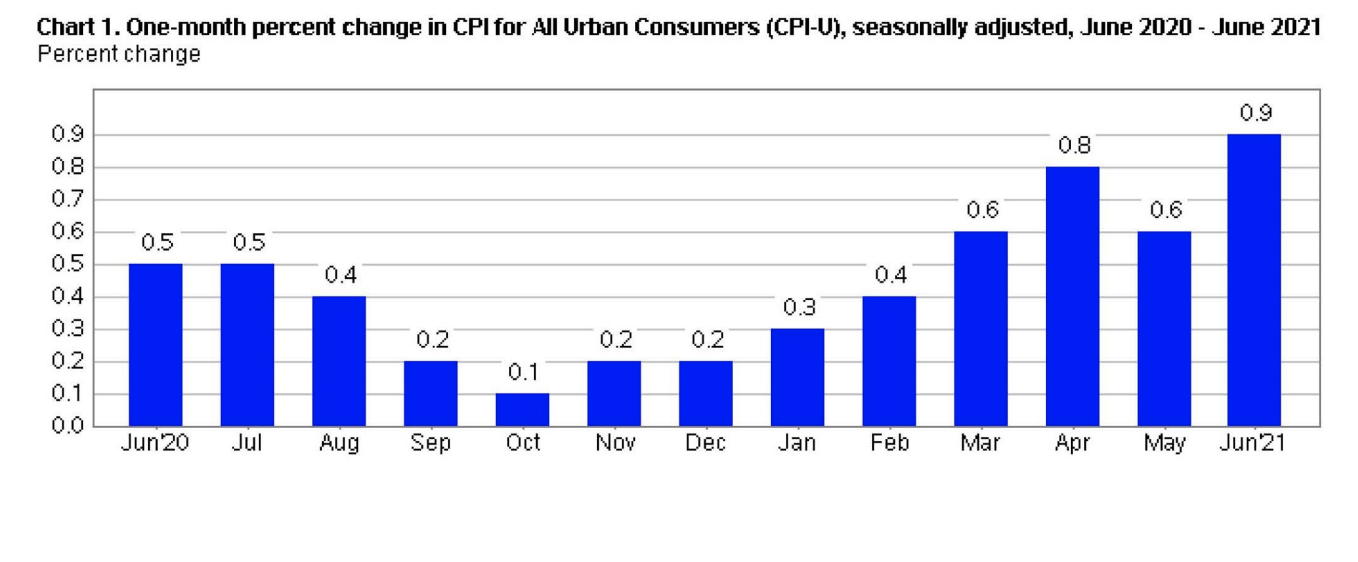
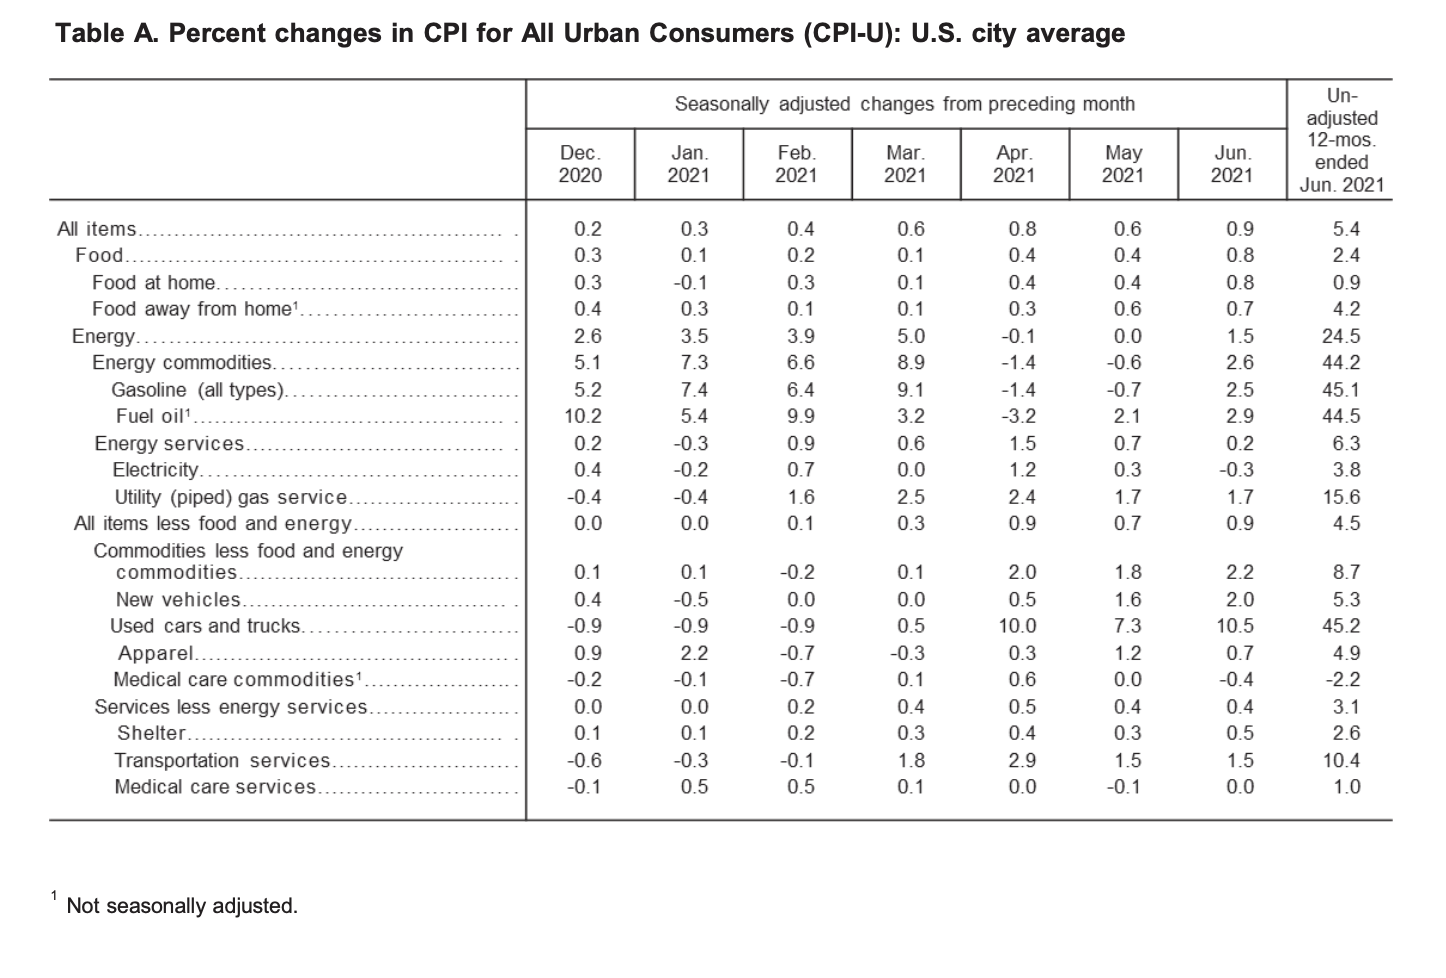
The Consumer Price Index for All Urban Consumers (CPI-U) edged up 0.9% in June on a seasonally adjusted basis, reported the US Bureau of Labor Statistics. In May, it had increased 0.6%.
“This was the largest 1-month change since June 2008 when the index rose 1%. Over the last 12 months, the all items index increased 5.4% before seasonal adjustment; this was the largest 12-month increase since a 5.4% increase for the period ending August 2008.” explained the bureau in its report.
(Source: U.S. Bureau of Labor Statistics)
Food
The index for food edged up 0.8% for the month. The index for food at home likewise increased 0.8% in June. Five of the six major grocery store category indexes all saw percentage increases over the month including the fruits and vegetables index by 0.7%, the index for meats, poultry, fish, and eggs by 2.5%, and the index for beef by 4.5%. The index for food away from home edged up 0.7% in June.
Over the last 12-month period, the food at home index rose 0.9%. All six of the component grocery store food group indexes saw percentage increases, with the fruits and vegetables index having the largest rise at 3.2%.
“The index for food away from home rose 4.2% over the last year, the largest 12-month increase in that index since the period ending in May 2009,” stated the US Bureau of Labor Statistics.
Energy
In June, the index of energy rose 1.5%. The index for gasoline rose 2.5% over the month. The price of gas increased 2.2%, prior to season adjustment. The natural gas index likewise increased 1.7%. Conversely, the index for electricity dropped 0.3% in June, after rising by 0.3% in May.
Since this time last year, the index for energy soared 24.5%. Over the last 12-month period, gas prices skyrocketed 45.1%. Likewise, the natural gas index increased 15.6%, and the electricity index rose 3.8% since this time last year.
(Source: U.S. Bureau of Labor Statistics)
All Items Less Food and Energy
In June, the index for all items less food and energy increased 0.9%. Several of the component indexes all saw increases over the month including the shelter index by 0.5%, the index for owners’ equivalent rent rose 0.3%, and the rent index edged up 0.2%.
“The index for used cars and trucks rose sharply for the third consecutive month, increasing 10.5% in June. This was the largest monthly increase ever reported for the used cars and trucks index, which was first published in January 1953,” explained the bureau in its report.
Over the last 12 month period, the all items less food and energy index increased 4.5%.
“The index for used cars and trucks increased 45.2%, the largest 12-month change ever reported for that index. The index for new vehicles rose 5.3% over the past 12 months, its largest 12-month increase since the period ending January 1987. The motor vehicle insurance index increased 11.3% in the last year, while the index for car and truck rental rose 87.7% over that period. The shelter index increased 2.6% over the last 12 months. The medical care index rose 0.4% over the past 12 months, its smallest 12-month increase since the period ending March 1941,” reported the US Bureau of Labor Statistics.
Source cited: https://www.bls.gov/news.release/archives/cpi_07132021.htm
by Sarah Bauder | Jun 10, 2021 | CPI
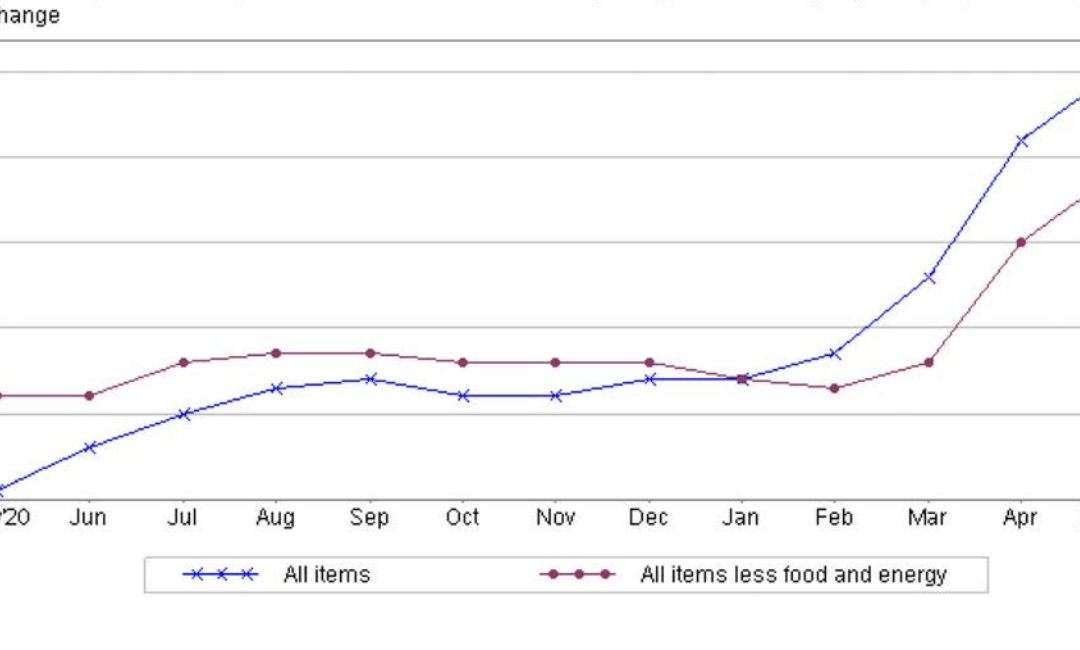
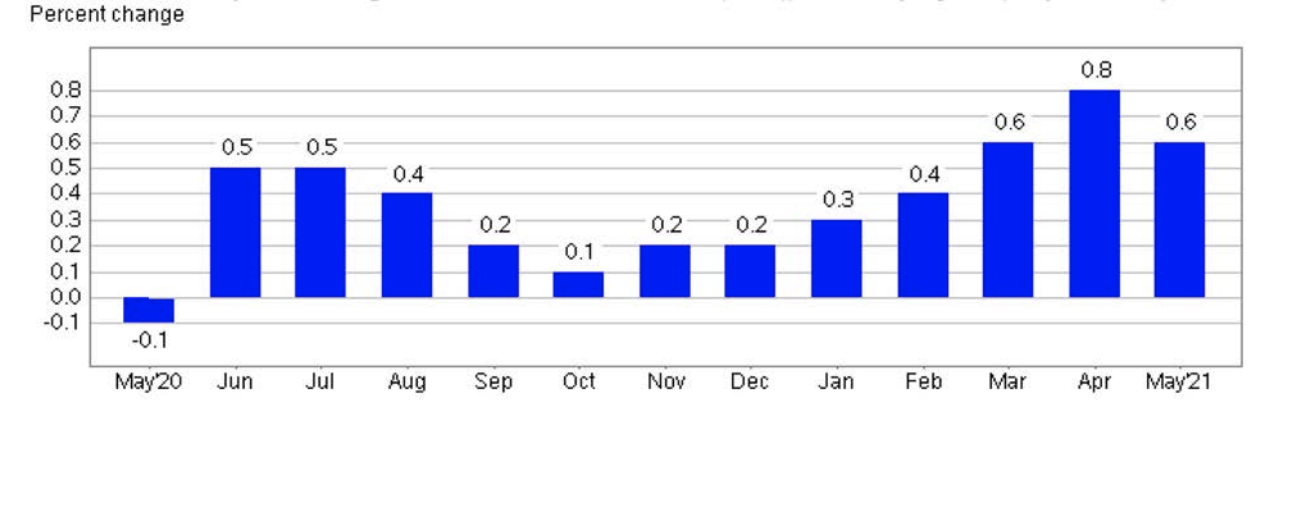
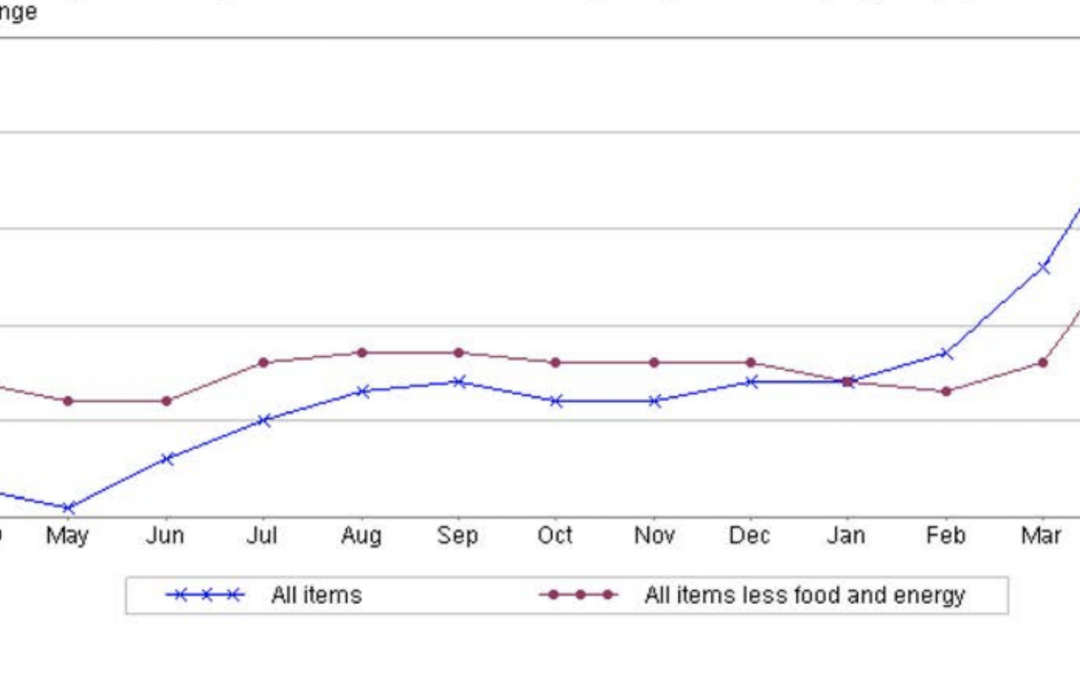
The Consumer Price Index for All Urban Consumers (CPI-U) rose 0.6% in May, on a seasonally adjusted basis, reported the US Bureau of Labor Statistics. Before seasonal adjustment, the all items index rose by 5%, over the past 12 month period.
“This was the largest 12-month increase since a 5.4% increase for the period ending August 2008”, stated the bureau in its report.
(Source: U.S. Bureau of Labor Statistics)
Food Index
The index for food edged up 0.4% in May. The food at home index rose 0.4%, and the food away from home index also increased 0.6%. The contributing factor for “the May increase was mostly due to the index for meats, poultry, fish, and eggs, which increased 1.3% over the month,” explained the bureau.
Over the last 12-month period, the food at home index rose 0.7%, while the food away from home index increased 4% over the same timeframe.
“Five of the six major grocery store food group indexes increased, but the index for fruits and vegetables was the only one to rise more than 0.6 percent; it increased 2.9%. The only index to decline was nonalcoholic beverages, which fell 0.2% over the last 12 months,” stated the Bureau of Labor Statistics.
Energy Index
The bureau reported that the index for energy remained unchanged in May, after a decrease seen in April.
“As in April, the gasoline index fell, while other energy component indexes increased. The gasoline index declined 0.7% in May after falling 1.4% in April,” explained the bureau.
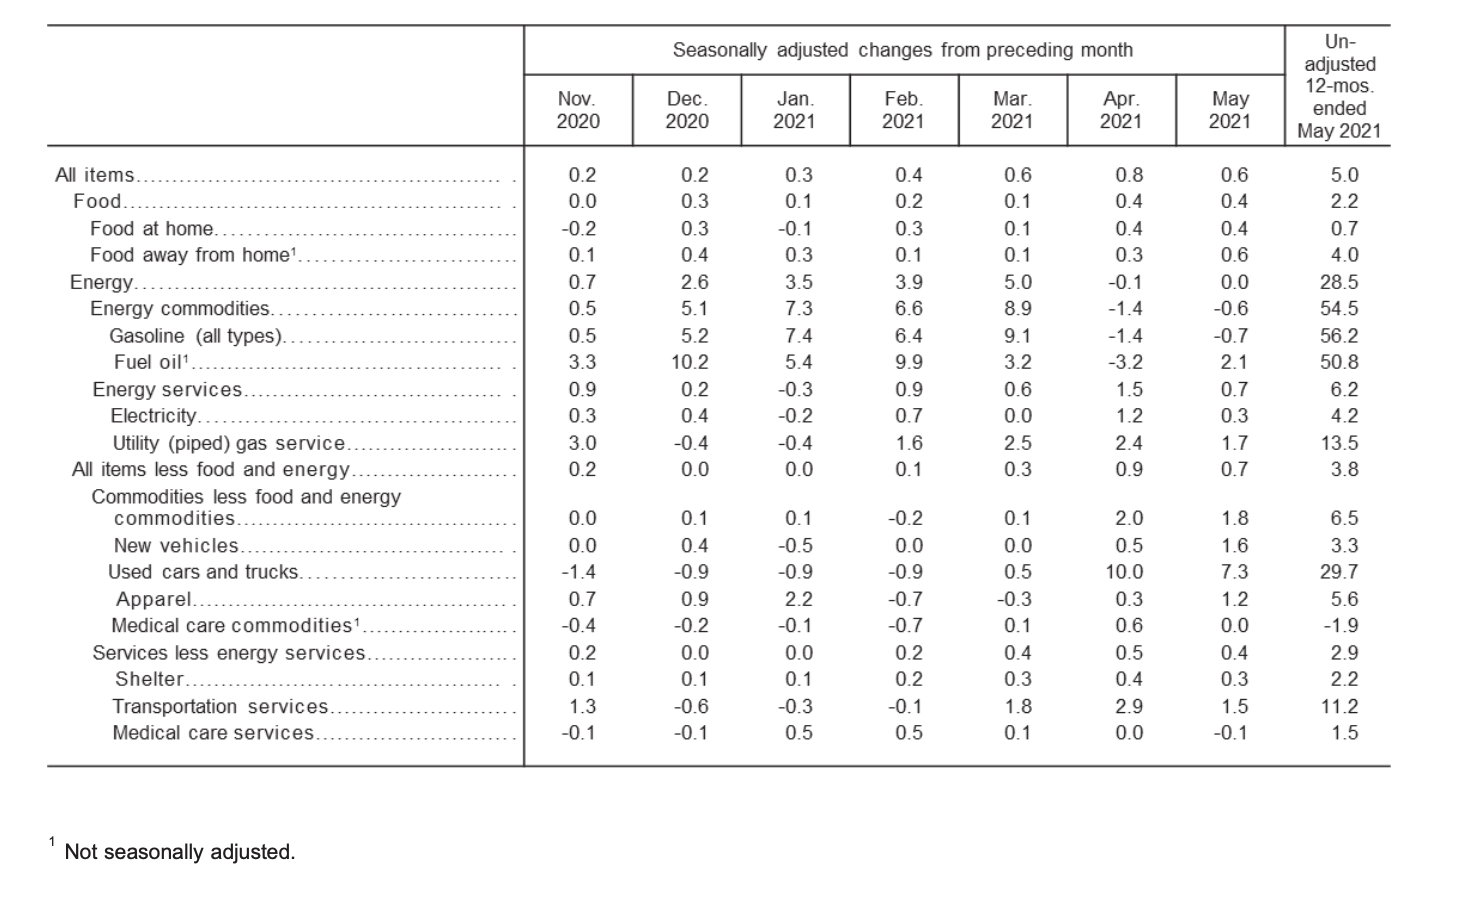
The electricity index rose 0.3% in May, and the natural gas index rose 1.7%. Over the last year, the index for energy increased by 28.5%. Gas prices soared 56.2% over the past 12-month span.
“The May 2021 increase was the largest 12-month increase since the period ending April 1980,” stated the bureau in its report.
Since this time last year, the electricity index rose 4.2%, and the natural gas index saw an increase of 13.5%.
(Source: U.S. Bureau of Labor Statistics)
All Items Less Food and Energy
In May, the index for all items less food and energy increased by 0.7%. Several of the component indexes all saw percentage increases for the month including the shelter index by 0.3%, the rent index by 0.2%, the index for owners’ equivalent rent by 0.3%, and the used cars and trucks by 7.3%.
Over the last 12 month period, the all items less food and energy index increased 3.8%. The index for shelter rose 2.2%, and the used cars and trucks index soared 29.7%.
In its report, the US Bureau of Labor Statistics included a statement regarding the impact of the COVID-19 pandemic on May 2021 CPI data collection:
“Data collection by personal visit for the Consumer Price Index (CPI) program has been suspended since March 16, 2020. When possible, data normally collected by personal visit were collected either online or by phone. Additionally, data collection in May was affected by the temporary closing or limited operations of certain types of establishments. These factors resulted in an increase in the number of prices considered temporarily unavailable and imputed. While the CPI program attempted to collect as much data as possible, many indexes are based on smaller amounts of collected prices than usual, and a small number of indexes that are normally published were not published this month.”
Source cited: https://www.bls.gov/news.release/archives/cpi_06102021.htm
by Sarah Bauder | May 12, 2021 | CPI
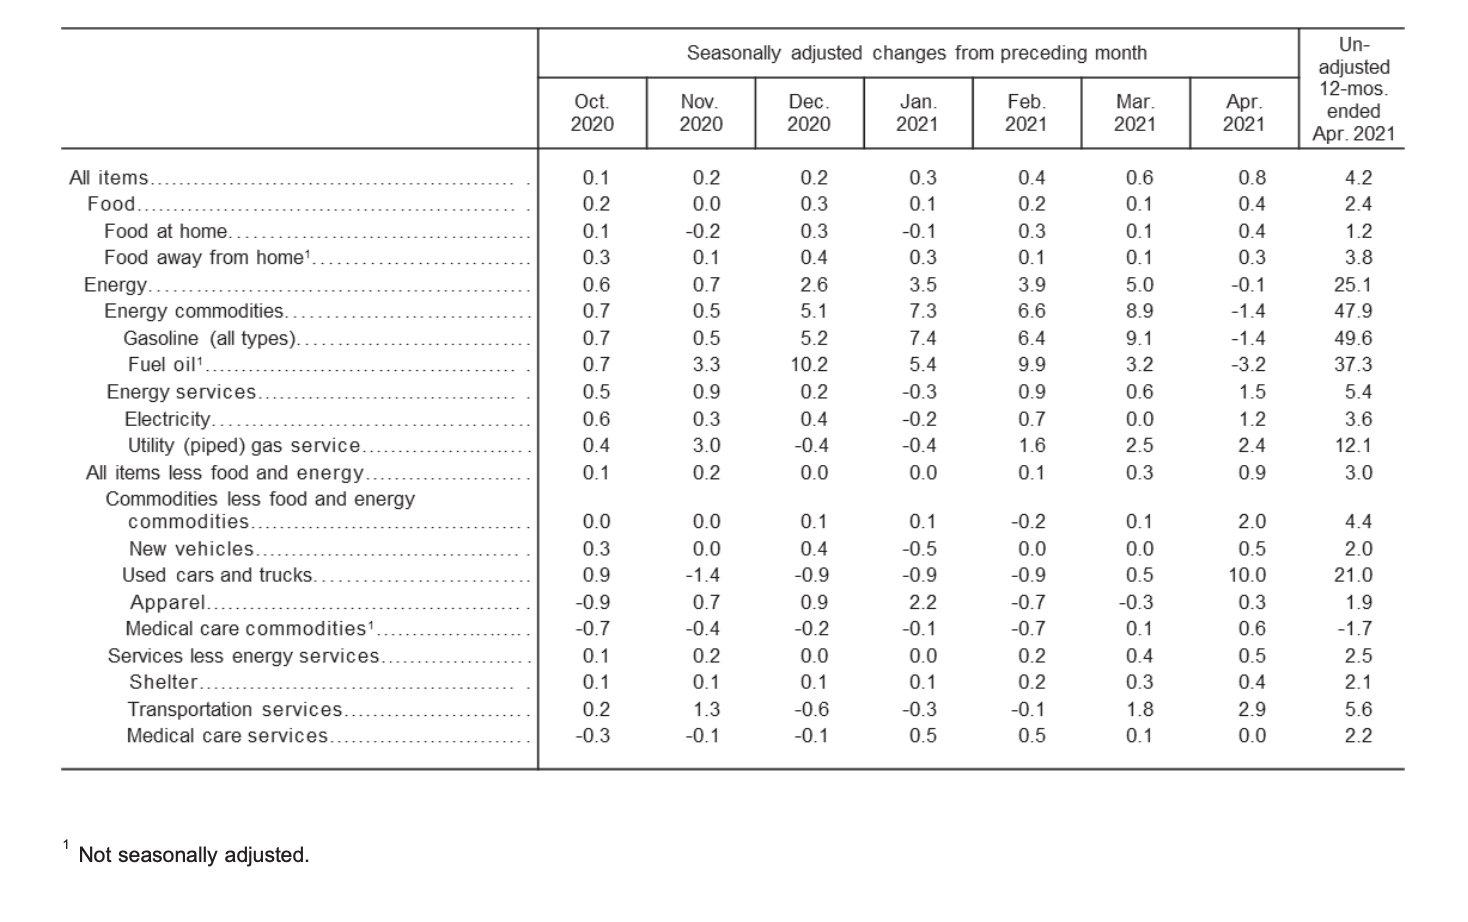
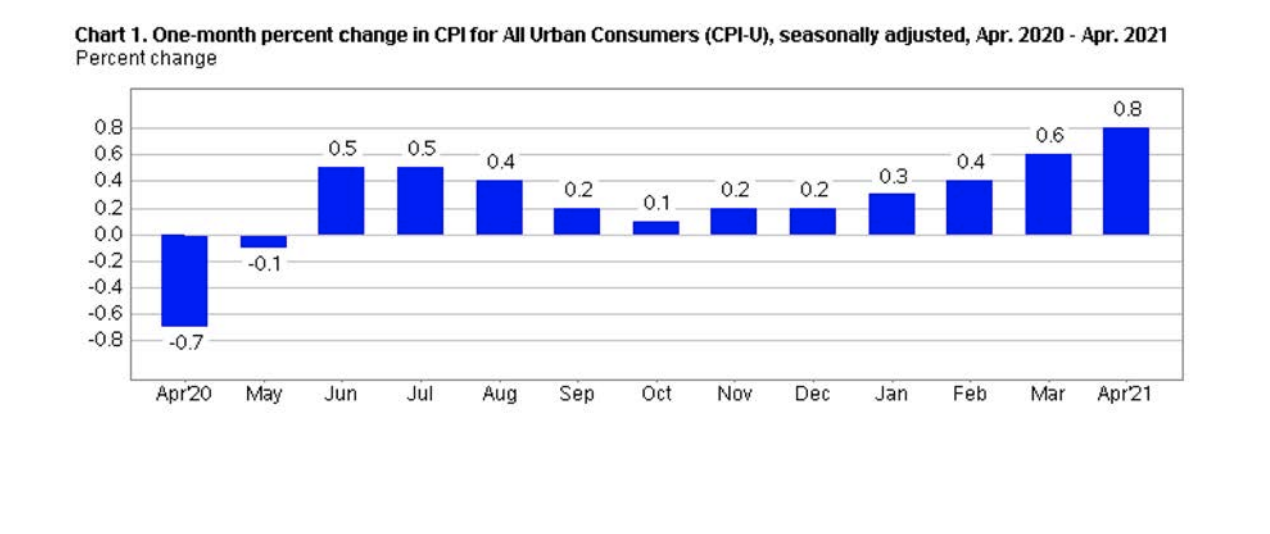
The Consumer Price Index for All Urban Consumers (CPI-U) edged up 0.8% in April on a seasonally adjusted basis, reported the U.S. Bureau of Labor Statistics. Before seasonal adjustment, the all items index rose 4.2% in the last 12-month period.
“This is the largest 12-month increase since a 4.9-percent increase for the period ending September 2008,” explained the bureau.
(Source: U.S. Bureau of Labor Statistics)
Energy Index
The index for energy dropped by 0.1% in April, “after rising in each of the last 10 months” stated the bureau in its monthly report. The price of gas declined 1.4%, also after seeing a similar rise over the last 10 consecutive months.
Conversely, other energy indexes experienced percentage increases. The indexes for electricity and natural gas both rose 1.2% and 2.4%, respectively.
Over the last 12-month period, the index for energy soared 25.1%. The price of gas skyrocketed an astounding 49.6% since this time last year. The U.S. Bureau of Labor Statistics stated that this marked the “largest 12-month increase since the period ending January 2010”. The natural gas index rose 12.1% and the electricity index increased 3.6% over the past 12 months.
Food Index
In April, the index for food edged up 0.4%. The food at home index rose 0.4% for the month, with all six grocery store food group indexes seeing a rise in percentage. The index for fruits and vegetables increased 0.8%, and the fresh fruit index edged up 1.5%. Likewise, the food away from home index also increased 0.3% for the month.
Over the last 12-month span, the food at home index rose 1.2%. as did the index for food away from home by 3.8%.
(Source: U.S. Bureau of Labor Statistics)
All Items Less Food and Energy Index
The all items less food and energy index edged up 0.9% for the month, reported the bureau. Several component indexes saw percentage rises including the index for shelter by 0.4%, with the owners’ equivalent rent index and the rent index both rising 0.2%, respectively.
“The index for all items less food and energy rose 3.0% over the past 12 months; this was its largest 12-month increase since January 1996. Indexes with large 12-month increases include used cars and trucks (21%) and airline fares (9.6%). The shelter index increased 2.1% over the last 12 months, and the medical care index rose 1.5%,” stated the U.S. Bureau of Labor Statistics in its report.
The US Bureau of Labor Statistics released a statement regarding the impact of the COVID-19 pandemic on the collection of data for April 2021:
“Data collection by personal visit for the Consumer Price Index (CPI) program has been suspended since March 16, 2020. When possible, data normally collected by personal visit were collected either online or by phone. Additionally, data collection in April was affected by the temporary closing or limited operations of certain types of establishments. These factors resulted in an increase in the number of prices considered temporarily unavailable and imputed. While the CPI program attempted to collect as much data as possible, many indexes are based on smaller amounts of collected prices than usual, and a small number of indexes that are normally published were not published this month. Additional information is available at www.bls.gov/covid19/effects-of-covid-19-pandemic-on-consumer-price-index.htm.”
Source cited: https://www.bls.gov/news.release/archives/cpi_05122021.htm

