-v3")

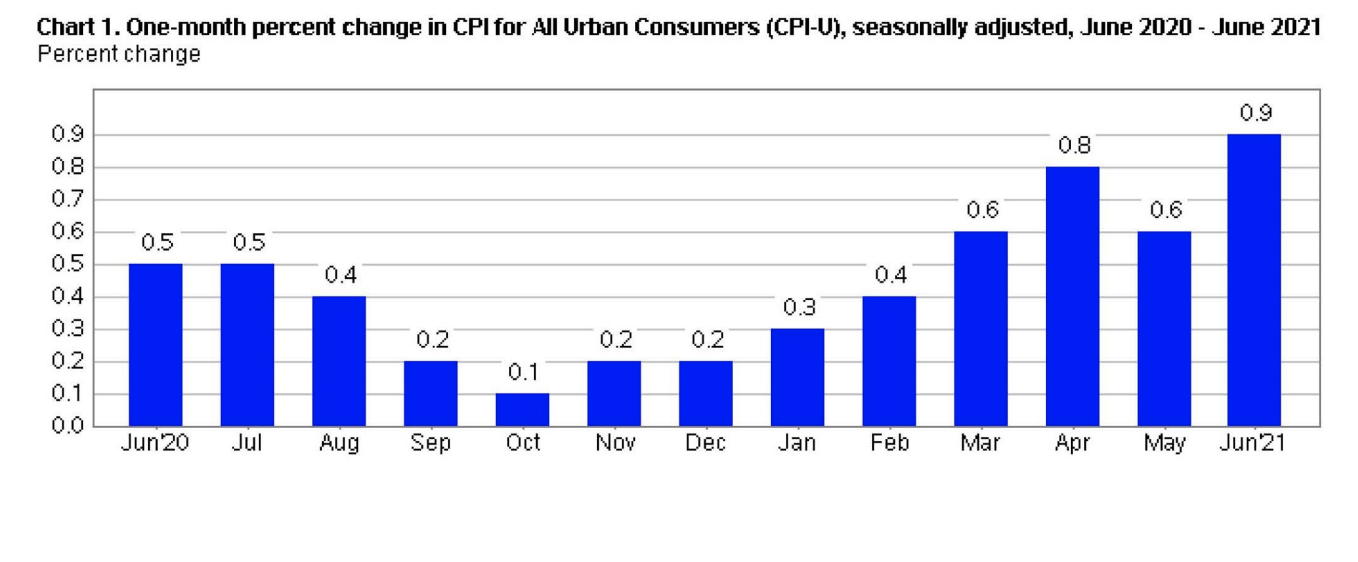
The Consumer Price Index for All Urban Consumers (CPI-U) edged up 0.9% in June on a seasonally adjusted basis, reported the US Bureau of Labor Statistics. In May, it had increased 0.6%.
“This was the largest 1-month change since June 2008 when the index rose 1%. Over the last 12 months, the all items index increased 5.4% before seasonal adjustment; this was the largest 12-month increase since a 5.4% increase for the period ending August 2008.” explained the bureau in its report.
(Source: U.S. Bureau of Labor Statistics)
Food
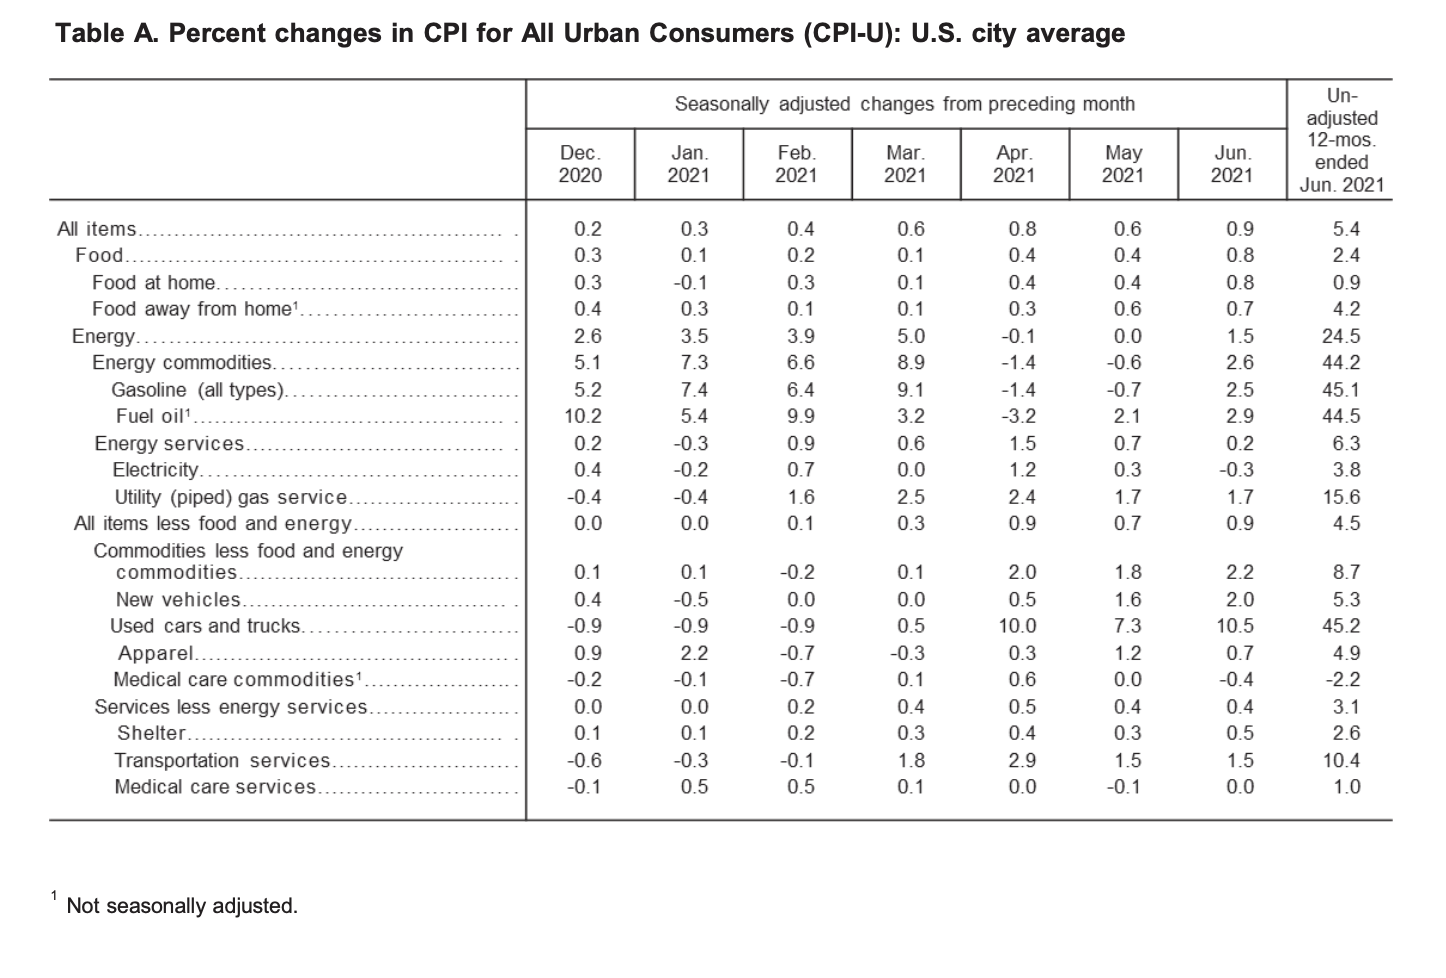
The index for food edged up 0.8% for the month. The index for food at home likewise increased 0.8% in June. Five of the six major grocery store category indexes all saw percentage increases over the month including the fruits and vegetables index by 0.7%, the index for meats, poultry, fish, and eggs by 2.5%, and the index for beef by 4.5%. The index for food away from home edged up 0.7% in June.
Over the last 12-month period, the food at home index rose 0.9%. All six of the component grocery store food group indexes saw percentage increases, with the fruits and vegetables index having the largest rise at 3.2%.
“The index for food away from home rose 4.2% over the last year, the largest 12-month increase in that index since the period ending in May 2009,” stated the US Bureau of Labor Statistics.
Energy
In June, the index of energy rose 1.5%. The index for gasoline rose 2.5% over the month. The price of gas increased 2.2%, prior to season adjustment. The natural gas index likewise increased 1.7%. Conversely, the index for electricity dropped 0.3% in June, after rising by 0.3% in May.
Since this time last year, the index for energy soared 24.5%. Over the last 12-month period, gas prices skyrocketed 45.1%. Likewise, the natural gas index increased 15.6%, and the electricity index rose 3.8% since this time last year.
(Source: U.S. Bureau of Labor Statistics)
All Items Less Food and Energy
In June, the index for all items less food and energy increased 0.9%. Several of the component indexes all saw increases over the month including the shelter index by 0.5%, the index for owners’ equivalent rent rose 0.3%, and the rent index edged up 0.2%.
“The index for used cars and trucks rose sharply for the third consecutive month, increasing 10.5% in June. This was the largest monthly increase ever reported for the used cars and trucks index, which was first published in January 1953,” explained the bureau in its report.
Over the last 12 month period, the all items less food and energy index increased 4.5%.
“The index for used cars and trucks increased 45.2%, the largest 12-month change ever reported for that index. The index for new vehicles rose 5.3% over the past 12 months, its largest 12-month increase since the period ending January 1987. The motor vehicle insurance index increased 11.3% in the last year, while the index for car and truck rental rose 87.7% over that period. The shelter index increased 2.6% over the last 12 months. The medical care index rose 0.4% over the past 12 months, its smallest 12-month increase since the period ending March 1941,” reported the US Bureau of Labor Statistics.
Source cited: https://www.bls.gov/news.release/archives/cpi_07132021.htm

Sarah has been writing on the topics of politics, history and finance for over a decade. She is currently an editor at CPI Inflation Calculator, covering the topics of CPI, inflation, US economy and economic commentary.
