-v3")

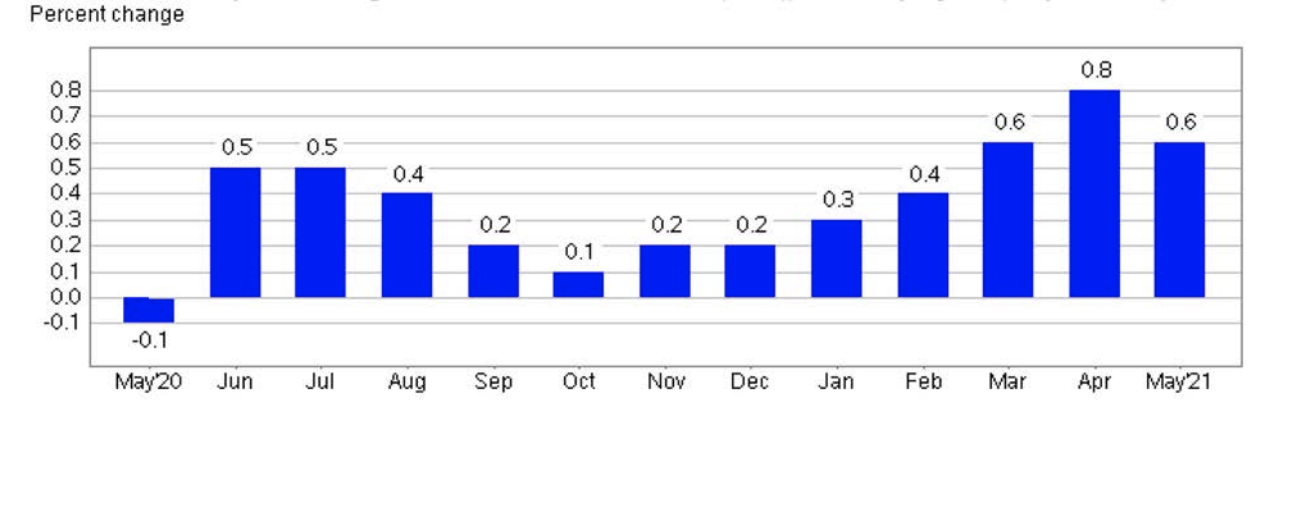
The Consumer Price Index for All Urban Consumers (CPI-U) rose 0.6% in May, on a seasonally adjusted basis, reported the US Bureau of Labor Statistics. Before seasonal adjustment, the all items index rose by 5%, over the past 12 month period.
“This was the largest 12-month increase since a 5.4% increase for the period ending August 2008”, stated the bureau in its report.
(Source: U.S. Bureau of Labor Statistics)
Food Index
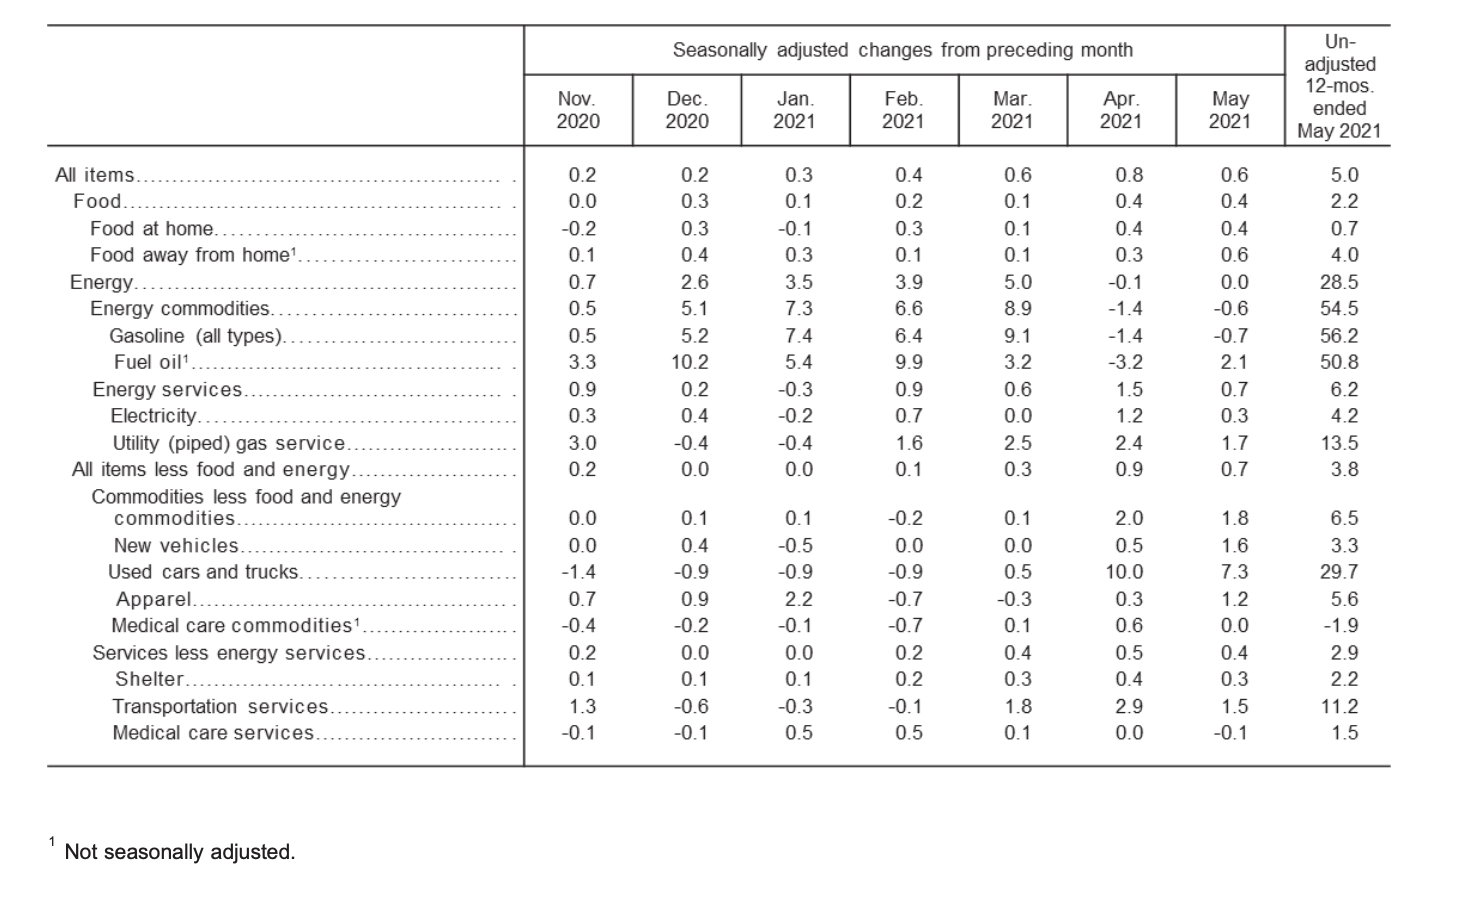
The index for food edged up 0.4% in May. The food at home index rose 0.4%, and the food away from home index also increased 0.6%. The contributing factor for “the May increase was mostly due to the index for meats, poultry, fish, and eggs, which increased 1.3% over the month,” explained the bureau.
Over the last 12-month period, the food at home index rose 0.7%, while the food away from home index increased 4% over the same timeframe.
“Five of the six major grocery store food group indexes increased, but the index for fruits and vegetables was the only one to rise more than 0.6 percent; it increased 2.9%. The only index to decline was nonalcoholic beverages, which fell 0.2% over the last 12 months,” stated the Bureau of Labor Statistics.
Energy Index
The bureau reported that the index for energy remained unchanged in May, after a decrease seen in April.
“As in April, the gasoline index fell, while other energy component indexes increased. The gasoline index declined 0.7% in May after falling 1.4% in April,” explained the bureau.
The electricity index rose 0.3% in May, and the natural gas index rose 1.7%. Over the last year, the index for energy increased by 28.5%. Gas prices soared 56.2% over the past 12-month span.
“The May 2021 increase was the largest 12-month increase since the period ending April 1980,” stated the bureau in its report.
Since this time last year, the electricity index rose 4.2%, and the natural gas index saw an increase of 13.5%.
(Source: U.S. Bureau of Labor Statistics)
All Items Less Food and Energy
In May, the index for all items less food and energy increased by 0.7%. Several of the component indexes all saw percentage increases for the month including the shelter index by 0.3%, the rent index by 0.2%, the index for owners’ equivalent rent by 0.3%, and the used cars and trucks by 7.3%.
Over the last 12 month period, the all items less food and energy index increased 3.8%. The index for shelter rose 2.2%, and the used cars and trucks index soared 29.7%.
In its report, the US Bureau of Labor Statistics included a statement regarding the impact of the COVID-19 pandemic on May 2021 CPI data collection:
“Data collection by personal visit for the Consumer Price Index (CPI) program has been suspended since March 16, 2020. When possible, data normally collected by personal visit were collected either online or by phone. Additionally, data collection in May was affected by the temporary closing or limited operations of certain types of establishments. These factors resulted in an increase in the number of prices considered temporarily unavailable and imputed. While the CPI program attempted to collect as much data as possible, many indexes are based on smaller amounts of collected prices than usual, and a small number of indexes that are normally published were not published this month.”
Source cited: https://www.bls.gov/news.release/archives/cpi_06102021.htm

Sarah has been writing on the topics of politics, history and finance for over a decade. She is currently an editor at CPI Inflation Calculator, covering the topics of CPI, inflation, US economy and economic commentary.
