-v3")

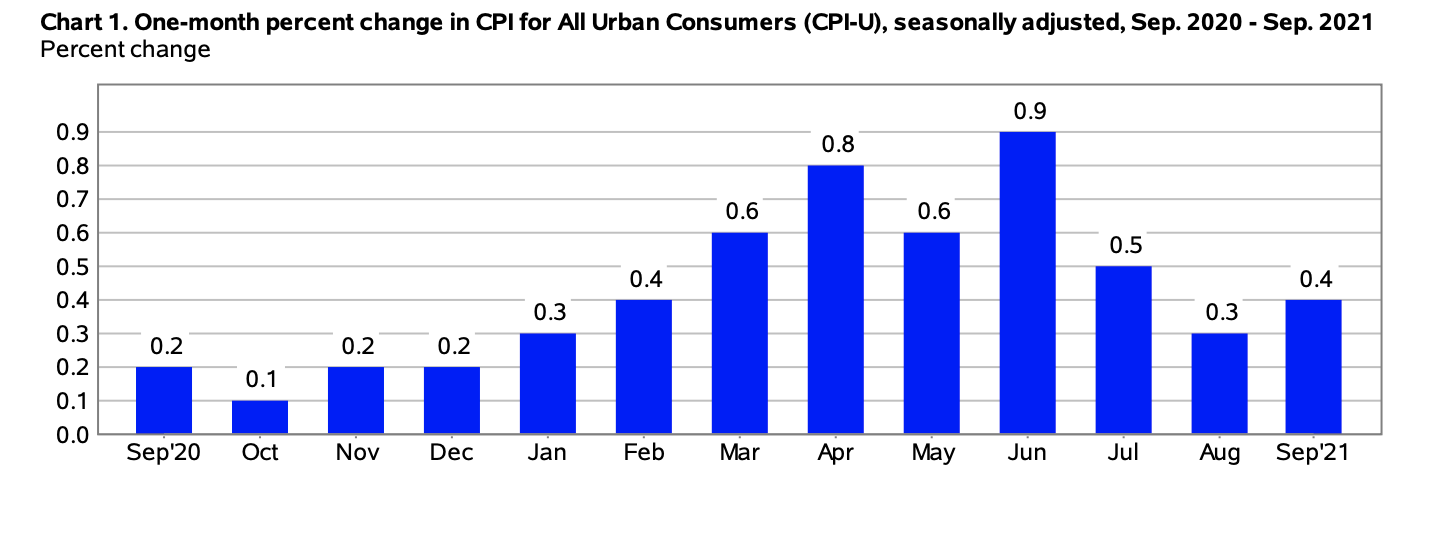
The Consumer Price Index for All Urban Consumers (CPI-U) rose 0.4% in September on a seasonally adjusted basis, reported the US Bureau of Labor Statistics. In August, it had increased by 0.3%. Over the last 12-month period, the index for all items increased by 5.4% prior to seasonal adjustment.
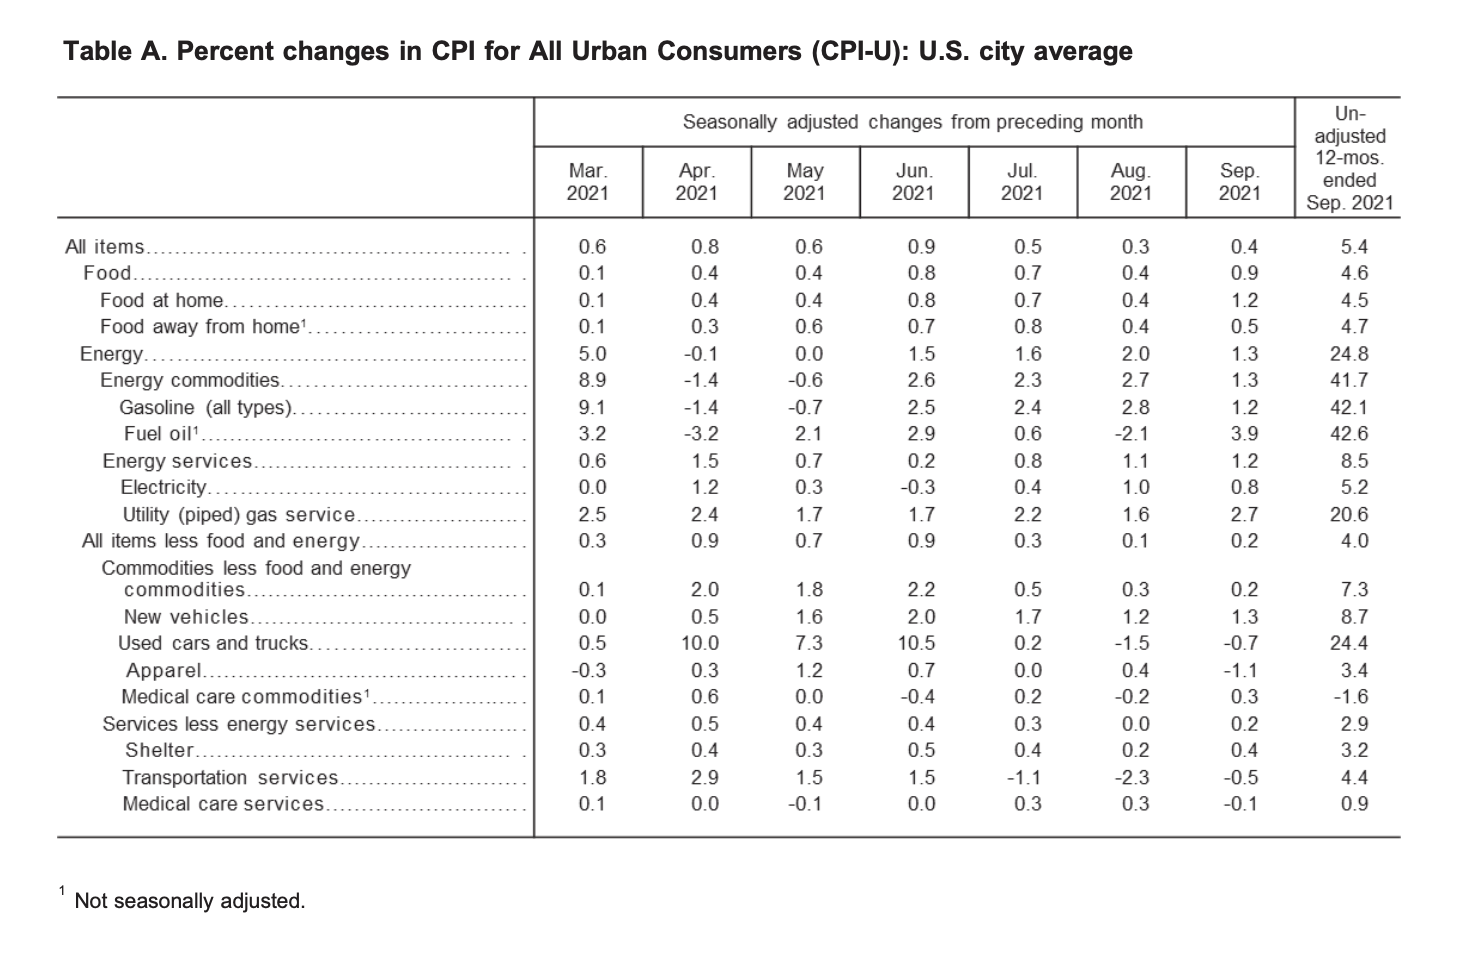
“The indexes for food and shelter rose in September and together contributed more than half of the monthly all items seasonally adjusted increase. The index for food rose 0.9 percent, with the index for food at home increasing 1.2 percent. The energy index increased 1.3 percent, with the gasoline index rising 1.2 percent.
The index for all items less food and energy rose 0.2 percent in September, after increasing 0.1 percent in August. Along with the index for shelter, the indexes for new vehicles, household furnishings and operations, and motor vehicle insurance also rose in September. The indexes for airline fares, apparel, and used cars and trucks all declined over the month,” reported the bureau.
(Source: U.S. Bureau of Labor Statistics)
Energy
In September, the index of energy rose 1.3% – marking the fourth consecutive monthly increase in percentage. Gas prices increased 1.2% over the month (the gasoline index increased 0.3% in September before seasonal adjustment). Likewise, the indexes for electricity and natural gas both increased – 0.8% and 2.7%, respectively.
Over the last 12 months, the index for energy skyrocketed by 24.8%. Since this time last year, the price of gas has increased an astounding 42.1%. The US Bureau of Labor Statistics reported that “all the major energy component indexes increased” in percentage.
Food
The food index 0.9% for the month. There were percentage increases in all the major composite indexes for grocery store food.
“The index for meats, poultry, fish, and eggs rose 2.2% over the month as the index for beef rose 4.8%. The index for other food at home increased 1.1% in September after rising 0.6% in August. The index for nonalcoholic beverages increased 1.2% in September, its fourth consecutive monthly increase. The index for fruits and vegetables rose 0.6% in September, a larger increase than the 0.2% increase reported in August. The index for cereals and bakery products increased 1.1% over the month, while the index for dairy and related products rose 0.7%,” stated the US Bureau of Labor Statistics.
Over the last 12-month span, the food at home index rose 4.5%. All six of the component grocery store food group indexes saw percentage increases, with the index for meats, poultry, fish, and eggs rising 10.5%. The beef index increased 17.6% over the same period.
(Source: U.S. Bureau of Labor Statistics)
All Items Less Food and Energy
In September, the index for all items less food and energy saw a slight increase of 0.2%. Several of the component indexes all saw increases over the month including the shelter index by 0.4%, likewise, the index for owners’ equivalent rent rose 0.4%, and the rent index edged up 0.5%.
“In contrast to these increases, several indexes declined in September. The index for airline fares continued to fall sharply, decreasing 6.4% over the month after falling 9.1% in August. The apparel index also decreased in September, declining 1.1% over the month after rising 0.4% in the previous month. The index for used cars and trucks fell 0.7% this month, continuing to decline after it decreased 1.5% in August.
The index for all items less food and energy rose 4.0% over the past 12 months. The index for used cars and trucks increased 24.4% over the span. The index for new vehicles rose 8.7%, the largest 12-month increase since the period ending September 1980. The shelter index increased 3.2% over the last 12 months, and the household furnishings and operations index rose 5.1%. The index for medical care rose 0.4% over the last year, with the index for physicians’ services rising 3.8% and the index for hospital services increasing 3.2%. The prescription drugs index fell 1.6%, one of the few indexes to show a 12-month decline,” explained the US Bureau of Labor Statistics in its report.
Source cited: https://www.bls.gov/news.release/archives/cpi_10132021.htm

Sarah has been writing on the topics of politics, history and finance for over a decade. She is currently an editor at CPI Inflation Calculator, covering the topics of CPI, inflation, US economy and economic commentary.
