-v3")

The Consumer Price Index for All Urban Consumers (CPI-U) edged up 0.5% in July on a seasonally adjusted basis, reported the U.S. Bureau of Labor Statistics. Before seasonal adjustment, the all items index rose 5.4% since this time last year.
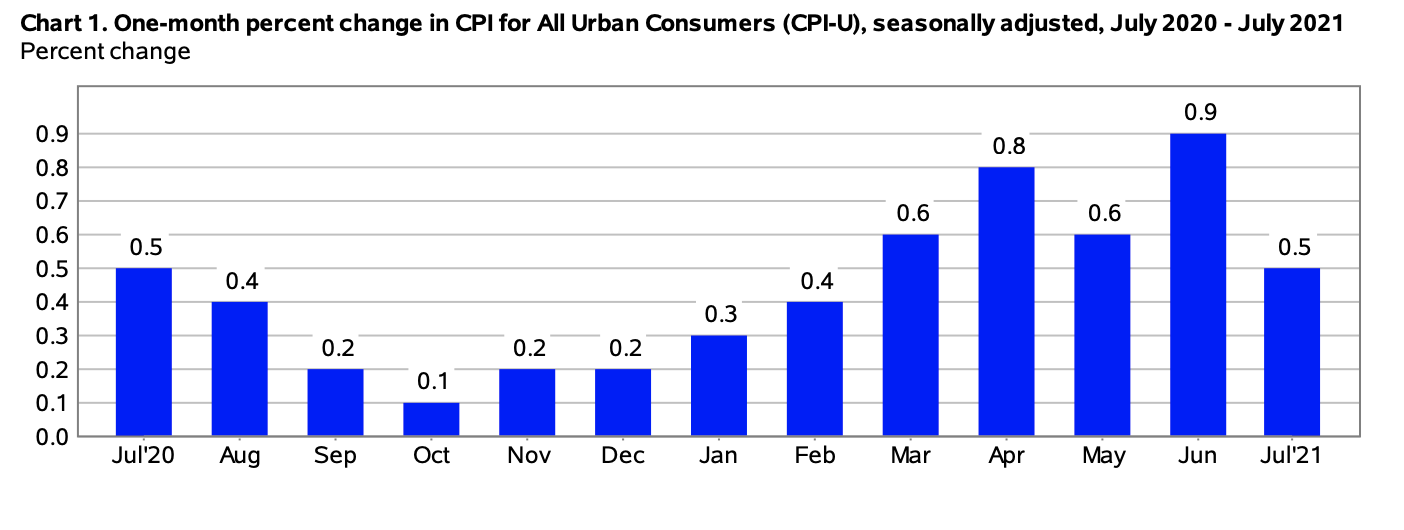
(Source: U.S. Bureau of Labor Statistics)
Energy Index
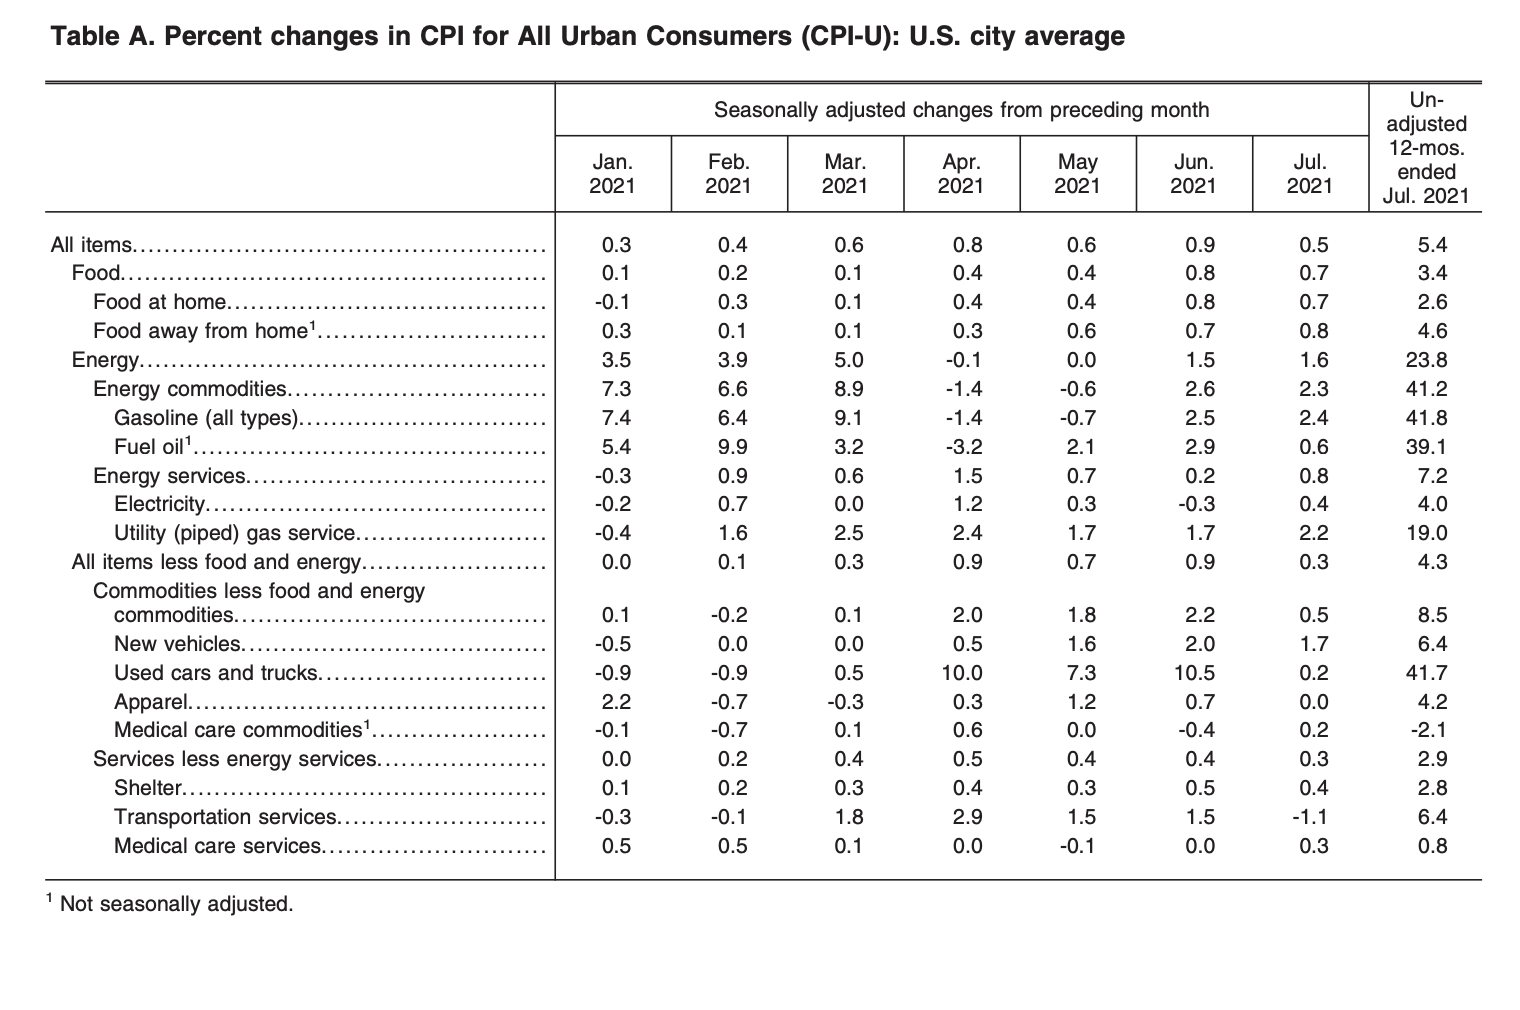
In July, the index for energy rose 1.6%. The price of gasoline increased 2.4% for the month. “Before seasonal adjustment, gasoline prices rose 2.5 in July,” reported the bureau.
The indexes for electricity and natural gas both increased in July – 0.4% and 2.2%, respectively.
Over the last 12-month period, the energy index soared 23.8%.
“The gasoline index rose 41.8% since July 2020. The index for natural gas rose 19% over the last 12 months, while the index for electricity increased 4.0%,” stated the U.S. Bureau of Labor Statistics.
Food Index
The index for food edged up 0.7% for the month. The food at home index rose 0.7%, while the food away from home index rose 0.8% – “its largest monthly increase since February 1981”.
“The food at home index increased 2.6% over the past 12 months. All six major grocery store food group indexes rose over the span, with increases ranging from 1.1% (nonalcoholic beverages) to 5.9% (meats, poultry, fish, and eggs). The index for food away from home rose 4.6% over the last year. The index for limited-service meals rose 6.6% over the last 12 months, and the index for full-service meals rose 4.3%. Both 12-month increases were the largest in the history of the respective series, which were first published in 1998,” explained the bureau in its report.
(Source: U.S. Bureau of Labor Statistics)
All Items Less Food and Energy
The all items less food and energy index increased 0.3% for the month – “, its smallest monthly increase in 4 months” reported the bureau. Several component indexes saw percentage increases in July including the shelter index by 0.4%, the owners’ equivalent rent index by 0.3%, and the rent index by 0.2%.
Over the last 12-month period the all items less food and energy index increased 4.3%.
“The index for used cars and trucks increased 41.7% over the span. The index for new vehicles rose 6.4%, the largest 12-month increase since the period ending January 1982. The shelter index increased 2.8% over the last 12 months, and the medical care index rose only 0.3%. Few major component indexes declined over the past 12 months,” explained the U.S. Bureau of Labor Statistics.
The U.S. Bureau of Labor Statistics released the following with its report:
“Coronavirus (COVID-19) Pandemic Impact on July 2021 Consumer Price Index Data
Data collection by personal visit for the Consumer Price Index (CPI) program has been suspended since March 16, 2020. When possible, data normally collected by personal visit were collected either online or by phone. Additionally, data collection in July was affected by the temporary closing or limited operations of certain types of establishments. These factors resulted in an increase in the number of prices considered temporarily unavailable and imputed. While the CPI program attempted to collect as much data as possible, many indexes are based on smaller amounts of collected prices than usual, and a small number of indexes that are normally published were not published this month. Additional information is available at www.bls.gov/covid19/effects-of-covid-19-pandemic-on-consumer-price-index.htm.”
Source cited: https://www.bls.gov/news.release/archives/cpi_08112021.htm

Sarah has been writing on the topics of politics, history and finance for over a decade. She is currently an editor at CPI Inflation Calculator, covering the topics of CPI, inflation, US economy and economic commentary.
