by Sarah Bauder | Apr 12, 2022 | CPI
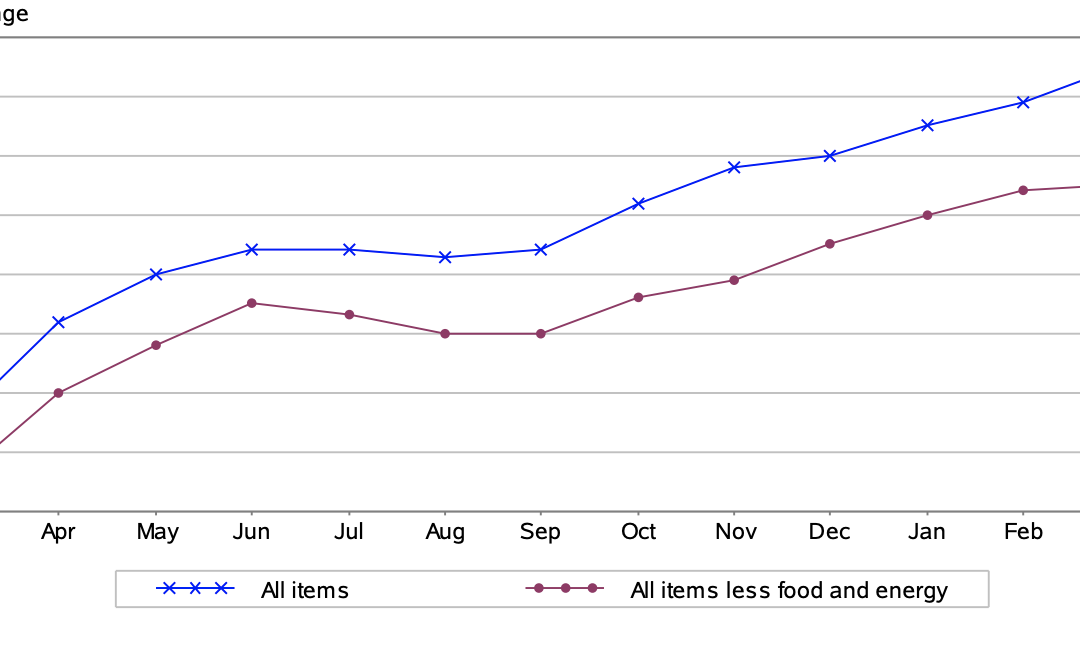
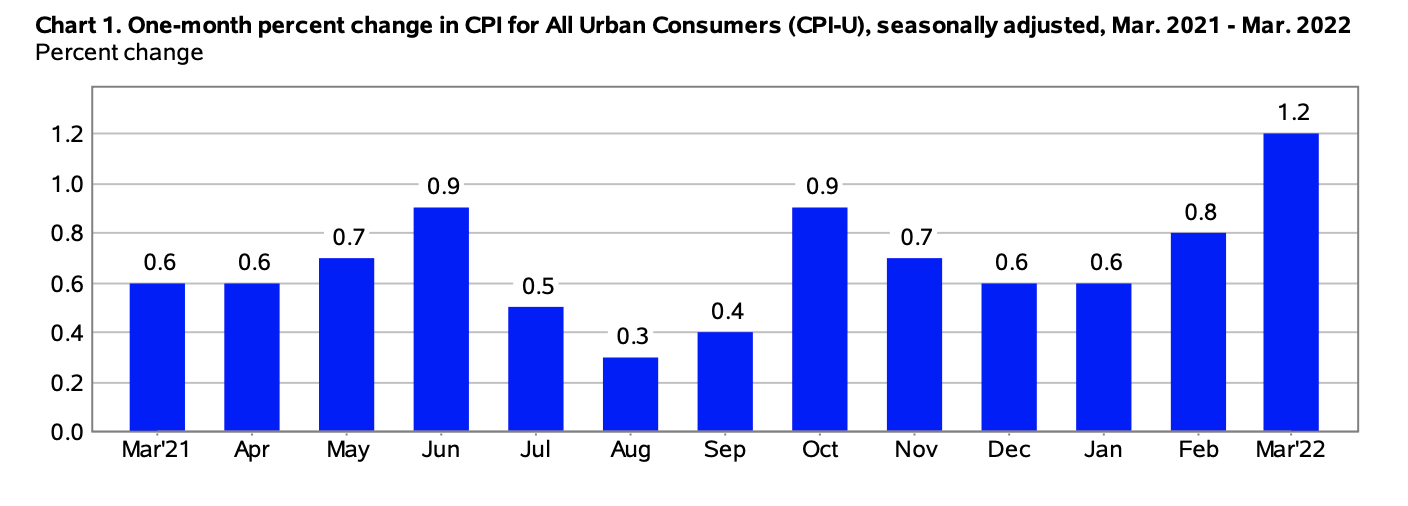
The Consumer Price Index for All Urban Consumers (CPI-U) grew by 1.2% on a seasonally adjusted basis in March, reported the U.S. Bureau of Labor Statistics. Over the last 12-month period, before seasonal adjustment, the all items index rose by 8.5%.
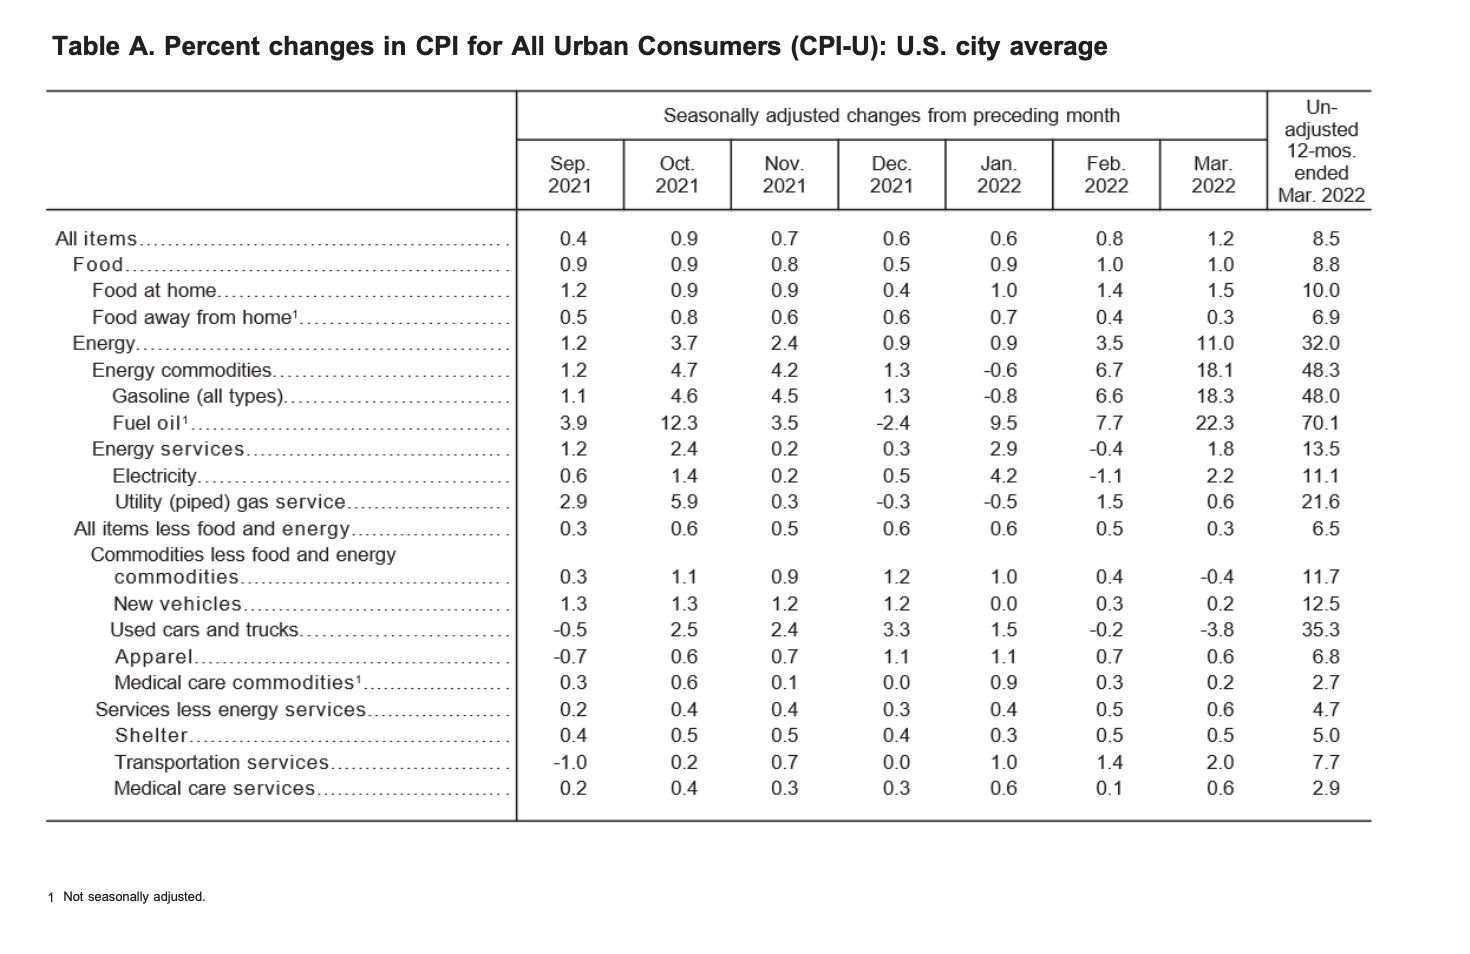
“Increases in the indexes for gasoline, shelter, and food were the largest contributors to the seasonally adjusted all items increase. The gasoline index rose 18.3% in March and accounted for over half of the all items monthly increase; other energy component indexes also increased. The food index rose 1% and the food at home index rose 1.5%.
The index for all items less food and energy rose 0.3% in March following a 0.5% increase the prior month. The shelter index was by far the biggest factor in the increase, with a broad set of other indexes also contributing, including those for airline fares, household furnishings and operations, medical care, and motor vehicle insurance. In contrast, the index for used cars and trucks fell 3.8% over the month.
The all items index continued to accelerate, rising 8.5% for the 12 months ending March, the largest 12-month increase since the period ending December 1981. The all items less food and energy index rose 6.5%, the largest 12-month change since the period ending August 1982. The energy index rose 32% over the last year, and the food index increased 8.8 percent, the largest 12-month increase since the period ending May 1981,” explained the bureau in its monthly report.
(Source: U.S. Bureau of Labor Statistics)
Energy
In March, the index for energy leaped by 11%. The price of gas soared 18.3% after the 6.6% increase seen in February. The price of electricity rose 2.2%, and the natural gas index increased 0.6%.
Since this time last year, the index for energy soared by 32%. The price of gasoline surged 48%, with percentage increases for the index for natural gas rising 21.6%, and the electricity index increasing 11.1%.
Food
In March, the index for food rose 1%. The food at home index increased 1.5% for the month. Over the month, all six major grocery store food group indexes saw percentage increases, explained the bureau.
“The food at home index rose 10% over the last 12 months, the largest 12-month increase since the period ending March 1981. The index for meats, poultry, fish, and eggs increased 13.7% over the last year as the index for beef rose 16%. The other major grocery store food group indexes also rose over the past year, with increases ranging from 7% (dairy and related products) to 10.3% (other food at home).
The index for food away from home rose 6.9% over the last year, the largest 12-month increase since December 1981. The index for full-service meals rose 8% over the last 12 months, and the index for limited-service meals rose 7.2%. The index for food at employee sites and schools, in contrast, declined 30.5% over the past 12 months, reflecting widespread free lunch programs,” stated the Bureau of Labor Statistics.
(Source: U.S. Bureau of Labor Statistics)
All Items Less Food and Energy
The all items less food and energy index inched up 0.3% for March. The composite index largely responsible for the monthly increase was the shelter index, which saw a 0.5% rise. Both the indexes for rent and owners’ equivalent rent increased by 0.4%, respectively.
“The index for all items less food and energy rose 6.5% over the past 12 months, with virtually all of its major component indexes rising over the span. The shelter index rose 5% over the last 12 months, its largest 12-month increase since May 1991. The index for household furnishings and operations increased 10.1% over the past year, its largest 12-month increase since the period ending July 1975,” explained the bureau in its report.
Source cited: https://www.bls.gov/news.release/archives/cpi_04122022.htm
by Sarah Bauder | Mar 10, 2022 | CPI
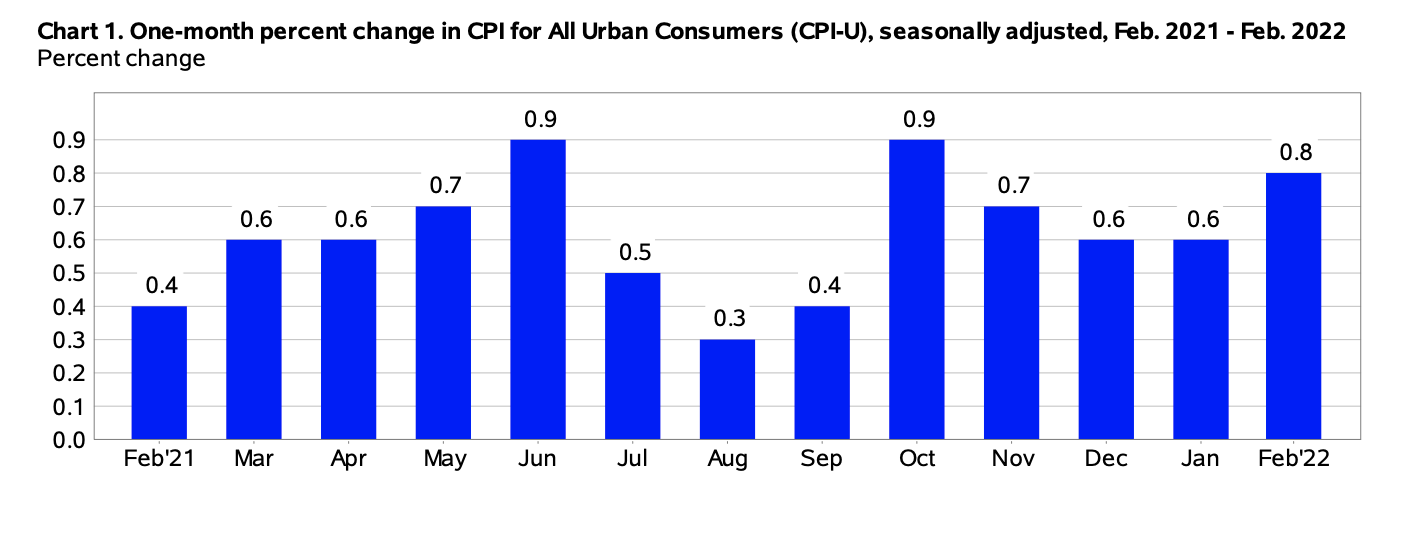
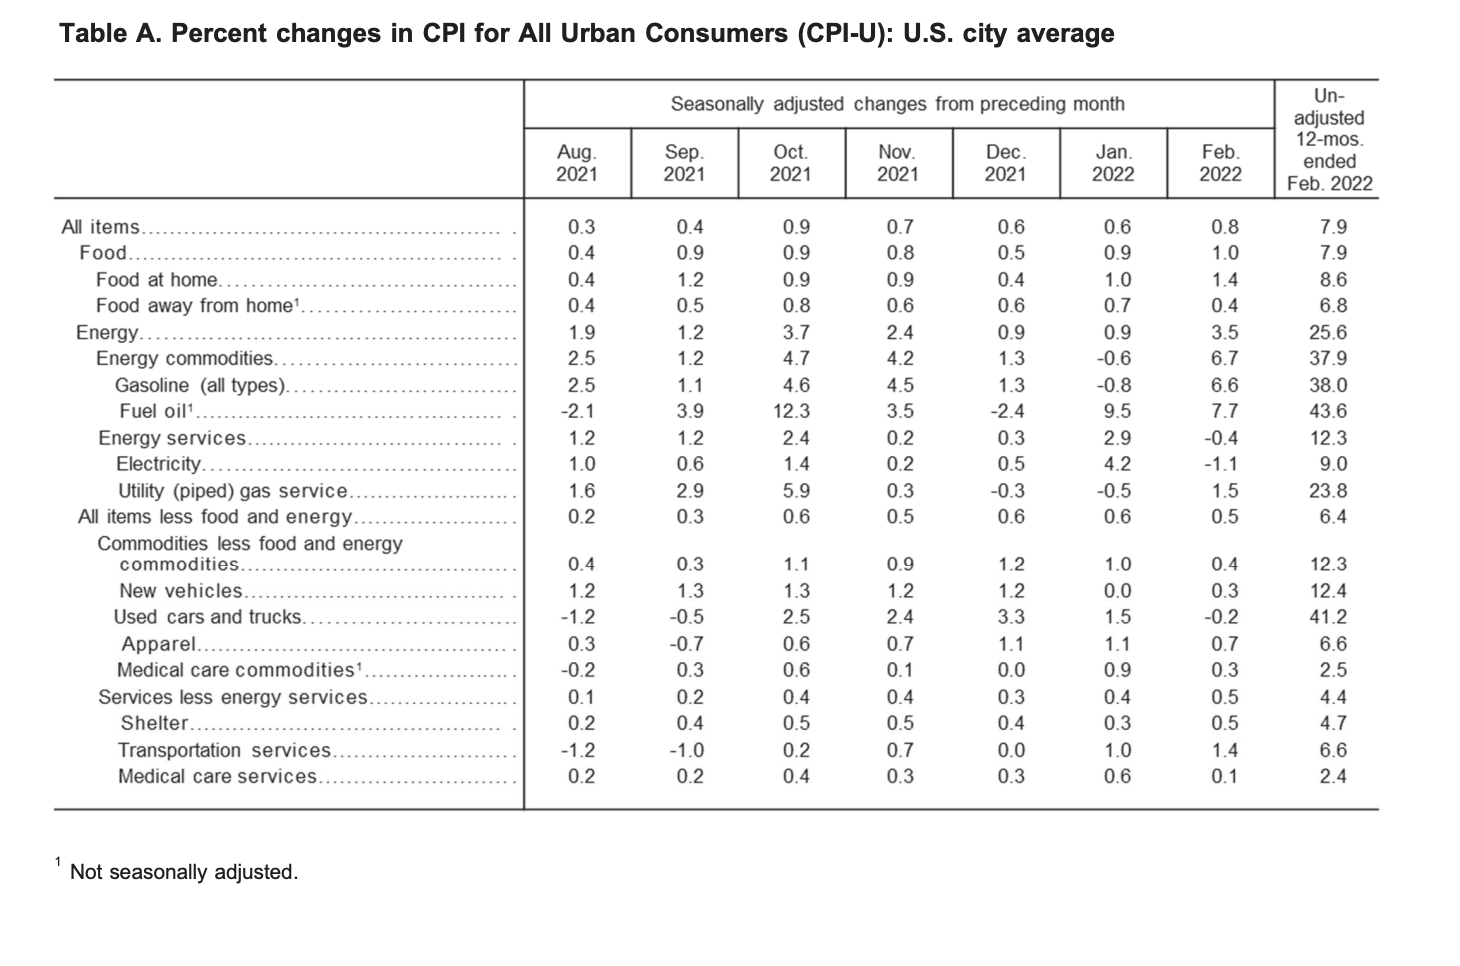
The Consumer Price Index for All Urban Consumers (CPI-U) grew by 0.8% on a seasonally adjusted basis in February, stated the U.S. Bureau of Labor Statistics in its monthly report. This is up from the 0.6% increase in January. Before seasonal adjustment, the all items index, the all items index increased 7.9% since this time last year.
“Increases in the indexes for gasoline, shelter, and food were the largest contributors to the seasonally adjusted all items increase. The gasoline index rose 6.6% in February and accounted for almost a third of the all items monthly increase; other energy component indexes were mixed. The food index rose 1% as the food at home index rose 1.4%; both were the largest monthly increases since April 2020.
The all items index rose 7.9% for the 12 months ending February. The 12-month increase has been steadily rising and is now the largest since the period ending January 1982. The all items less food and energy index rose 6.4%, the largest 12-month change since the period ending August 1982. The energy index rose 25.6% over the last year, and the food index increased 7.9%, the largest 12-month increase since the period ending July 1981,” explained the bureau in its report.
(Source: U.S. Bureau of Labor Statistics)
Energy
In February, the index for energy saw a sharp increase by 3.5%, after the 0.9% rise the previous month. The price of gasoline soared 6.6% after dropping 0.8% in January. The natural gas index rose 1.5%, while the index for electricity decreased 1.1%.
Over the last 12-month period, the index for energy increased by an astounding 25.6%. The price of gasoline skyrocketed 38%, the natural gas index soared 23.8%, and the electricity index increased 9%.
Food
In February, the index for food rose by 1%, with the food at home index rising 1.4% over the month. All six of the component food group indexes saw percentage increases with the fruits and vegetable index up 2.3%, “, its largest monthly increase since March 2010”. Other monthly increases included the fresh fruits index by 3.7%, the fresh vegetables index by 1.3%, the dairy products index by 1.9%, which marked its largest monthly rise since April 2011.
“The food at home index rose 8.6% over the last 12 months, the largest 12-month increase since the period ending April 1981. The index for meats, poultry, fish, and eggs increased 13% over the last year as the index for beef rose 16.2%. The other major grocery store food group indexes also rose over the past year, with increases ranging from 5.2% (dairy and related products) to 8.2% (other food at home).
The index for food away from home rose 6.8% over the last year, the largest 12-month increase since December 1981. The index for limited-service meals rose 8% over the last 12 months, and the index for full-service meals rose 7.5%. The index for food at employee sites and schools, in contrast, declined 40.7% over the past 12 months, reflecting widespread free lunch programs,” explained the Bureau of Labor Statistics.
(Source: U.S. Bureau of Labor Statistics)
All Items Less Food and Energy
The all items less food and energy index inched up 0.5% for the month. Since this time last year, the index increased 6.4%.
“The index for all items less food and energy rose 6.4% over the past 12 months, with virtually all of its major component indexes rising over the span. The shelter index rose 4.7% over the last 12 months, its largest 12-month increase since May 1991. Several transportation indexes showed large increases over the past year, including used cars and trucks (+41.2%), new vehicles (+12.4%), and airline fares (+12.7%),” noted the Bureau of Labor Statistics in its report.
Source cited: https://www.bls.gov/news.release/archives/cpi_03102022.htm
by Sarah Bauder | Feb 10, 2022 | CPI
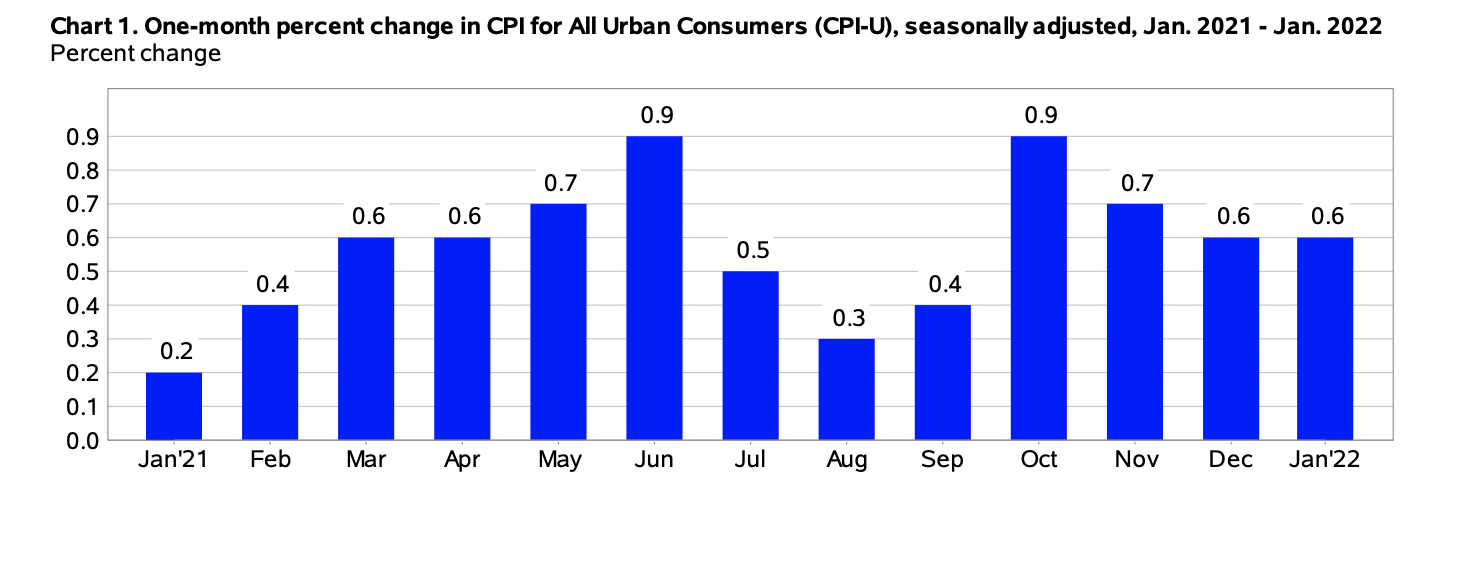
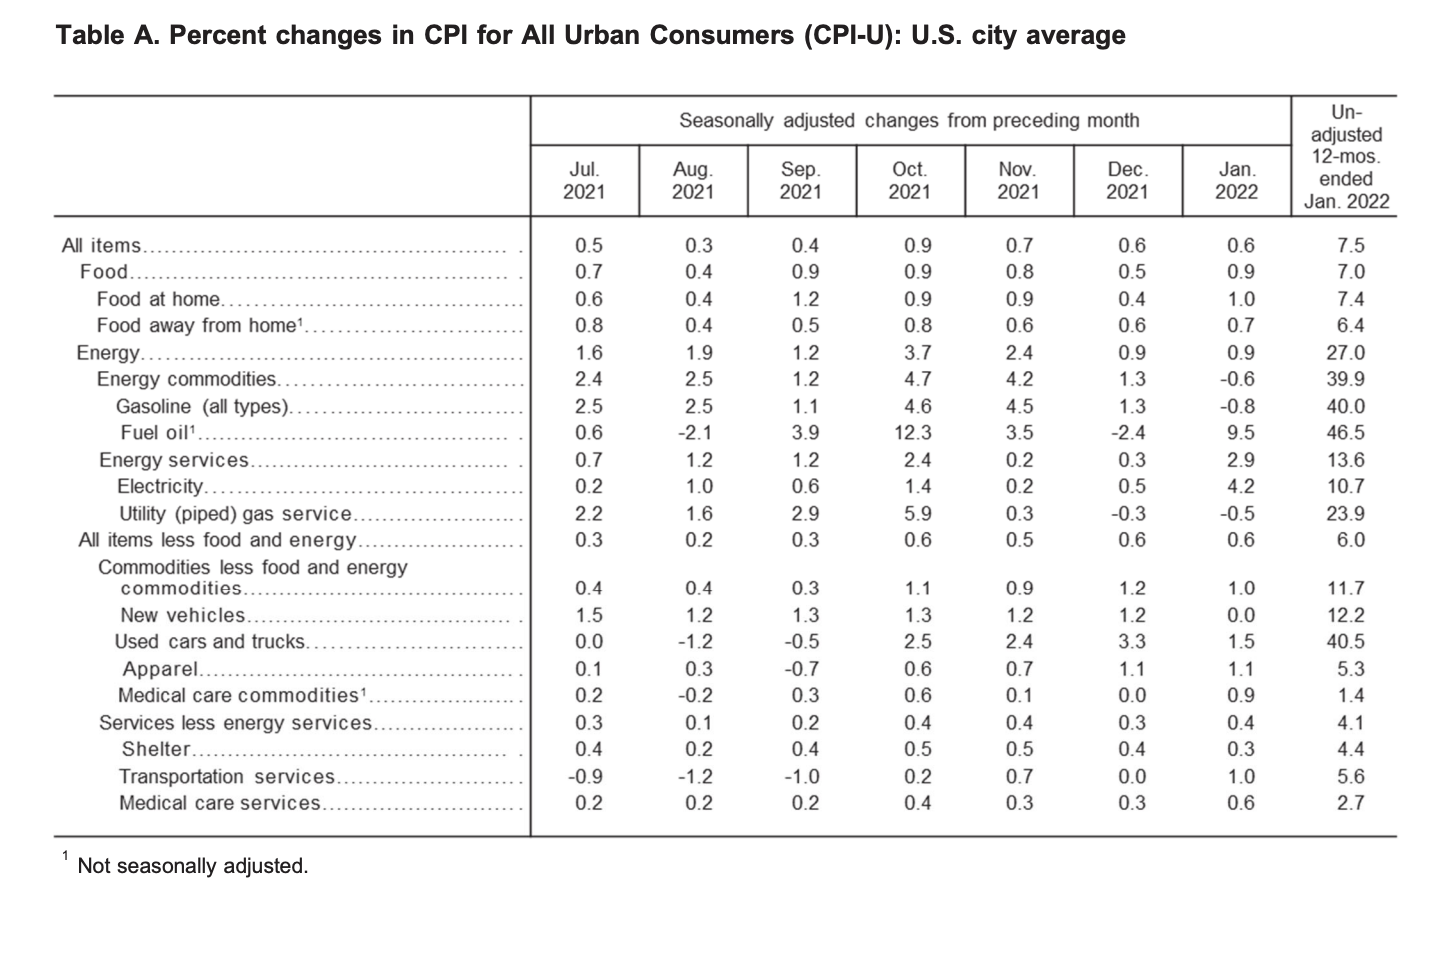
The Consumer Price Index for All Urban Consumers (CPI-U) grew by 0.6% on a seasonally adjusted basis in January, reported the U.S. Bureau of Labor Statistics – the same percentage increase seen in December. Since this time last year, before seasonal adjustment the all items index rose by 7.5%.
“Increases in the indexes for food, electricity, and shelter were the largest contributors to the seasonally adjusted all items increase. The food index rose 0.9% in January following a 0.5% increase in December. The energy index also increased 0.9% over the month, with an increase in the electricity index being partially offset by declines in the gasoline index and the natural gas index.
The index for all items less food and energy rose 0.6% in January, the same increase as in December. This was the seventh time in the last 10 months it has increased at least 0.5%. Along with the index for shelter, the indexes for household furnishings and operations, used cars and trucks, medical care, and apparel were among many indexes that increased over the month.
The all items index rose 7.5% for the 12 months ending January, the largest 12-month increase since the period ending February 1982. The all items less food and energy index rose 6%, the largest 12-month change since the period ending August 1982. The energy index rose 27% over the last year, and the food index increased 7%,” explained the bureau in the report.
(Source: U.S. Bureau of Labor Statistics)
Food
In January, the index for food rose 0.9%. The food at home index increased 1% over the month, after rising 0.4% in December, explained the bureau. Over the month, five of the six major grocery store food group indexes saw percentage increases. Likewise, the index for food away from home increased 0.7% in January.
“The food at home index rose 7.4% over the last 12 months. All of the six major grocery store food group indexes increased over the period. By far the largest increase was that of the index for meats, poultry, fish, and eggs, which rose 12.2% over the year. The index for dairy and related products increased 3.1%, the smallest 12-month increase among the groups.
The index for food away from home rose 6.4% over the last year, the largest 12-month increase since January 1982. The index for limited-service meals rose 8% over the last 12 months, and the index for full-service meals rose 7.1%. The index for food at employee sites and schools, in contrast, declined 46.9% over the past 12 months, reflecting widespread free lunch programs,” explained the U.S. Bureau of Labor Statistics in its report.
Energy
In January, the index for energy edged up 0.9%, reported the bureau. The price of electricity rose 4.2%. Conversely, gas prices dropped 0.8% as did the natural gas index by 0.5%.
Over the last 12-month period, the index for energy increased 27%. The price of gasoline surged 40%, with percentage increases for the index for natural gas rising 23.9%, and the electricity index increasing 10.7%.
(Source: U.S. Bureau of Labor Statistics)
All Items Less Food and Energy
The all items less food and energy index inched up 0.6% for January. The bureau reported that almost all major component indexes saw percentage increases in January including the shelter index by 0.3%, with the index for rent rising 0.5%, and owners’ equivalent rent by 0.4%.
“The index for all items less food and energy rose 6.0% over the past 12 months. Major contributors to this increase include shelter (+4.4%) and used cars and trucks (+40.5%). However, the increase is broad-based, with virtually all component indexes showing increases over the past 12 months,” stated the U.S. Bureau of Labor Statistics in its monthly report.
Source cited: https://www.bls.gov/news.release/archives/cpi_02102022.htm
by Sarah Bauder | Jan 12, 2022 | CPI
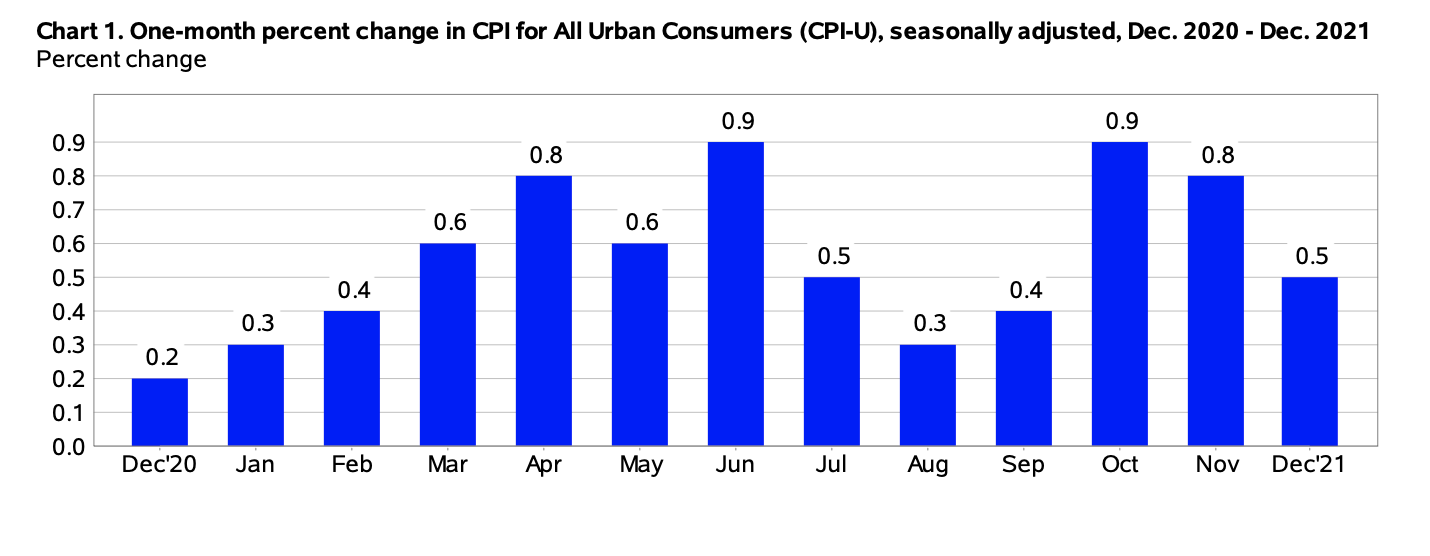
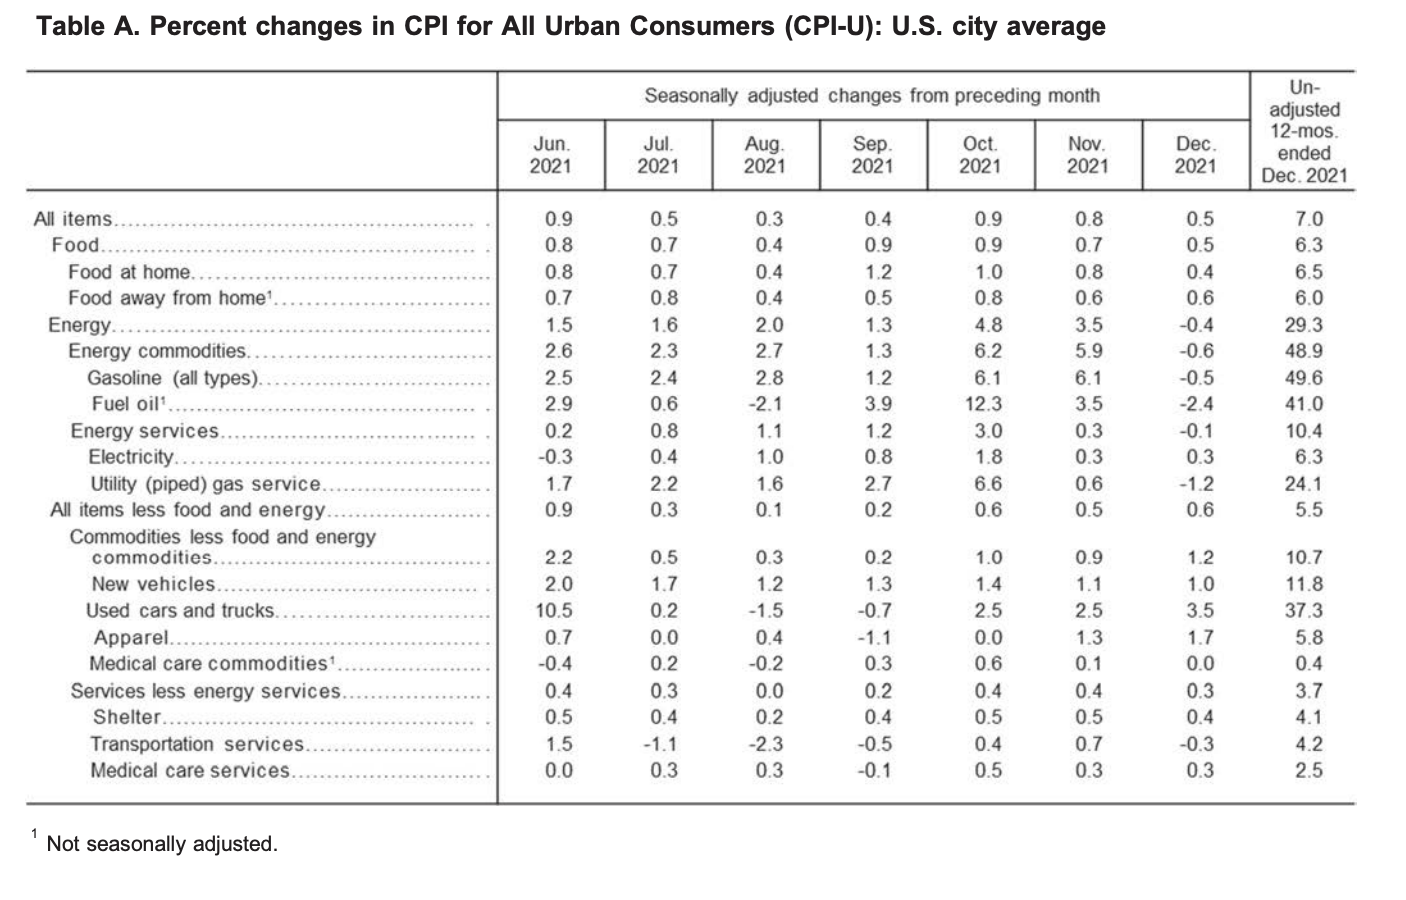
The Consumer Price Index for All Urban Consumers (CPI-U) rose 0.5% on a seasonally adjusted basis, reported the US Bureau of Labor Statistics. In November, it had risen by 0.8%. Over the last 12-month period, the index for all items increased 7% prior to seasonal adjustment.
“Increases in the indexes for shelter and for used cars and trucks were the largest contributors to the seasonally adjusted all items increase. The food index also contributed, although it increased less than in recent months, rising 0.5 percent in December. The energy index declined in December, ending a long series of increases; it fell 0.4 percent as the indexes for gasoline and natural gas both decreased.
The index for all items less food and energy rose 0.6 percent in December following a 0.5-percent increase in November. This was the sixth time in the last 9 months it has increased at least 0.5 percent. Along with the indexes for shelter and for used cars and trucks, the indexes for household furnishings and operations, apparel, new vehicles, and medical care all increased in December. As in November, the indexes for motor vehicle insurance and recreation were among the few to decline over the month,” reported the agency.
(Source: U.S. Bureau of Labor Statistics)
Food
In December, the index for food rose 0.5%. The food at home index rose 0.4%, with five of the six grocery store food group indexes seeing percentage increases for the month.
“The index for fruits and vegetables increased the most, rising 0.9 percent over the month as the index for fresh fruits increased 1.8 percent. The index for nonalcoholic beverages rose 0.8 percent in December, and the index for dairy and related products increased 0.7 percent. The index for other food at home rose 0.6 percent, and the index for cereals and bakery products increased 0.4 percent over the month. The index for meats, poultry, fish, and eggs declined in December, falling 0.4 percent after rising at least 0.7 percent in each of the last 7 months. The indexes for beef (-2.0 percent) and pork (-0.8 percent) declined after recent sharp increases,” explained the bureau in its report.
Over the last 12-month period, the index for food at home rose 6.5% – “this compares to a 1.5% annual increase over the last 10 years,” stated the bureau. All six of the component grocery store food group indexes saw percentage increases, with the index for meats, poultry, fish, and eggs rising 12.5%.
Likewise, over the last year, the food away from home index increased 6%, marking the largest percentage rise since January 1982.
Energy
The index for energy dropped 0.4% for the month. In December, gas prices declined 0.5%, after increasing consecutively by 6.1% in both October and November. The natural gas index also decreased 1.2% for the month. Conversely, the index for electricity edged up 0.3%.
Overall, over the last 12-month period, the energy index soared 29.3%. Gas prices skyrocketed 49.6%, the electricity index increased 6.3%, and the natural gas index surged 24.1%.
(Source: U.S. Bureau of Labor Statistics)
All Items Less Food and Energy
In December, the index for all items less food and energy increased by 0.6%. Several of the component indexes saw increases over the month including the shelter index by 0.4%, likewise, the indexes for rent and owners’ equivalent rent both increased 0.4%.
“The index for all items less food and energy rose 5.5% over the past 12 months, its largest 12- month increase since the period ending February 1991. Major contributors to this increase include shelter (+4.1%) and used cars and trucks (+37.3%). However, the increase is broad-based, with virtually all component indexes showing increases over the past 12 months,” explained the US Bureau of Labor Statistics.
The US Bureau of Labor Statistics released a statement regarding the impact of the COVID-19 pandemic on CPI data:
“Data collection by personal visit for the Consumer Price Index (CPI) program has been suspended almost entirely since March 16, 2020. When possible, data normally collected by personal visit were collected either online or by phone. Additionally, data collection in December was affected by the temporary closing or limited operations of certain types of establishments. These factors resulted in an increase in the number of prices considered temporarily unavailable and imputed. While the CPI program attempted to collect as much data as possible, many indexes are based on smaller amounts of collected prices than usual, and a small number of indexes that are normally published were not published this month. For each month from March 2020 to December 2021, BLS has published a summary of the impact of the pandemic on the Consumer Price Index news release and data. The impact summary for December is available at www.bls.gov/covid19/consumer-price-index-covid19-impacts-december2021.htm. Beginning with publication of January 2022 data in February 2022, this month-specific impact summary will be discontinued. However, information related to the impact of the pandemic will continue to be available at www.bls.gov/covid19/effects-of-covid-19-pandemic-on-consumerprice-index.htm.”
Source cited: https://www.bls.gov/news.release/archives/cpi_01122022.htm
by Sarah Bauder | Dec 10, 2021 | CPI
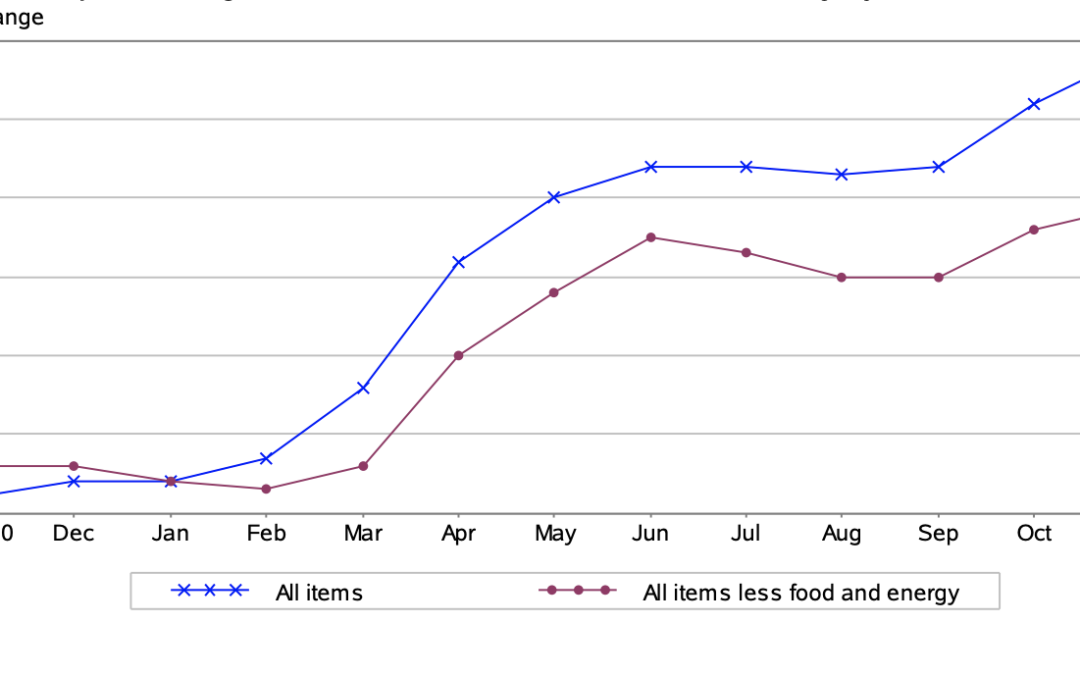
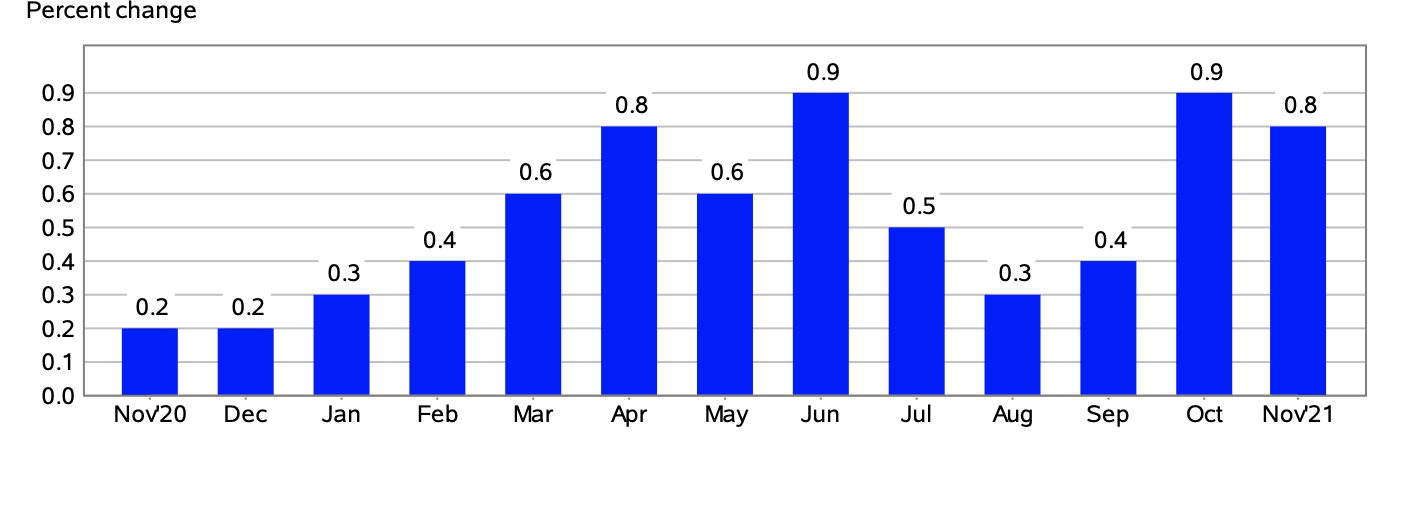
The Consumer Price Index for All Urban Consumers (CPI-U) edged up 0.8% in November on a seasonally adjusted basis, reported the US Bureau of Labor Statistics. In October, it had increased 0.9%.
“The index for all items less food and energy rose 0.5% in November following a 0.6% increase in October. Along with shelter, used cars and trucks, and new vehicles, the indexes for household furnishings and operations, apparel, and airline fares were among those that increased. The indexes for motor vehicle insurance, recreation, and communication all declined in November,” stated the Bureau of Labor Statistics in its monthly report.
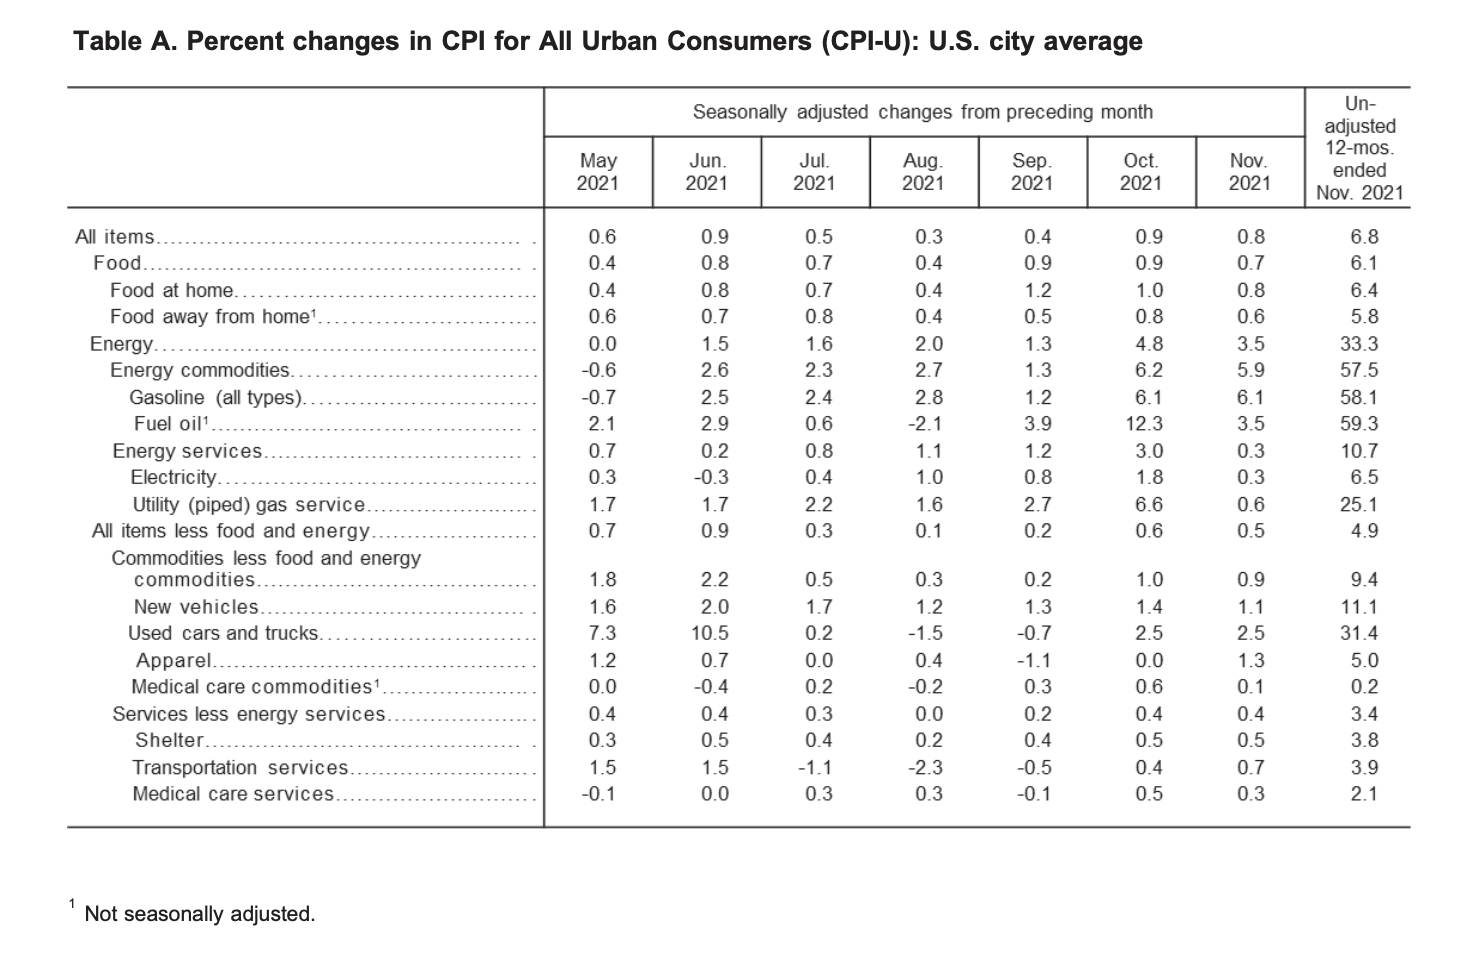
Over the last 12-month span, the index for all items index increased 6.8%, which evidently marked the largest 12-month rise seen since June 1982. The all items less food and energy likewise increased by 4.9% since this time last year. The energy index skyrocketed 33.3% year-over-year, and the index for food rose 6.1% since this time last year.
(Source: U.S. Bureau of Labor Statistics)
Energy Index
In November, the index for energy edged up 3.5%, after seeing a 4.8% increase in October, reported the bureau. The price of gas rose 6.1% for the month, the electricity index edged up 0.3%, and the index for natural gas increased by 0.6%.
Over the last year, the index for energy soared an astounding 33.3%, with all composite indexes seeing percentage increases.
“The gasoline index rose 58.1% over the last year, its largest 12-month increase since the period ending April 1980. The index for natural gas rose 25.1% over the last 12 months, and the electricity index rose 6.5%,” explained the Bureau of Labor Statistics.
Food Index
For the month, the index for food edged up 0.7%. The index for food at home increased 0.8% for November. All of the six major grocery store category indexes saw percentage increases over the month, marking “the third consecutive month that all six increased.”
Over the last 12-month period, the food at home index rose 6.4% – the largest year-long increase since December 2008. All six component grocery store food group indexes saw percentage rises.
“The index for meats, poultry, fish, and eggs increased 12.8%, with the index for beef rising 20.9%. The index for dairy and related products posted the smallest increase, rising 1.6% over the last 12 months. The remaining major grocery store food group indexes posted increases ranging from 4.0% (fruits and vegetables) to 5.7% (other food at home). The index for food away from home rose 5.8% over the last year, the largest 12-month increase since the period ending January 1982. The index for limited service meals rose 7.9% over the last 12 months, and the index for full service meals rose 6.0%. The index for food at employee sites and schools, in contrast, declined 44.9% over the past 12 months,” reported the bureau.
(Source: U.S. Bureau of Labor Statistics)
All Items Less Food and Energy
In November, the index for all items less food and energy crept up 0.5%. Several of the component indexes all saw increases over the month including the shelter index by 0.5%, the indexes for rent and owners’ equivalent rent both rose 0.4%, and the idex for used cars and trucks by 2.5%.
Some of the composite indexes that declined were the motor vehicle insurance index by 0.8%, and the indexes for recreation and communication both declined 0.2%, respectively.
“The index for all items less food and energy rose 4.9% over the past 12 months, its largest 12- month increase since the period ending June 1991. The index for used cars and trucks rose 31.4% over the last 12 months, and the index for new vehicles rose 11.1%. The shelter index rose 3.8%, the largest 12-month increase since the period ending June 2007. The index for medical care increased 1.7% over the last year,” said the US Bureau of Labor Statistics.
The US Bureau of Labor Statistics released a statement:
“Coronavirus (COVID-19) Pandemic Impact on November 2021 Consumer Price Index Data
Data collection by personal visit for the Consumer Price Index (CPI) program has been suspended almost entirely since March 16, 2020. When possible, data normally collected by personal visit were collected either online or by phone. Additionally, data collection in November was affected by the temporary closing or limited operations of certain types of establishments. These factors resulted in an increase in the number of prices considered temporarily unavailable and imputed. While the CPI program attempted to collect as much data as possible, many indexes are based on smaller amounts of collected prices than usual, and a small number of indexes that are normally published were not published this month. Additional information is available at www.bls.gov/covid19/effects-of-covid-19-pandemic-on-consumer-price-index.htm.”
Source cited: https://www.bls.gov/news.release/archives/cpi_12102021.htm
by Sarah Bauder | Nov 10, 2021 | CPI
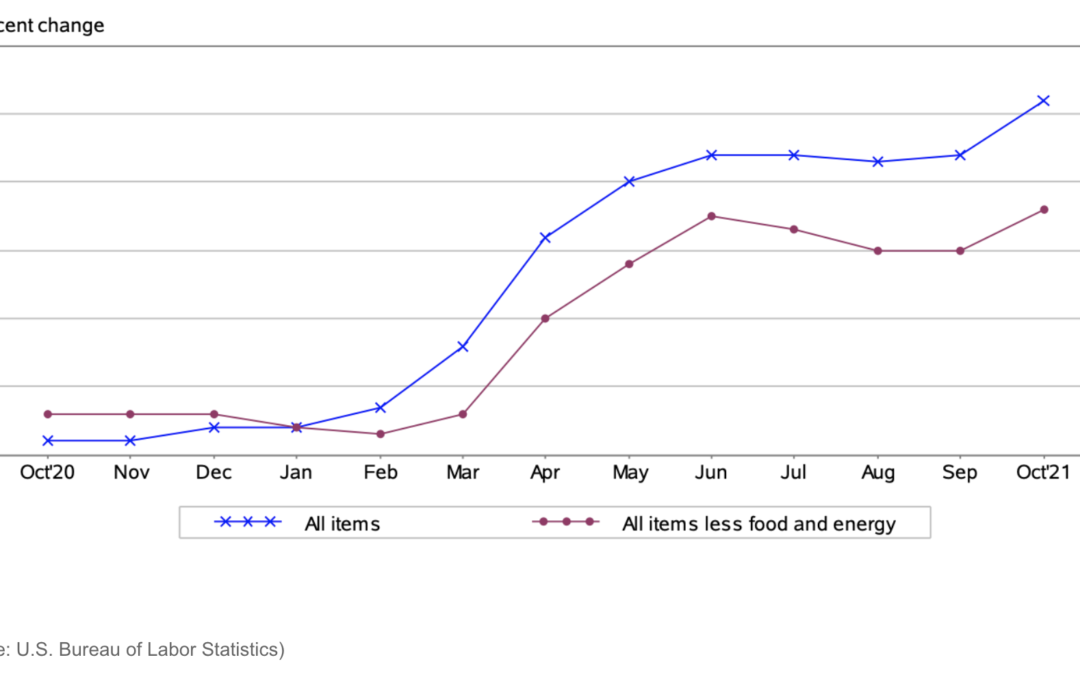
The Consumer Price Index for All Urban Consumers (CPI-U) grew by 0.9% on a seasonally adjusted basis in October, reported the U.S. Bureau of Labor Statistics today. This is up from the 0.4% percentage increase seen in September. Before seasonal adjustment, the all items index rose by 6.2%.
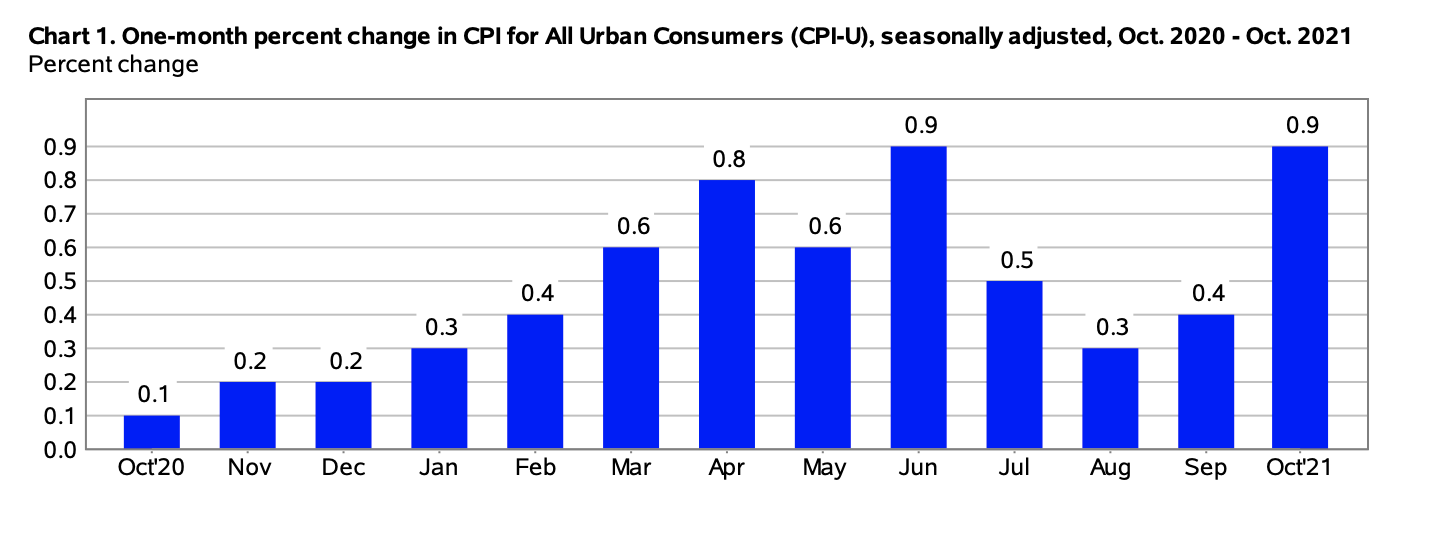
(Source: U.S. Bureau of Labor Statistics)
Food
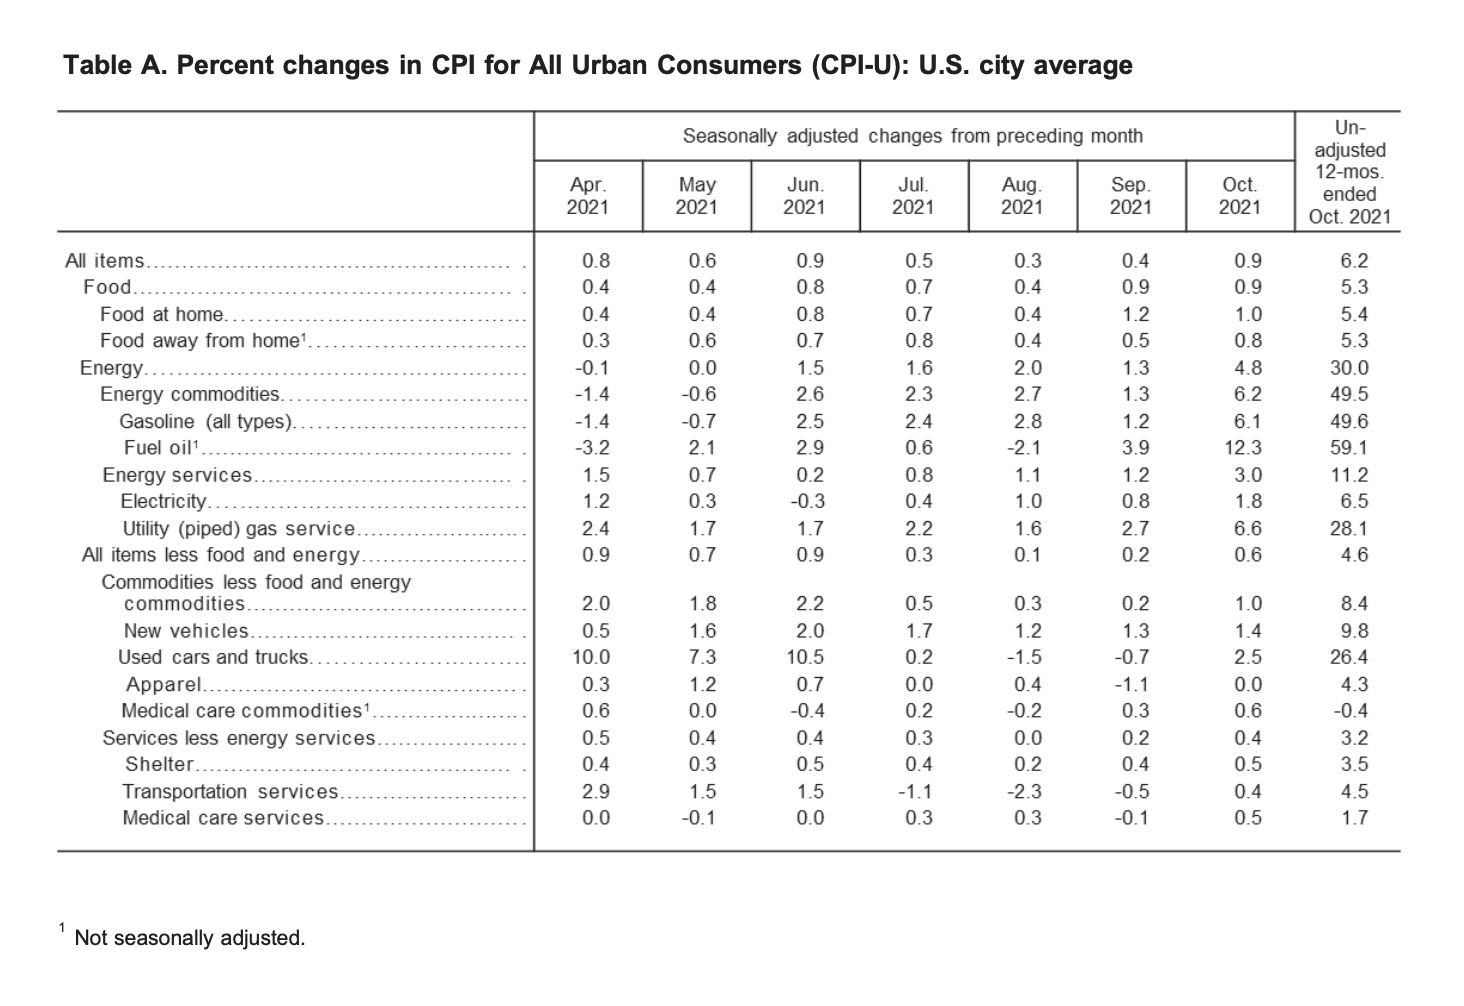
In October, the index for food rose by 0.9%, the identical percentage growth seen the previous month, explained the bureau. Over the month, the index rose 1% with all six component food group indexes seeing percentage increases.
“The index for meats, poultry, fish, and eggs continued to rise sharply, increasing 1.7% following a 2.2% increase in September. The index for beef rose 3.1% over the month. The index for other food at home rose 1.2% over the month, its largest monthly increase since April 2020, near the onset of the pandemic. The index for cereals and bakery products rose 1.0 percent in October following a 1.1% increase the prior month. The index for nonalcoholic beverages rose 0.8% in October, the index for dairy and related products rose 0.2%, and the index for fruits and vegetables advanced 0.1%,” noted the Bureau of Labor Statistics.
Over the last 12-month period, the food at home index increased 5.4% with all six component food group indexes seeing significant percentage increases.
“The index for meats, poultry, fish, and eggs increased 11.9%, with the index for beef rising 20.1% and the index for pork rising 14.1%, its largest 12-month increase since the period ending December 1990,” explained the bureau.
Energy
In October, the index for energy saw a sharp increase of 4.8%, after the 1.3% rise the previous month. Gas prices increased 6.1%, marking the “ fifth consecutive monthly increase”. Likewise, the indexes for electricity, natural gas, and fuel oil all increased – 1.8%, 6.6%, and 12.3%, respectively.
Overall, since this time last year the index for energy surged by 30%, the most significant year-over-year increase since September 2005.
“All the major energy component indexes increased sharply over the last 12 months. The gasoline index rose 49.6% over the last year, and is now at its highest level since September 2014. The fuel oil index increased sharply over the year, rising 59.1%. The index for natural gas rose 28.1% over the last 12 months, and the electricity index rose 6.5%,” explained the Bureau of Labor Statistics.
(Source: U.S. Bureau of Labor Statistics)
All Items Less Food and Energy
The all items less food and energy index inched up 0.6% for the month. The bureau reported that all major component indexes saw percentage increases in October including the shelter index by 0.5%, plus the indexes for rent and owners’ equivalent rent both by 0.4%.
Since this time last year, the all items less food and energy index increased 4.6%.
“Component indexes rising more include used cars and trucks (26.4%) and new vehicles (9.8%, the largest 12-month increase since the period ending May 1975). Indexes rising less than 4.6 percent include shelter (3.5%) and medical care (1.3%). Few major component indexes declined over the past year; one exception is airline fares (-4.6%),” noted the bureau in its October report.
The Bureau of Labor Statistics included this statement with its October report:
“Coronavirus (COVID-19) Pandemic Impact on October 2021 Consumer Price Index Data Data collection by personal visit for the Consumer Price Index (CPI) program has been suspended almost entirely since March 16, 2020. When possible, data normally collected by personal visit were collected either online or by phone. Additionally, data collection in October was affected by the temporary closing or limited operations of certain types of establishments. These factors resulted in an increase in the number of prices considered temporarily unavailable and imputed. While the CPI program attempted to collect as much data as possible, many indexes are based on smaller amounts of collected prices than usual, and a small number of indexes that are normally published were not published this month. Additional information is available at www.bls.gov/covid19/effects-of-covid-19-pandemic-on-consumer-price-index.htm.”
Source cited: https://www.bls.gov/news.release/archives/cpi_11102021.htm

