-v3")

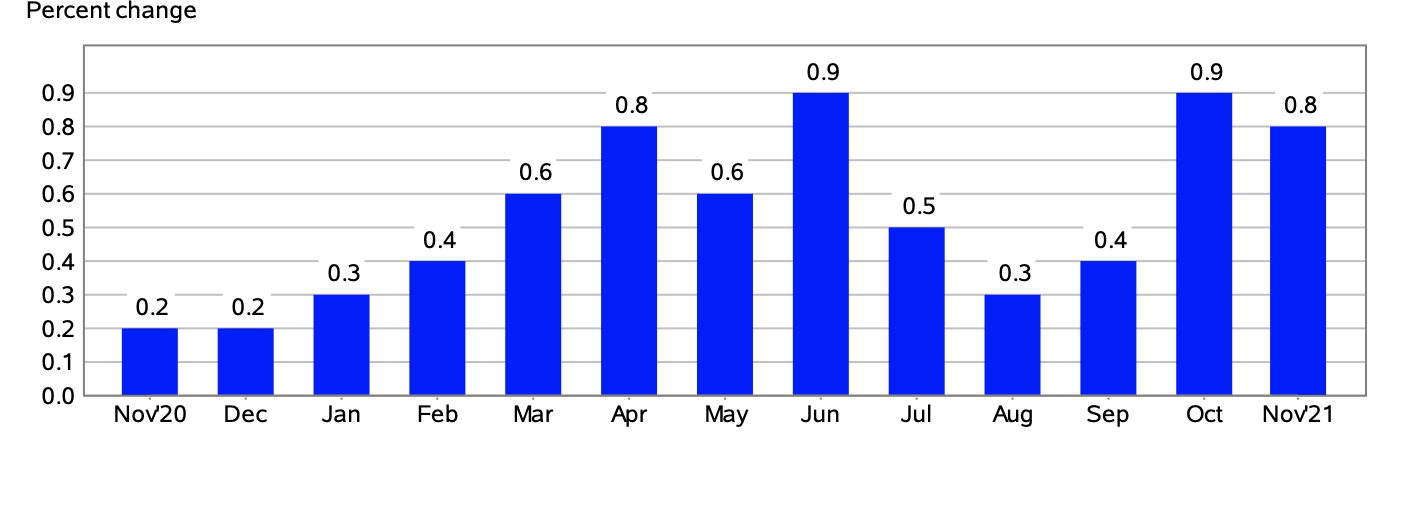
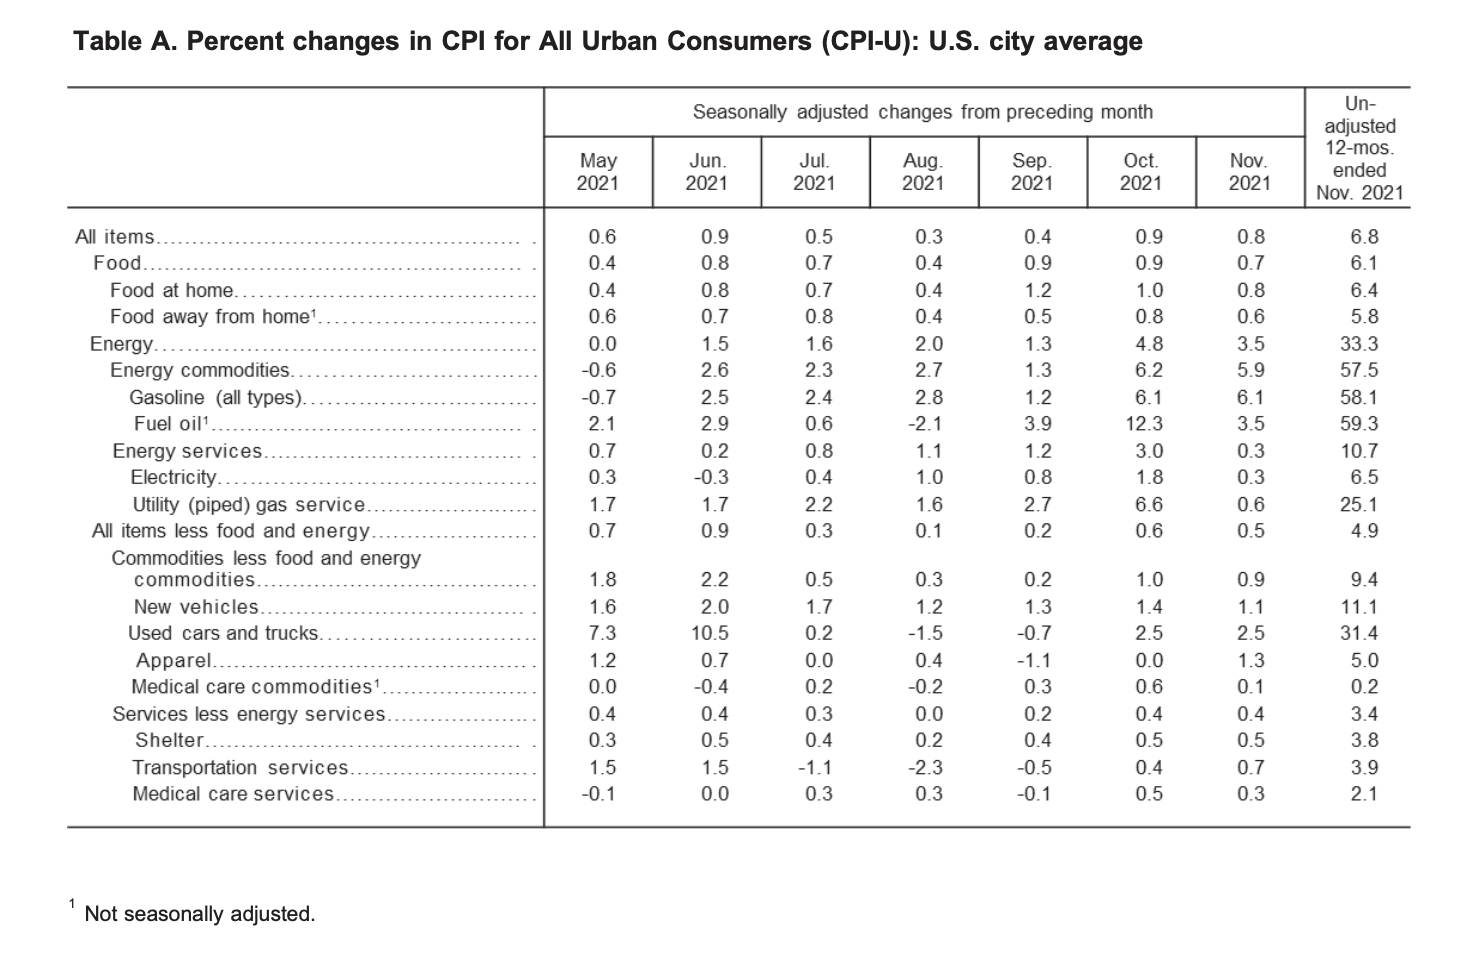
The Consumer Price Index for All Urban Consumers (CPI-U) edged up 0.8% in November on a seasonally adjusted basis, reported the US Bureau of Labor Statistics. In October, it had increased 0.9%.
“The index for all items less food and energy rose 0.5% in November following a 0.6% increase in October. Along with shelter, used cars and trucks, and new vehicles, the indexes for household furnishings and operations, apparel, and airline fares were among those that increased. The indexes for motor vehicle insurance, recreation, and communication all declined in November,” stated the Bureau of Labor Statistics in its monthly report.
Over the last 12-month span, the index for all items index increased 6.8%, which evidently marked the largest 12-month rise seen since June 1982. The all items less food and energy likewise increased by 4.9% since this time last year. The energy index skyrocketed 33.3% year-over-year, and the index for food rose 6.1% since this time last year.
(Source: U.S. Bureau of Labor Statistics)
Energy Index
In November, the index for energy edged up 3.5%, after seeing a 4.8% increase in October, reported the bureau. The price of gas rose 6.1% for the month, the electricity index edged up 0.3%, and the index for natural gas increased by 0.6%.
Over the last year, the index for energy soared an astounding 33.3%, with all composite indexes seeing percentage increases.
“The gasoline index rose 58.1% over the last year, its largest 12-month increase since the period ending April 1980. The index for natural gas rose 25.1% over the last 12 months, and the electricity index rose 6.5%,” explained the Bureau of Labor Statistics.
Food Index
For the month, the index for food edged up 0.7%. The index for food at home increased 0.8% for November. All of the six major grocery store category indexes saw percentage increases over the month, marking “the third consecutive month that all six increased.”
Over the last 12-month period, the food at home index rose 6.4% – the largest year-long increase since December 2008. All six component grocery store food group indexes saw percentage rises.
“The index for meats, poultry, fish, and eggs increased 12.8%, with the index for beef rising 20.9%. The index for dairy and related products posted the smallest increase, rising 1.6% over the last 12 months. The remaining major grocery store food group indexes posted increases ranging from 4.0% (fruits and vegetables) to 5.7% (other food at home). The index for food away from home rose 5.8% over the last year, the largest 12-month increase since the period ending January 1982. The index for limited service meals rose 7.9% over the last 12 months, and the index for full service meals rose 6.0%. The index for food at employee sites and schools, in contrast, declined 44.9% over the past 12 months,” reported the bureau.
(Source: U.S. Bureau of Labor Statistics)
All Items Less Food and Energy
In November, the index for all items less food and energy crept up 0.5%. Several of the component indexes all saw increases over the month including the shelter index by 0.5%, the indexes for rent and owners’ equivalent rent both rose 0.4%, and the idex for used cars and trucks by 2.5%.
Some of the composite indexes that declined were the motor vehicle insurance index by 0.8%, and the indexes for recreation and communication both declined 0.2%, respectively.
“The index for all items less food and energy rose 4.9% over the past 12 months, its largest 12- month increase since the period ending June 1991. The index for used cars and trucks rose 31.4% over the last 12 months, and the index for new vehicles rose 11.1%. The shelter index rose 3.8%, the largest 12-month increase since the period ending June 2007. The index for medical care increased 1.7% over the last year,” said the US Bureau of Labor Statistics.
The US Bureau of Labor Statistics released a statement:
“Coronavirus (COVID-19) Pandemic Impact on November 2021 Consumer Price Index Data
Data collection by personal visit for the Consumer Price Index (CPI) program has been suspended almost entirely since March 16, 2020. When possible, data normally collected by personal visit were collected either online or by phone. Additionally, data collection in November was affected by the temporary closing or limited operations of certain types of establishments. These factors resulted in an increase in the number of prices considered temporarily unavailable and imputed. While the CPI program attempted to collect as much data as possible, many indexes are based on smaller amounts of collected prices than usual, and a small number of indexes that are normally published were not published this month. Additional information is available at www.bls.gov/covid19/effects-of-covid-19-pandemic-on-consumer-price-index.htm.”
Source cited: https://www.bls.gov/news.release/archives/cpi_12102021.htm

Sarah has been writing on the topics of politics, history and finance for over a decade. She is currently an editor at CPI Inflation Calculator, covering the topics of CPI, inflation, US economy and economic commentary.
