-v3")

The Consumer Price Index for All Urban Consumers (CPI-U) grew by 0.9% on a seasonally adjusted basis in October, reported the U.S. Bureau of Labor Statistics today. This is up from the 0.4% percentage increase seen in September. Before seasonal adjustment, the all items index rose by 6.2%.
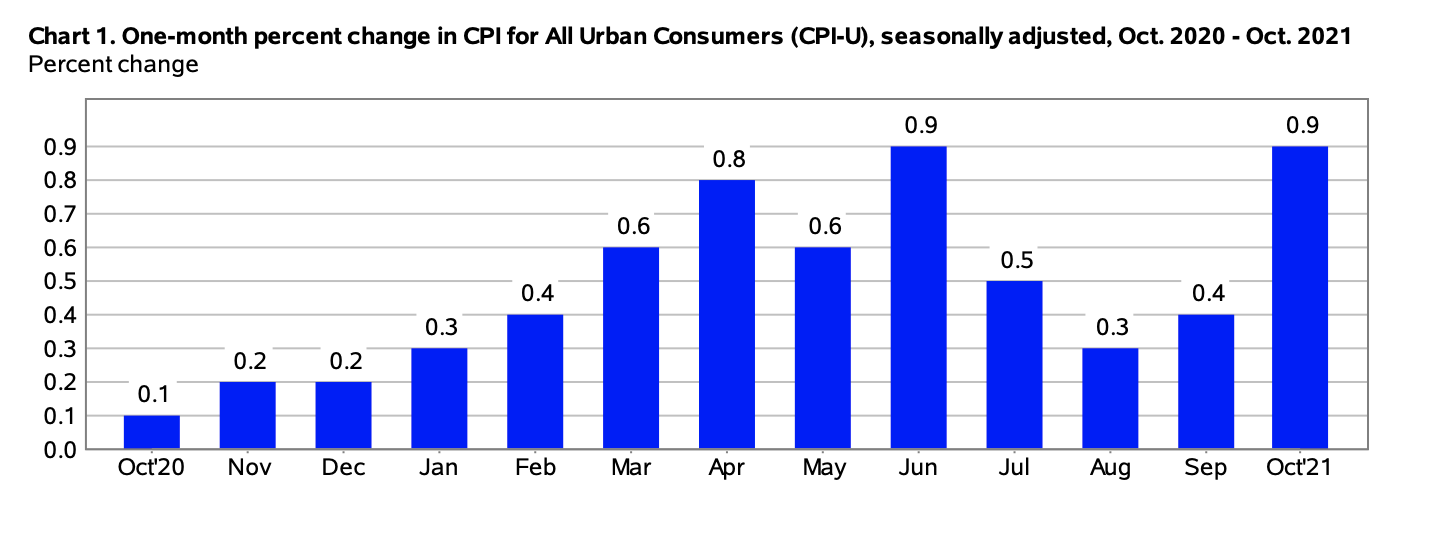
(Source: U.S. Bureau of Labor Statistics)
Food
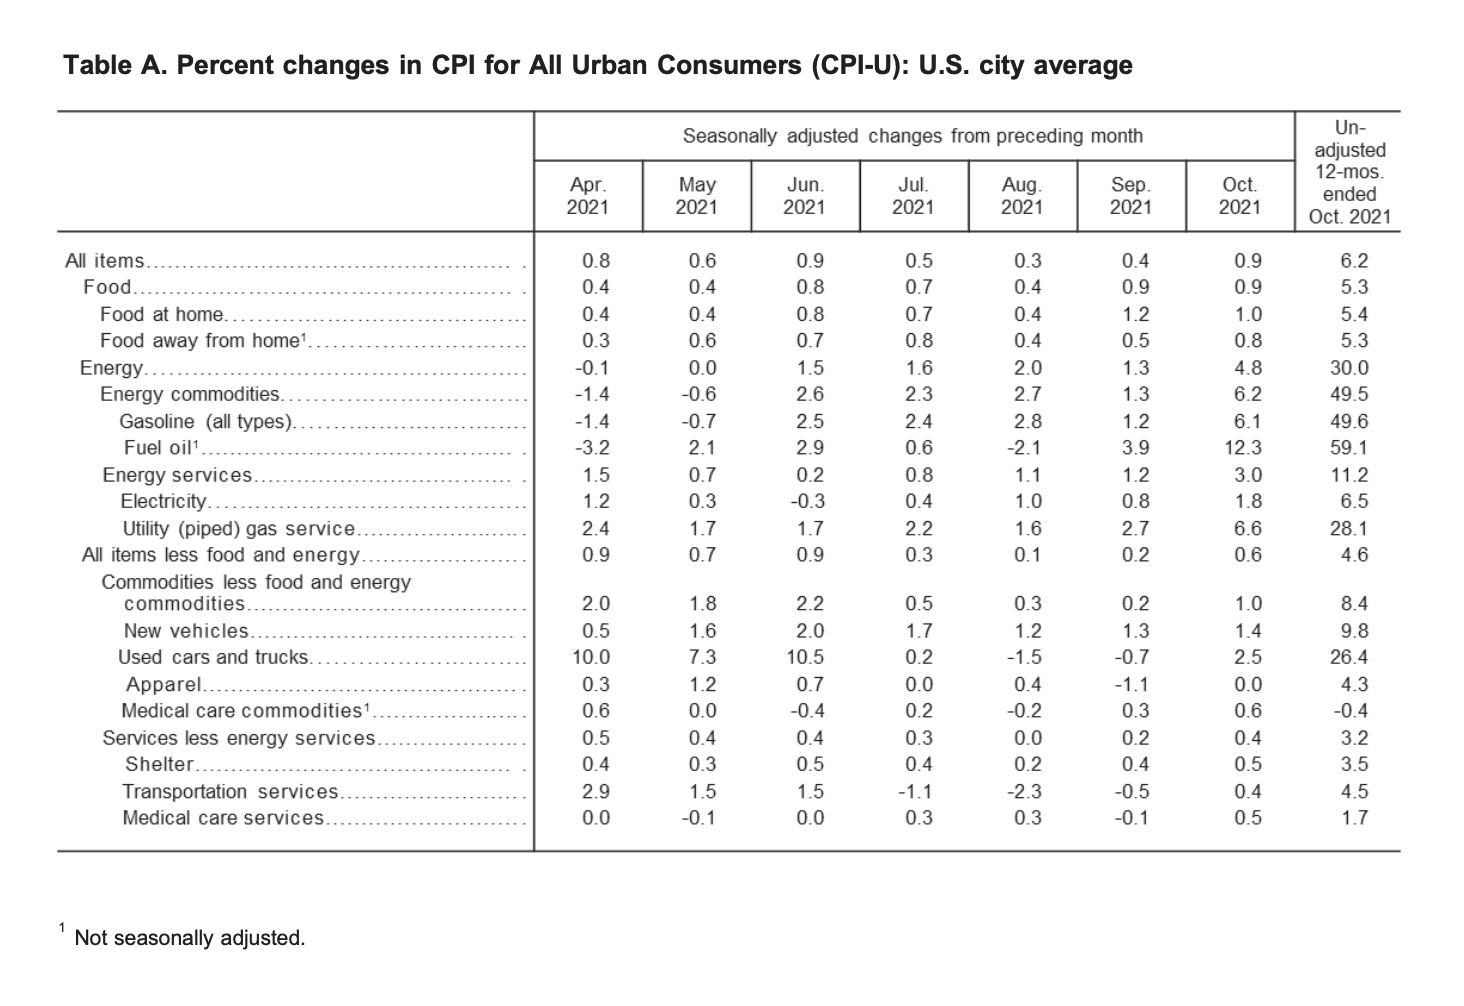
In October, the index for food rose by 0.9%, the identical percentage growth seen the previous month, explained the bureau. Over the month, the index rose 1% with all six component food group indexes seeing percentage increases.
“The index for meats, poultry, fish, and eggs continued to rise sharply, increasing 1.7% following a 2.2% increase in September. The index for beef rose 3.1% over the month. The index for other food at home rose 1.2% over the month, its largest monthly increase since April 2020, near the onset of the pandemic. The index for cereals and bakery products rose 1.0 percent in October following a 1.1% increase the prior month. The index for nonalcoholic beverages rose 0.8% in October, the index for dairy and related products rose 0.2%, and the index for fruits and vegetables advanced 0.1%,” noted the Bureau of Labor Statistics.
Over the last 12-month period, the food at home index increased 5.4% with all six component food group indexes seeing significant percentage increases.
“The index for meats, poultry, fish, and eggs increased 11.9%, with the index for beef rising 20.1% and the index for pork rising 14.1%, its largest 12-month increase since the period ending December 1990,” explained the bureau.
Energy
In October, the index for energy saw a sharp increase of 4.8%, after the 1.3% rise the previous month. Gas prices increased 6.1%, marking the “ fifth consecutive monthly increase”. Likewise, the indexes for electricity, natural gas, and fuel oil all increased – 1.8%, 6.6%, and 12.3%, respectively.
Overall, since this time last year the index for energy surged by 30%, the most significant year-over-year increase since September 2005.
“All the major energy component indexes increased sharply over the last 12 months. The gasoline index rose 49.6% over the last year, and is now at its highest level since September 2014. The fuel oil index increased sharply over the year, rising 59.1%. The index for natural gas rose 28.1% over the last 12 months, and the electricity index rose 6.5%,” explained the Bureau of Labor Statistics.
(Source: U.S. Bureau of Labor Statistics)
All Items Less Food and Energy
The all items less food and energy index inched up 0.6% for the month. The bureau reported that all major component indexes saw percentage increases in October including the shelter index by 0.5%, plus the indexes for rent and owners’ equivalent rent both by 0.4%.
Since this time last year, the all items less food and energy index increased 4.6%.
“Component indexes rising more include used cars and trucks (26.4%) and new vehicles (9.8%, the largest 12-month increase since the period ending May 1975). Indexes rising less than 4.6 percent include shelter (3.5%) and medical care (1.3%). Few major component indexes declined over the past year; one exception is airline fares (-4.6%),” noted the bureau in its October report.
The Bureau of Labor Statistics included this statement with its October report:
“Coronavirus (COVID-19) Pandemic Impact on October 2021 Consumer Price Index Data Data collection by personal visit for the Consumer Price Index (CPI) program has been suspended almost entirely since March 16, 2020. When possible, data normally collected by personal visit were collected either online or by phone. Additionally, data collection in October was affected by the temporary closing or limited operations of certain types of establishments. These factors resulted in an increase in the number of prices considered temporarily unavailable and imputed. While the CPI program attempted to collect as much data as possible, many indexes are based on smaller amounts of collected prices than usual, and a small number of indexes that are normally published were not published this month. Additional information is available at www.bls.gov/covid19/effects-of-covid-19-pandemic-on-consumer-price-index.htm.”
Source cited: https://www.bls.gov/news.release/archives/cpi_11102021.htm

Sarah has been writing on the topics of politics, history and finance for over a decade. She is currently an editor at CPI Inflation Calculator, covering the topics of CPI, inflation, US economy and economic commentary.
