by Ryan Barnes | Mar 25, 2015 | CPI, Definitions, gold, Inflation
The U.S. economy got a little economic boost today with a stronger-than-expected CPI reading for February, and a strong Purchasing Manager’s Index (PMI) that continued to project GDP growth.
Headline CPI and core CPI both came in 0.2% higher than January, as slight price hikes at the pump for refined products balanced out a general breather in the declines in some of the base commodities. The headline numbers had been tracking negative for the past three months, which everyone was pretty much ok with chalking up to crude oil. Just so long as GDP growth came in respectably, there wasn’t any reason to panic.
But core CPI (ex-food and energy costs) was already lagging behind Fed goals of around 2%, and already in the midst of sending deflationary ripples up the global goods chain, into…well, just about everything.
Muddled Waters for First Rate Hike
It’s created a tense chess match between investors and the Fed the past few weeks. It started just after the stellar (as in +295,000) February jobs report last month, when the consensus started to form that the Fed would have to act sooner rather than later in creating a interest rate normalization cycle.
The key first step of that cycle is getting us off the floor of zero percent rates – a stance that doesn’t befit a growing economy and presents what Yellen herself has called an “asymmetrical risk”.
U.S. Definitely Growing…But How Much?
Just as soon as we seemed to have some headway into a summer rate increase, nearly every economic indicator in the U.S. started been printing well below analyst estimates. In fact, the depth of our misses has hit a multi-year high, according to Bloomberg analysis:
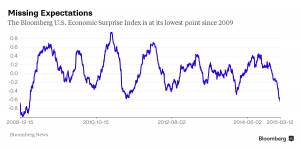
In light of this reversal, both investors and the Fed have had to take stock of things. First quarter GDP estimates continue to be ratcheted down – from the 2.5% – 3.0% level I highlighted last month (a number that was freshly lowered at the time) to an average Q1 GDP estimate of about 1.5% today.
Cranky Markets are Volatile Markets
It’s why we’ve seen a spike in volatility around every asset class – fixed income, forex, commodities, and equities have all been bumping around trying to align their compass to the next clear trend line. Would the Fed remove “patient” in the March FOMC meeting? Was September the new June (for the first rate hike)? Was 2015 off the table entirely?
Answering these questions is challenging enough in isolation, but it’s been exacerbated by the stunning rise the the USD index, which alters true price action in commodities and long bonds. The surging U.S. dollar is a de facto rate hike. It lowers the cost of imports dramatically (a deflationary force), and it makes our exports more expensive overseas.
And while the realities of pricier U.S. exports certainly hurt some companies more than others, the simple fact is that close to 50% of the total revenues of the S&P 500 member companies is derived in a currency other than the U.S. dollar.
2014, Part Deux?
It’s quite astonishing how much the first quarter of this year is looking like the first quarter of last year. Tick by tick, indicator by indicator, we seem to be replicating that market environment.
This time last year we were watching interest rates hit new lows, but convinced the party had to end any moment – inflation was coming, and we needed to position ourselves away from fixed income and into equities, gold, and other commodities. Fixed income turned out to deliver stronger returns than even equities did.
GDP looked to be on track for a good start to the year, but then a bout of really bad whether caused us to actually contract as an economy in Q1. Most of the top analysts said “don’t worry, we’ll be strong in the back half of the year”, and sure enough we were. The U.S. turned in over 4.5% growth in the next two quarters.
Looking around today, it’s much the same setup – so far. The key differences between then and now are this:
1) the unemployment rate is lower than last year; we have clearly moved close enough to full unemployment in the Fed’s eyes that it’s no longer an impediment to a rate increase. That box is checked off.
2) the USD is much stronger (10-20% or more) against every major global currency. As I’ve discussed, this move alone is the equivalent of a 25-50 bps rate hike.
In fact, if the dollar hadn’t been zooming so hard the past six months, there’s a chance the Fed would’ve put a token 25bp hike out there last week. Instead, Yellen reminded us that the Fed isn’t there to make things easy for investors, saying the Fed “can’t provide and shouldn’t provide” certainly to markets when it comes to the timing of rate hikes.
We don’t seem to be in any danger of that.
by Andrew | Mar 6, 2015 | BLS, CPI, Inflation
Inflation is one of the most important economic indicators available to consumers and investors as it gives a strong signal how the economy is currently performing, and perhaps more importantly, a strong hint at which way monetary policy is likely to swing in the coming months. The Federal Reserve analyzes inflation trends in detail, and any sign that inflation is getting either too high, or too low will often be met with a swift policy response; usually an increase or decrease in interest rates. Changes in interest rates affect every aspect of the economy including mortgages, student loans, business loans, savings accounts, and government debt.
In light of this, it is crucial that you gain a strong handle on the numerous ways that inflation is measured in order to give yourself an insight into the potential direction of monetary policy at the Federal Reserve, and how such policies are likely to impact you as an individual. Althought we use the CPI for the sake of our calculator, we understand that there are various other ways to calculate inflation and each way has its pros and cons…
Official Government Inflation Measures: CPI and PPI
The Bureau of Labor Statistics has the unenviable task of producing inflation statistics within the United States. They do this by collating a vast series of data from the economy in order to produce two key inflation indicators – namely the Consumer Price Index and the Producer Price Index.
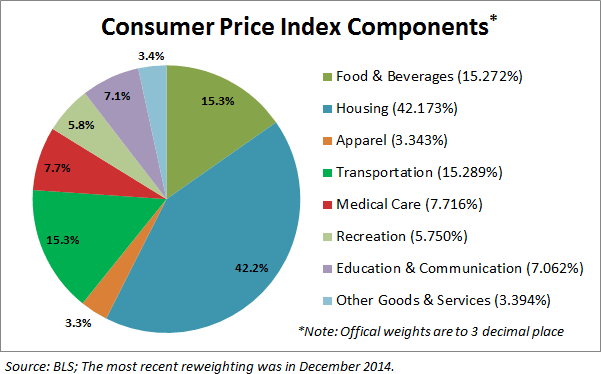
The Consumer Price Index (CPI), is a measure of price changes in a vast array of consumer goods and services. The CPI measures price change in the most popular products and services purchased by American consumers (basket of goods and services). The CPI is often used a reference point for wage adjustment purposes. The CPI is crucial to monitor as it highlights how much the purchasing power of the dollar increases or decreases. This has wide reaching implications throughout the economy.
Producer Price Indexes (PPI) – are a collection of indexes that measure the average change of selling prices by domestic producers of goods and services. PPI is often followed closely by market analysts as an early indicator of changing trends within the economy. Falling producer prices mean businesses are finding it is difficult to sell their products and are often offering heavy discounts. This can lead to potentially deflationary spirals which plunge the while economy into recession.
Official Government statistics are viewed with skepticism by some parts of the investment community – it is believed that the BLS and the Government have an incentive to “massage” the official inflation figures to suit their own economic message or agenda. Often these analysts and market commentators will use alternative indicators in an attempt to cut through any government bias.
Alternative Measures of Inflation
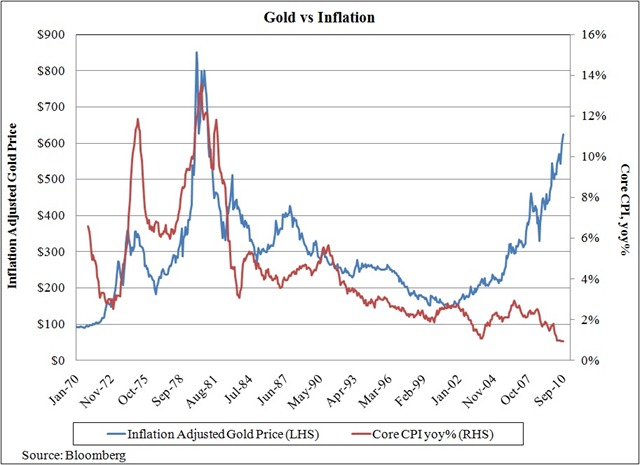
Gold has been an historically important indicator of inflation for thousands of years and is seen by many as the only real form of enduring money. The purchasing power of gold has endured throughout history without exception. In the past two centuries alone, the purchasing power of gold has held up through countless revolutions and two world wars, fiat currencies by contrast, have come and gone several times over! It is unsurprising therefore, that many investors and market commentators will look at the gold price to gain insight into the overall health of an economy. An elevated gold price highlights stress and distrust within the overall financial system, and a distrust with the monetary policy makers in general. Gold prices tend to rise if inflation is expected to increase. Gold overall is a valuable indicator for providing an inflation indicator free of government bias.
Growing distrust of official statistics has also given rise to independent organizations which keep track of their own data to generate inflation forecasts. One such organization is shadowstats.com which aims to cut through bias in government statistics and forecasting to provide a more balanced view of inflation within the economy.
Cover all Bases
As always, the devil is always in the detail. There is no single measure of inflation which you should accurately rely on to make decisions for your business, or investments. Increasing bias in Government statistics make it necessary to look beyond the official figures to gain a more comprehensive picture of what is really happening with regards to inflation. As we have discussed, by mastering all the different ways to monitor inflation, you will be able to make increasingly informed decisions and opinions.
Which measure of inflation do you like to use? Let us know by commenting below.
by Ryan Barnes | Feb 19, 2015 | CPI, Inflation
In a week where there wasn’t much in the way of high-impact macro data, I along with other inflation hounds was left to pore over what were some very diffuse Fed minutes yesterday. There seems to be a communication breakdown – figuratively and literally – in what was the longest minutes report in recent memory (over 8000 words!) yet also the hardest to interpret.
After all, the bond markets have been moving crazily; it seemed the smell of inflation was in the air following a strong jobs report and a 35 basis point rise in the benchmark 10-yr over a two week period.
Economy Cliff’s Notes
In a word, the FOMC minutes were dovish. Janet Yellen, her voting cohorts, and their staffs just can’t find enough data points to make a strong case for either inflation or broad growth. We clearly identified this reality last week, noting that things were becoming “more opaque by the day”. While there was a slight tickup in weekly pay, retails sales continues to print weak while headline and core CPI and PPI are well, well below the Fed’s 2%-ish target.
The Producer Price Index (PPI) for January came in yesterday at a 0.8% drop after a 1.1% annualized growth pace in December. Most vitally, we’re now on pace to turn in exactly zero growth Y/Y in the PPI. As with every inflation metric right now, it’s being thrown off kilter by the fall in crude oil.
For now, macro analysts like Michael Hanson over at BofA Merrill are saying that while we may see negative headline inflation, it’s “probably not deflation” as seen by the Fed. This is backed up by recent comments from Yellen, who has called the spike down in energy prices as “transitory”, while Philadelphia Fed President Charles Plosser noted that “I don’t see deflation as a risk in the U.S. economy”.
Rock and a Hard Place – Stuck in the Middle With You
I’m in the camp with most people who believe that the Fed would love nothing more than to get at least 1-2 rate hikes passed along this year. They would love to get the credit markets operating in a more normalized capacity, and they would certainly love to have the extra arrows in the quiver that a 0.5% – 1% Fed Funds rate would provide.
This stance doesn’t require one to be a hawk or a dove; it’s just good business for the Fed to have a full set of levers at their disposal. But there is real damage that could be done to the long-term viability of the Fed if they were to raise rates this summer, only to find that GDP growth has vanished and they’re forced to re-cut rates.
And as I noted last week, there is a very fine line there. The PPI results will in many ways flow through to the CPI over the next few months, and as I write this crude oil is down another 4% or so today and we may see the largest crude inventory build in history later Thursday.
As it stands now, we are the only advanced economy on the planet that is forecasting a rate increase in 2015. Granted, we are also the healthiest, so there’s a case to be made that we should be the first ones out of the gate. But for now, the Fed is admittedly (for the first time in over a year) looking overseas at risks in China and the Middle East, and even looking with some fear at the fixed income ETF market, of all places.
Investor Implications
It’s prudent for the Fed to be considering the near-term impact of falling commodities, just as it’s prudent to see them within the context of stagnant global growth. Neither are tasks we wish the Fed was spending so much time on, but the times are what they are; there’s not exactly a dog-eared playbook of what to do at this point. Just a compass.
Anybody that is out there with a strong opinion on whether the Fed is doing the right thing will have to cherry pick their metrics and indicators to prove their position. Fed Funds futures bettors scaled back their odds for a June rate hike, following the “let’s punt the ball” tone of the January FOMC minutes.
I tend to agree with a couple of analysts that have suggested the surging U.S. Dollar is a de facto rate increase already, as it will push down our exports a bit. In the meantime, the Fed – like the rest of us – will sit and wait to see if GDP is hanging in there. This continues to look a lot like Goldilocks for equities, just like the past few years.
by Ryan Barnes | Feb 13, 2015 | CPI, Inflation
The U.S. inflation picture is becoming more opaque by the day, which creates a lot of difficulty because it’s the most important variable out there – and not just to the fixed income markets. More so than at any time in recent memory, in order to read the pulse of domestic inflation I’m forced to take into consideration the entire global canvas – which for better or worse is same thing the Fed and central banks around the world are doing.
China showed up with an awful CPI/PPI print earlier this week, reaching a 5-year low on the CPI with a 0.8% January reading. The PPI continues to show accelerating declines, down 4.3% in January after a 2.7% drop in December and a 2.2% dip in November. Inside that PPI number are a 17.5% drop in mining, 9.6% in ferrous metals and 10% in fuel & power.
These advance readings don’t speak well at all to the headline figures we’ll be seeing in the U.S. over the next few months. We already know that GDP is decelerating in China, which (due to their giant nominal consumption) will put continued downward pressure on the whole commodity complex.
Europe, meanwhile, is in full-blown deflationary mode, printing a headline of (-.06%) in January, with a core reading of 0.6%. Bank of England Governor Mark Carney spoke about inflation today after their board decided unanimously to keep rates steady (their two previous holdouts backed out of their hawkish stance this month).
He noted,
“We’re going to have a period where headline inflation is low – very low – for most of this year, and that’s a good thing in general because of the causes of it. It’s not a good thing if it persists though.”
Real Uptick or Headfake?
Inflation expectations ticked up here at home to start the week, following a tremendously strong jobs report. The most important metric in the report was the 0.5% rise in hourly wages; we needed to see a rebound here after a weak December print, and to stay near the 2% – 2.3% pace that’s been maintained since the recovery began.
Janet Yellen has said in public comments that wage growth is a key metric the Fed is tracking, along with Personal Consumption (which they prefer over retail spending, per se). The Fed has taken a short-term policy stand that they’re willing to “look through” the headline drops in CPI, and treat them as transitory.
But as I noted last month, “…at present, we aren’t just tracking a little bit below the Fed’s target of 2% core inflation – we are well below it. And that’s assuming the Fed really does want to exclude the food and energy components entirely – which to their credit is precisely what they did when those components were volatile to the upside a few years ago.”
The broad consensus is that yes, the headline figures will show a big deflationary effect the next few months, but the net net effect on consumer spending and GDP will outweigh the negative effect of lower import prices and higher export prices. This stands to reason, as we are an economy driven 70% by consumer spending and just 13% by exports.
Retail Sales Yet to Confirm
But (isn’t there always one of those?), it’s sure been taking longer than most analysts expected to see the effects of the “oil tax cut” on consumer spending. The Retail Sales report came in weaker than expected this morning, down 0.8% in January, vs. expectations for a 0.4% drop. This comes on the back of a 0.9% headline drop in December, which was not adjusted in today’s release.
Yes, of course a lot of this is gas-related, as the YoY change in gas station receipts now stands at -23.5% following a 9.3% drop in January. The next biggest category decline was a 2.6% monthly drop for the group including sporting goods, hobby, book, and music sales.
Partially balancing that out are food services receipts that were up 11.3% YoY, while auto dealers saw sales rise greater than 10% in the past year.
But if we back out the main volatiles – automobiles, gas, building materials, and food services – we still tracked barely above the flatline at 0.1% growth, vs. expectations for a 0.4% increase. So far, the billions we’re saving at the pump don’t seem to be flowing back into discretionary items.
A few analysts have already made comments this morning to the effect of, “we’re not worried, the setup is all there, and we’ll see it reflected soon in the spending numbers”. And Credit Suisse noted that “inflation is falling sharply…the picture in real terms will not be as bleak”. This is most certainly going to be the case, all else being equal, but not the best opening argument for an economy trying to grow 3% this year.
Q1 Coming Down
We’re already far enough into Q1 that GDP numbers for the quarter need to start coming down. J.P. Morgan reduced to 2.5% annualized this morning (from 3%), while Barclay’s came down to 2.2%.
My own models are pegged at 2.5% right now, which is basically just a punt from last year. If we in the U.S. are to overcome all of this and hit the 2.7-2.8% GDP numbers most have modeled for the year, the Fed just may have to back off its intention to get a rate hike or two passed along in 2015. The backing off may become more telegraphed if the prevailing trend in leading indicators continues, and/or in the event that commodities fail to stabilize.
Investor Implications
In fixed income land this is all priority #1; many bystanders have been waiting around for two years now for bond markets to sell off; instead the run for the ages just keeps on going. The trade has gotten very crowded, which may explain why the Friday jobs report seemed to have such an immediate impact on the bond markets, where the inflation breakeven point rose about 35 basis points in just a few trading sessions. It still sits (un?)comfortably below the Fed’s 2% inflation target:
But equity investors like me need to wrap our heads around the inflation trends too, as it drives global asset allocations. The strong dollar pretty much guarantees that our markets will continue to see inflows, but we’ve had almost two straight years of a Goldilocks setup as rates slowly ticked lower and earnings yields trounced bond yields. The best case scenario for stocks – and most domestic bond classes for that matter – is that we’ll repeat that setup for a third year. But it’s a very fine line we’re treading.