The U.S. inflation picture is becoming more opaque by the day, which creates a lot of difficulty because it’s the most important variable out there – and not just to the fixed income markets. More so than at any time in recent memory, in order to read the pulse of domestic inflation I’m forced to take into consideration the entire global canvas – which for better or worse is same thing the Fed and central banks around the world are doing.
China showed up with an awful CPI/PPI print earlier this week, reaching a 5-year low on the CPI with a 0.8% January reading. The PPI continues to show accelerating declines, down 4.3% in January after a 2.7% drop in December and a 2.2% dip in November. Inside that PPI number are a 17.5% drop in mining, 9.6% in ferrous metals and 10% in fuel & power.
These advance readings don’t speak well at all to the headline figures we’ll be seeing in the U.S. over the next few months. We already know that GDP is decelerating in China, which (due to their giant nominal consumption) will put continued downward pressure on the whole commodity complex.
Europe, meanwhile, is in full-blown deflationary mode, printing a headline of (-.06%) in January, with a core reading of 0.6%. Bank of England Governor Mark Carney spoke about inflation today after their board decided unanimously to keep rates steady (their two previous holdouts backed out of their hawkish stance this month).
He noted,
“We’re going to have a period where headline inflation is low – very low – for most of this year, and that’s a good thing in general because of the causes of it. It’s not a good thing if it persists though.”
Real Uptick or Headfake?
Inflation expectations ticked up here at home to start the week, following a tremendously strong jobs report. The most important metric in the report was the 0.5% rise in hourly wages; we needed to see a rebound here after a weak December print, and to stay near the 2% – 2.3% pace that’s been maintained since the recovery began.
Janet Yellen has said in public comments that wage growth is a key metric the Fed is tracking, along with Personal Consumption (which they prefer over retail spending, per se). The Fed has taken a short-term policy stand that they’re willing to “look through” the headline drops in CPI, and treat them as transitory.
But as I noted last month, “…at present, we aren’t just tracking a little bit below the Fed’s target of 2% core inflation – we are well below it. And that’s assuming the Fed really does want to exclude the food and energy components entirely – which to their credit is precisely what they did when those components were volatile to the upside a few years ago.”
The broad consensus is that yes, the headline figures will show a big deflationary effect the next few months, but the net net effect on consumer spending and GDP will outweigh the negative effect of lower import prices and higher export prices. This stands to reason, as we are an economy driven 70% by consumer spending and just 13% by exports.
Retail Sales Yet to Confirm
But (isn’t there always one of those?), it’s sure been taking longer than most analysts expected to see the effects of the “oil tax cut” on consumer spending. The Retail Sales report came in weaker than expected this morning, down 0.8% in January, vs. expectations for a 0.4% drop. This comes on the back of a 0.9% headline drop in December, which was not adjusted in today’s release.
Yes, of course a lot of this is gas-related, as the YoY change in gas station receipts now stands at -23.5% following a 9.3% drop in January. The next biggest category decline was a 2.6% monthly drop for the group including sporting goods, hobby, book, and music sales.
Partially balancing that out are food services receipts that were up 11.3% YoY, while auto dealers saw sales rise greater than 10% in the past year.
But if we back out the main volatiles – automobiles, gas, building materials, and food services – we still tracked barely above the flatline at 0.1% growth, vs. expectations for a 0.4% increase. So far, the billions we’re saving at the pump don’t seem to be flowing back into discretionary items.
A few analysts have already made comments this morning to the effect of, “we’re not worried, the setup is all there, and we’ll see it reflected soon in the spending numbers”. And Credit Suisse noted that “inflation is falling sharply…the picture in real terms will not be as bleak”. This is most certainly going to be the case, all else being equal, but not the best opening argument for an economy trying to grow 3% this year.
Q1 Coming Down
We’re already far enough into Q1 that GDP numbers for the quarter need to start coming down. J.P. Morgan reduced to 2.5% annualized this morning (from 3%), while Barclay’s came down to 2.2%.
My own models are pegged at 2.5% right now, which is basically just a punt from last year. If we in the U.S. are to overcome all of this and hit the 2.7-2.8% GDP numbers most have modeled for the year, the Fed just may have to back off its intention to get a rate hike or two passed along in 2015. The backing off may become more telegraphed if the prevailing trend in leading indicators continues, and/or in the event that commodities fail to stabilize.
Investor Implications
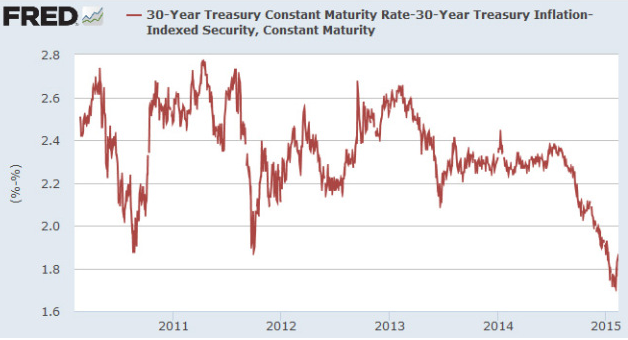
In fixed income land this is all priority #1; many bystanders have been waiting around for two years now for bond markets to sell off; instead the run for the ages just keeps on going. The trade has gotten very crowded, which may explain why the Friday jobs report seemed to have such an immediate impact on the bond markets, where the inflation breakeven point rose about 35 basis points in just a few trading sessions. It still sits (un?)comfortably below the Fed’s 2% inflation target:
But equity investors like me need to wrap our heads around the inflation trends too, as it drives global asset allocations. The strong dollar pretty much guarantees that our markets will continue to see inflows, but we’ve had almost two straight years of a Goldilocks setup as rates slowly ticked lower and earnings yields trounced bond yields. The best case scenario for stocks – and most domestic bond classes for that matter – is that we’ll repeat that setup for a third year. But it’s a very fine line we’re treading.


Ryan is a financial analyst & forecaster. He has 20 years of experience in asset modeling, investment analysis/general dd, portfolio management, and macroeconomic analysis. To that end, he has worked extensively with equities, fixed income, commodities, private equity, currencies, and derivative products. His commentary and educational library appear on Investopedia.com, and analysis has appeared in Barron’s, WSJ.com, TheStreet.com, and Forbes.com.