by Alex Demolitor | Nov 13, 2024 | Definitions
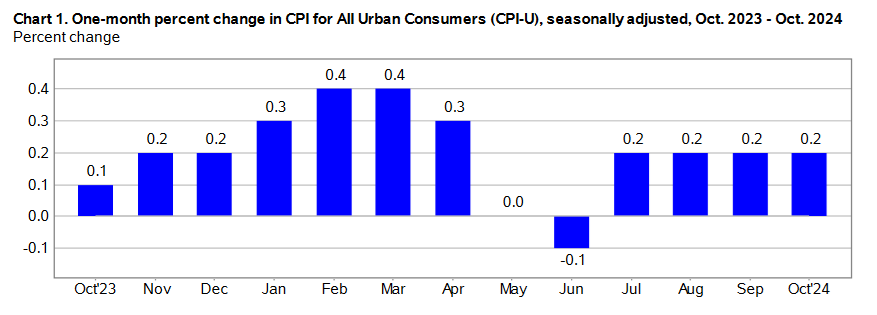
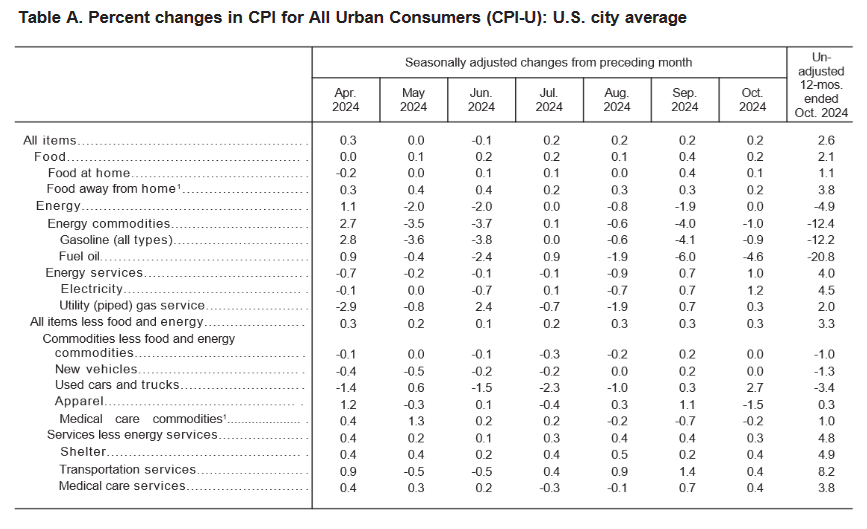
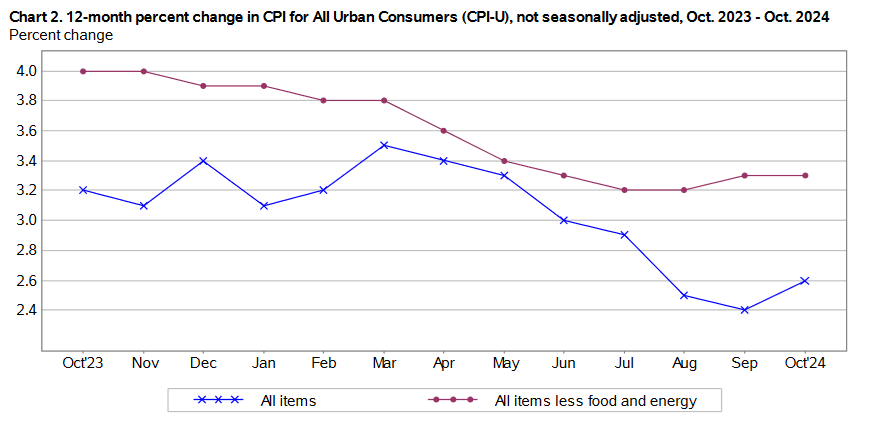
The October 2024 Consumer Price Index of All Urban Consumers (CPI-U) report indicates that inflation increased by 0.2% for the month, matching July, August, and September’s 0.2% rise. These data were released at 8:30 am EST on Wednesday, November 13, 2024, by the Bureau of Labor Statistics. Before seasonal adjustment, the year-over-year (Y-o-Y) inflation rate in the all-items index grew by 2.6%, a slight uptick from the 2.4% witnessed in September.
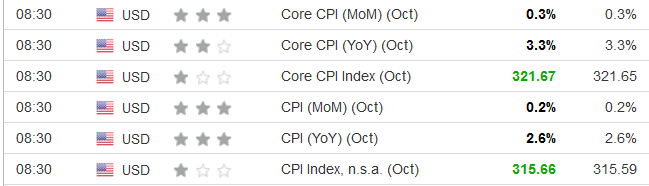
Despite that, the CPI data mostly matched economists’ estimates. The table below is courtesy of Investing.com. The left column represents October’s figures, while the right column represents forecasters’ expectations. Outside of the index levels (marked in green), the rest of the results (marked in black) aligned with the consensus.
This is welcome news to FOMC Chairman Jerome Powell. The committee’s decision to cut interest rates by 25 basis points on Nov. 7 should avoid scrutiny as the inflation results may calm fears of another price acceleration. He said during his post-meeting press conference:
“Inflation has moved down a great deal from its highs of two years ago, and we judge, as I mentioned, that it’s on a sustainable path back to 2%. The job’s not done on inflation, but we judged in September that it was appropriate to begin to recalibrate our policy stance to reflect this progress, and today’s decision is really another step in that process.”
He added:
“We’re not declaring victory, obviously, but we feel like the story is very consistent with inflation, continuing to come down on a bumpy path over the next couple of years and settling around 2%. That story is intact, and it won’t be one or two really good data months or bad data months aren’t going to really change the pattern at this point now that we’re this far into the process.”
As a result, while October’s CPI data is another chapter in Powell’s inflation story, the momentum continues to trend in a positive direction.
Most headline inflation metrics were well-behaved in October, with only used cars and trucks and electricity increasing by 2.7% and 1.2% month-over-month. Core inflation (which excludes the impacts of food and energy), rose by 0.3% in October, matching August and September’s print. But, the shelter index rose by 0.4%, a noticeable increase from the 0.2% reported in September.
Food Prices
The food index showcased progress in October, rising by 0.2%, and declining from September’s 0.4% print. Five of the six major grocery store food indexes increased:
- Cereals and bakery products (+1.0%)
- Meats, poultry, fish, and eggs (-1.2%)
- Dairy and related products (+1.0%)
- Fruits and vegetables (+0.4%)
- Nonalcoholic beverages (+0.4%)
- Other food at home (+0.1%)
In addition, the food away from home index rose by 0.2% — a decline from August and September — which means restaurant prices largely tracked overall inflation in October.
Energy Prices
The energy index was flat in October after declining by 1.9% in September. Gasoline prices dropped by 0.9% (1.9% without seasonal adjustments), while electricity and natural gas prices rose by 1.2% and 0.3%, respectively.
Core CPI October 2024
The October core CPI rose by 0.3% month-over-month and 3.3% Y-o-Y. Below is an itemized breakdown of the main price fluctuations seen in the core CPI reading:
- Shelter index: (+0.4%) [September: +0.2%]
- Rent index: (+0.3%) [September: +0.3%]
- Owners’ equivalent rent: (+0.4%) [September: +0.3%]
- Motor vehicle insurance: (-0.1%) [September: +1.2%]
- Medical care services: (+0.4%) [September: +0.7%]
- Physician services: (+0.5%) [September: +0.9%]
- Hospital services: (+0.5%) [NA]
- Airline fares: (+3.2%) [September: +3.2%]
Seasonally Unadjusted CPI Data for October 2024
Before seasonal adjustments, the CPI-U for October 2024 increased by 2.6% Y-o-Y, rising to an index level of 315.664. Since these figures are unadjusted, they include regular seasonal price fluctuations that can create volatility in the results.
More Cuts to Come?
While investors are eager for rate cuts and a return to pre-pandemic monetary policy, Powell cautioned that the ebbs and flows of economic data will decide the FOMC’s future path.
“Nothing in the economic data suggests that the committee has any need to be in a hurry to get there,” he said. “We are seeing strong economic activity, we are seeing ongoing strength in the labor market; we’re watching that carefully. But we do see maintaining strength there. And so we think that the right way to find neutral, if you will, is carefully, patiently.”
He added:
“The precise timing of these things is not as important as the overall arc of them, and the arc of them is to move from where we are now to the sense of neutral, a more neutral policy. We don’t know exactly where that is, we only know it by its works. We’re pretty sure it’s below where we are now.”
So, while resilient economic data allows Powell to take a patient approach, the long-term trend should eventually produce lower rates in the months ahead.
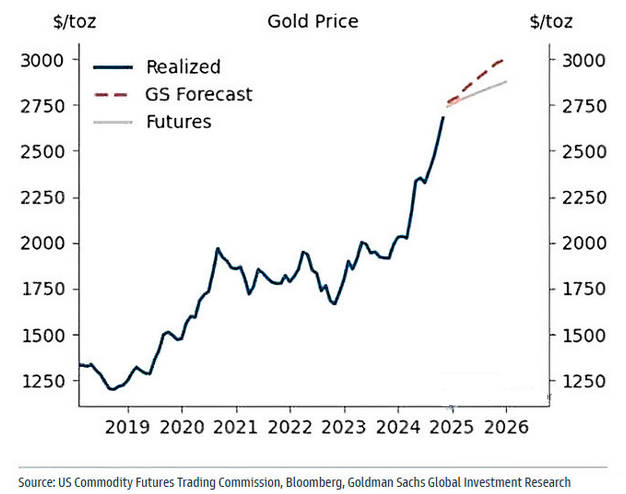
In the meantime, a major divergence for risk assets unfolded following the Nov. 6 U.S. Presidential election. Bitcoin and Ethereum soared, while gold and silver sold off. However, the U.S. dollar was a major beneficiary, and gold often has a negative correlation with the greenback.
Yet, the short-term correction should give way to higher prices over time, as Goldman Sachs forecasts gold will hit $3,000 in 2025. The blue line below tracks gold’s price path, while the gray line at the top measures the implied futures price, and the dotted red line measures Goldman Sachs’ forecasted price. As you can see, the investment bank is more bullish than the futures market and expects gold to outperform for the foreseeable future.
Are you thinking about diversifying into precious metals? Talk to your financial advisor about initiating a gold IRA account today, allowing you to invest in this red-hot asset on a tax-advantaged basis. Additionally, our complimentary CPI inflation calculator remains at your disposal, enabling you to assess inflation’s impact on your finances. Remember, seek the guidance of a financial advisor before making any investment decision.

by Amine Rahal | Jun 30, 2023 | Definitions, Inflation
In the realm of economics, three terms often crop up in discussions about the health of an economy: inflation, recession, and depression. While they are interconnected in various ways, each term represents a distinct economic phenomenon with different implications for the economy and, by extension, for investors, businesses, and consumers. This article will delve into the definitions of inflation, recession, and depression and explore how they are linked. Let’s start by looking at a comparison table:
|
Inflation |
Recession |
Depression |
| Definition |
General increase in prices. |
Significant decline in economic activity, typically for two quarters or more. |
Severe and prolonged downturn in economic activity. |
| Impact on Economy |
Decreases purchasing power. Can stimulate economic activity when moderate, but leads to instability when too high. |
Results in higher unemployment, decreased consumer spending, and economic slowdown. |
Severe declines in employment and production, often causing significant economic hardship. |
| Common Causes |
Excessive growth in the money supply, demand-pull, or cost-push factors. |
Various, including financial crises, economic bubbles, or external shocks. |
Often a severe or prolonged recession, but can also be caused by a financial crisis or large-scale economic dislocation. |
| Central Bank Response |
May raise interest rates to slow economic activity and curb inflation. |
May lower interest rates and increase government spending to stimulate economic activity. |
Similar to recession, but response typically needs to be larger and more sustained. May involve significant fiscal policy responses as well. |
| Link to Other Two Terms |
High inflation can lead to a recession. Recession can lead to low inflation or deflation. |
Can turn into depression if severe and prolonged. Lower demand during a recession can lead to lower inflation. |
Could lead to deflation due to lower demand. However, policy responses could potentially lead to inflation. |
Inflation
Inflation is the rate at which the general level of prices for goods and services is rising, eroding purchasing power. In other words, as inflation increases, each unit of currency buys fewer goods and services. Inflation is updated monthly.
Moderate inflation is typical in a growing economy and can even stimulate economic activity. However, if it gets out of hand, it can lead to economic instability. The BLS uses the CPI to measure inflation.
The Federal Reserve, like most central banks, aims to control inflation by adjusting interest rates. Lower interest rates encourage spending and investment, which can boost economic activity and, potentially, inflation. Higher interest rates can slow economic activity and curb inflation.
Recession
A recession is typically defined as a significant decline in economic activity spread across the economy, lasting more than a few months. This is often seen in real GDP, real income, employment, industrial production, and wholesale-retail sales. Economists generally agree that two consecutive quarters of negative GDP growth indicate a recession.
Recessions can be caused by various factors, including financial crises, external shocks, and the bursting of economic bubbles. Policymakers often respond to recessions by lowering interest rates and increasing government spending, aiming to stimulate economic activity.
Depression
A depression represents a severe and prolonged downturn in economic activity. It’s more extended and more profound than a recession, characterized by significant declines in output, employment, and trade, often lasting several years. The most notable example is the Great Depression of the 1930s.
Depressions are rare, and economists don’t have a standardized definition like they do for a recession. However, they generally agree that depressions involve a substantial contraction in economic activity that lasts several years.
How Are They Linked?
Inflation, recession, and depression are intertwined in many ways:
- Inflation and Recession: Too much inflation can lead to a recession. When prices rise too quickly (hyperinflation), consumers can struggle to afford goods and services, and businesses can find it challenging to plan for the future. If the central bank tries to combat high inflation by raising interest rates too quickly, it can cool the economy too much and lead to a recession.
- Recession and Inflation: On the flip side, recessions can lead to lower inflation or even deflation (a general decrease in prices). In a recession, demand for goods and services falls, which can lead to lower prices.
- Recession and Depression: If a recession is particularly severe and prolonged, it can turn into a depression. While there’s no strict dividing line, depressions involve higher unemployment, lower output, and more significant declines in standards of living than recessions.
- Inflation and Depression: Inflation rates during a depression can vary. Sometimes, depressions can involve deflation, as demand for goods and services falls and businesses lower prices to try to entice customers. However, economic policy responses to a depression could lead to inflation. For example, if the government responds by increasing the money supply or government spending dramatically, it could eventually lead to increased inflation.
In summary, inflation, recession, and depression are all interconnected elements of economic cycles. By understanding these terms and their relationships, we can better grasp the complexities of economic health and make
FAQ
Q1: What causes inflation? A1: Inflation can be caused by various factors, including excessive growth in the money supply, demand-pull inflation where demand for goods and services outpaces supply, or cost-push inflation where the cost of raw materials or wages increase.
Q2: How can inflation be controlled? A2: Central banks often aim to control inflation by adjusting interest rates. By raising interest rates, central banks can decrease borrowing and spending, thus reducing inflation. Conversely, lowering interest rates can stimulate borrowing and spending, potentially leading to increased inflation.
Q3: What are the signs of a coming recession? A3: Common signs of a coming recession include a decline in the GDP, higher unemployment rates, lower consumer spending, decrease in business profits, and a volatile stock market.
Q4: How can a recession affect the average person? A4: During a recession, people might face job loss or reduced working hours. They may also see the value of their investments decrease, and it could become harder to get credit.
Q5: What’s the difference between a recession and a depression? A5: The main difference between a recession and a depression is the duration and severity of the economic downturn. A recession is a temporary decline in economic activity, typically lasting six months to a year. A depression, on the other hand, is a severe and prolonged economic downturn, often lasting several years.
Q6: How do governments respond to a depression? A6: In a depression, governments may enact expansive fiscal policies, such as increasing government spending, cutting taxes, or both, to stimulate the economy. Central banks may also adopt expansionary monetary policies, such as lowering interest rates or implementing quantitative easing.
Q7: Can a depression lead to inflation? A7: A depression could potentially lead to deflation due to lower demand. However, the economic policy responses to a depression, such as increasing the money supply or government spending, could eventually lead to increased inflation.
Q8: How does a recession affect inflation? A8: A recession typically leads to lower inflation or even deflation. This is because, in a recession, the demand for goods and services falls, which can lead to lower prices. However, the specific impact on inflation can vary depending on the nature and severity of the recession, and the policy responses to it.
Q9: What role do central banks play in managing the economy through these cycles? A9: Central banks play a crucial role in managing the economy through inflation, recession, and depression. They often use tools like interest rates and open market operations to influence the money supply, aiming to stabilize prices and maintain low unemployment rates.
by Sarah Bauder | Jul 13, 2021 | CPI, Definitions
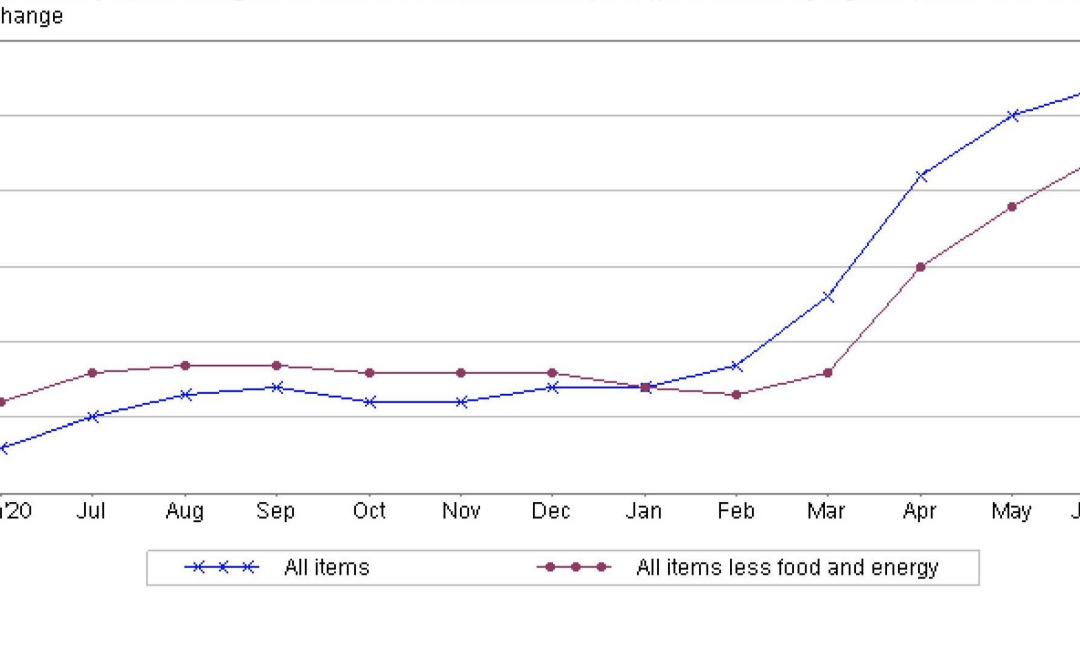
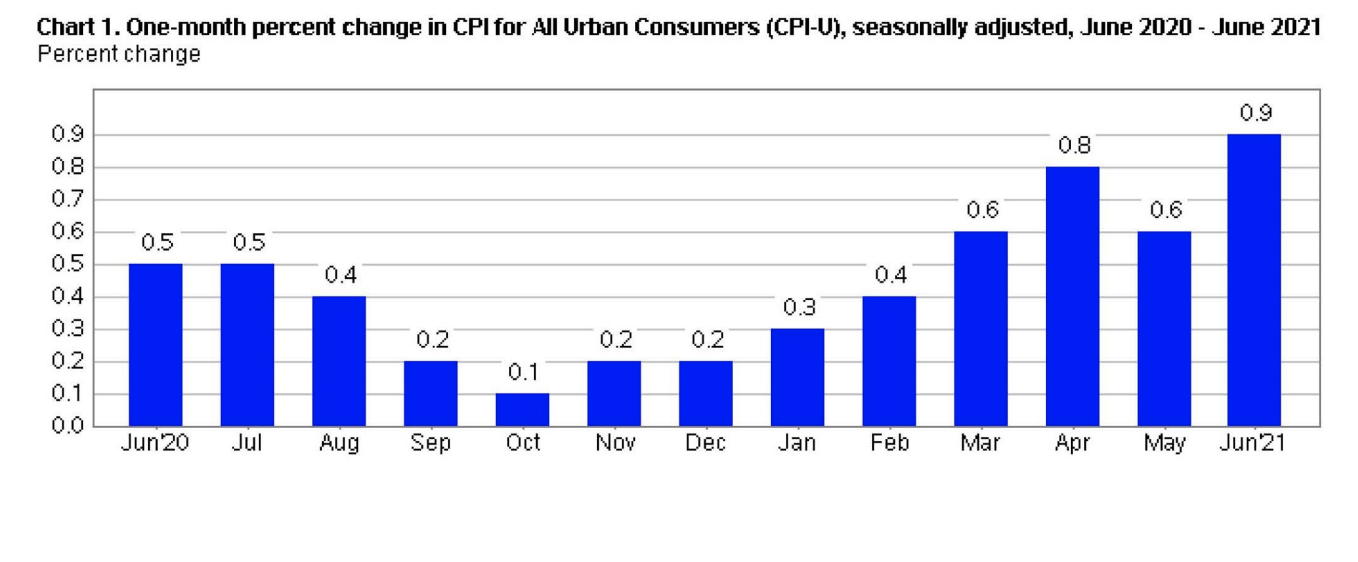
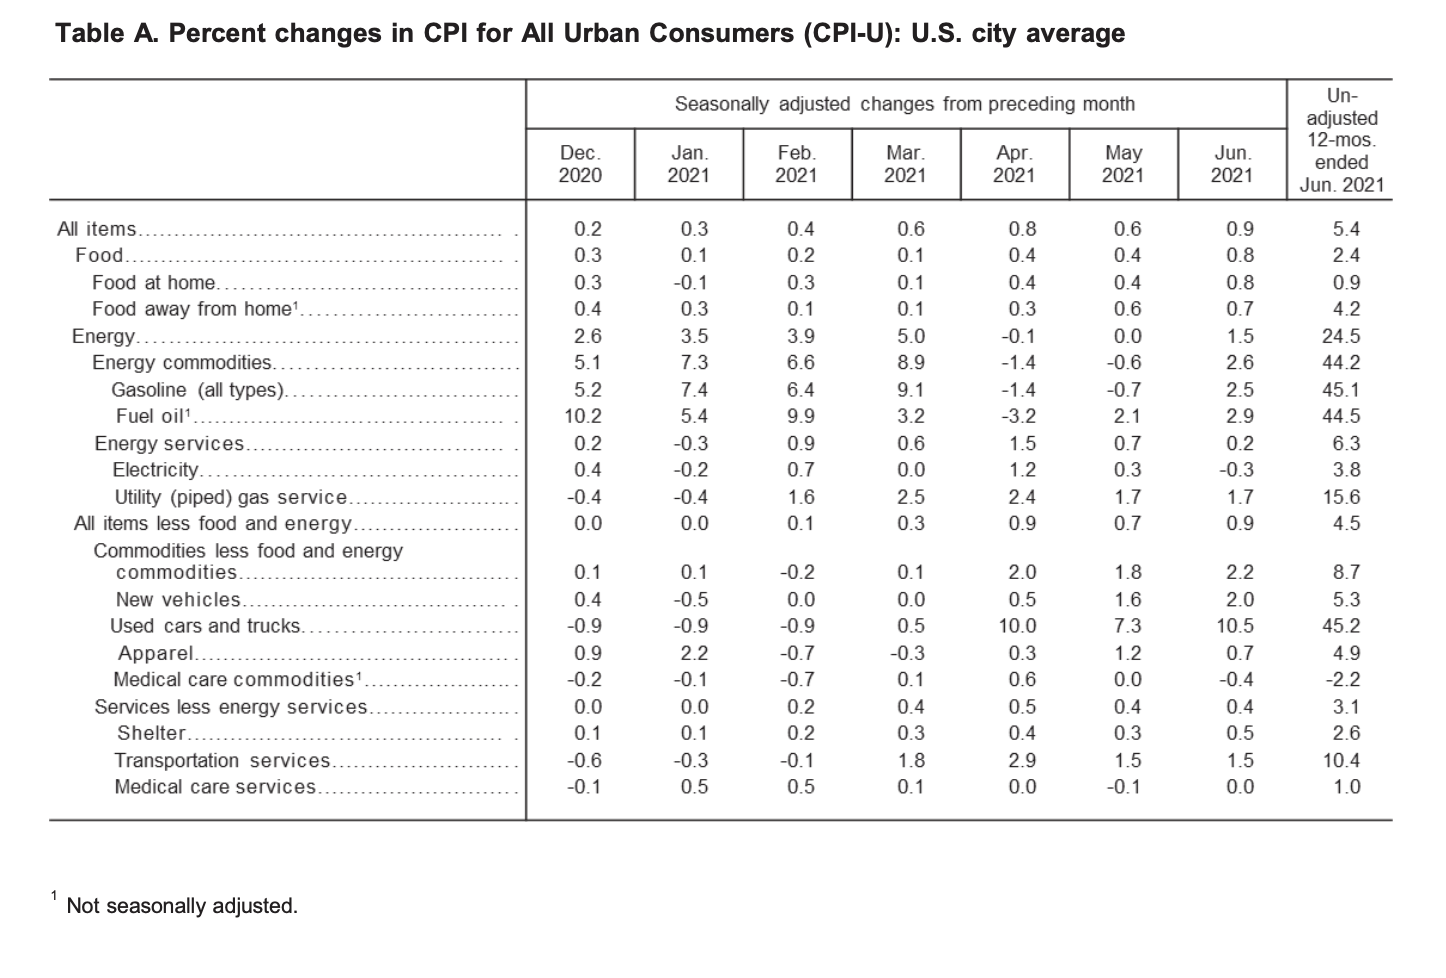
The Consumer Price Index for All Urban Consumers (CPI-U) edged up 0.9% in June on a seasonally adjusted basis, reported the US Bureau of Labor Statistics. In May, it had increased 0.6%.
“This was the largest 1-month change since June 2008 when the index rose 1%. Over the last 12 months, the all items index increased 5.4% before seasonal adjustment; this was the largest 12-month increase since a 5.4% increase for the period ending August 2008.” explained the bureau in its report.
(Source: U.S. Bureau of Labor Statistics)
Food
The index for food edged up 0.8% for the month. The index for food at home likewise increased 0.8% in June. Five of the six major grocery store category indexes all saw percentage increases over the month including the fruits and vegetables index by 0.7%, the index for meats, poultry, fish, and eggs by 2.5%, and the index for beef by 4.5%. The index for food away from home edged up 0.7% in June.
Over the last 12-month period, the food at home index rose 0.9%. All six of the component grocery store food group indexes saw percentage increases, with the fruits and vegetables index having the largest rise at 3.2%.
“The index for food away from home rose 4.2% over the last year, the largest 12-month increase in that index since the period ending in May 2009,” stated the US Bureau of Labor Statistics.
Energy
In June, the index of energy rose 1.5%. The index for gasoline rose 2.5% over the month. The price of gas increased 2.2%, prior to season adjustment. The natural gas index likewise increased 1.7%. Conversely, the index for electricity dropped 0.3% in June, after rising by 0.3% in May.
Since this time last year, the index for energy soared 24.5%. Over the last 12-month period, gas prices skyrocketed 45.1%. Likewise, the natural gas index increased 15.6%, and the electricity index rose 3.8% since this time last year.
(Source: U.S. Bureau of Labor Statistics)
All Items Less Food and Energy
In June, the index for all items less food and energy increased 0.9%. Several of the component indexes all saw increases over the month including the shelter index by 0.5%, the index for owners’ equivalent rent rose 0.3%, and the rent index edged up 0.2%.
“The index for used cars and trucks rose sharply for the third consecutive month, increasing 10.5% in June. This was the largest monthly increase ever reported for the used cars and trucks index, which was first published in January 1953,” explained the bureau in its report.
Over the last 12 month period, the all items less food and energy index increased 4.5%.
“The index for used cars and trucks increased 45.2%, the largest 12-month change ever reported for that index. The index for new vehicles rose 5.3% over the past 12 months, its largest 12-month increase since the period ending January 1987. The motor vehicle insurance index increased 11.3% in the last year, while the index for car and truck rental rose 87.7% over that period. The shelter index increased 2.6% over the last 12 months. The medical care index rose 0.4% over the past 12 months, its smallest 12-month increase since the period ending March 1941,” reported the US Bureau of Labor Statistics.
Source cited: https://www.bls.gov/news.release/archives/cpi_07132021.htm
by Sarah Bauder | Dec 10, 2020 | CPI, Definitions
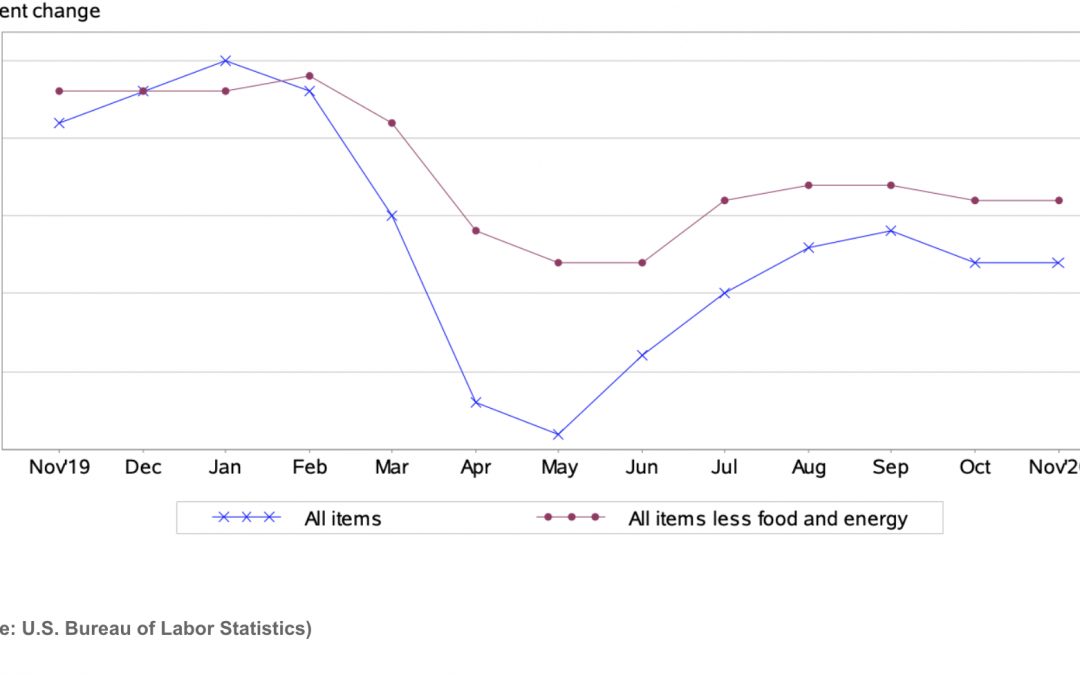
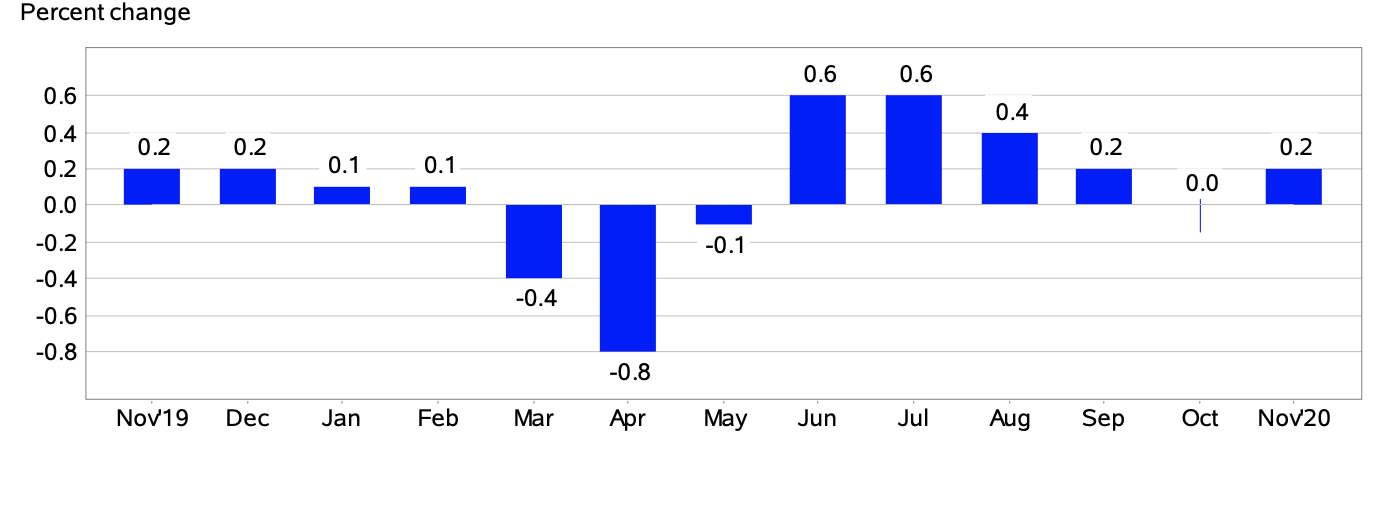
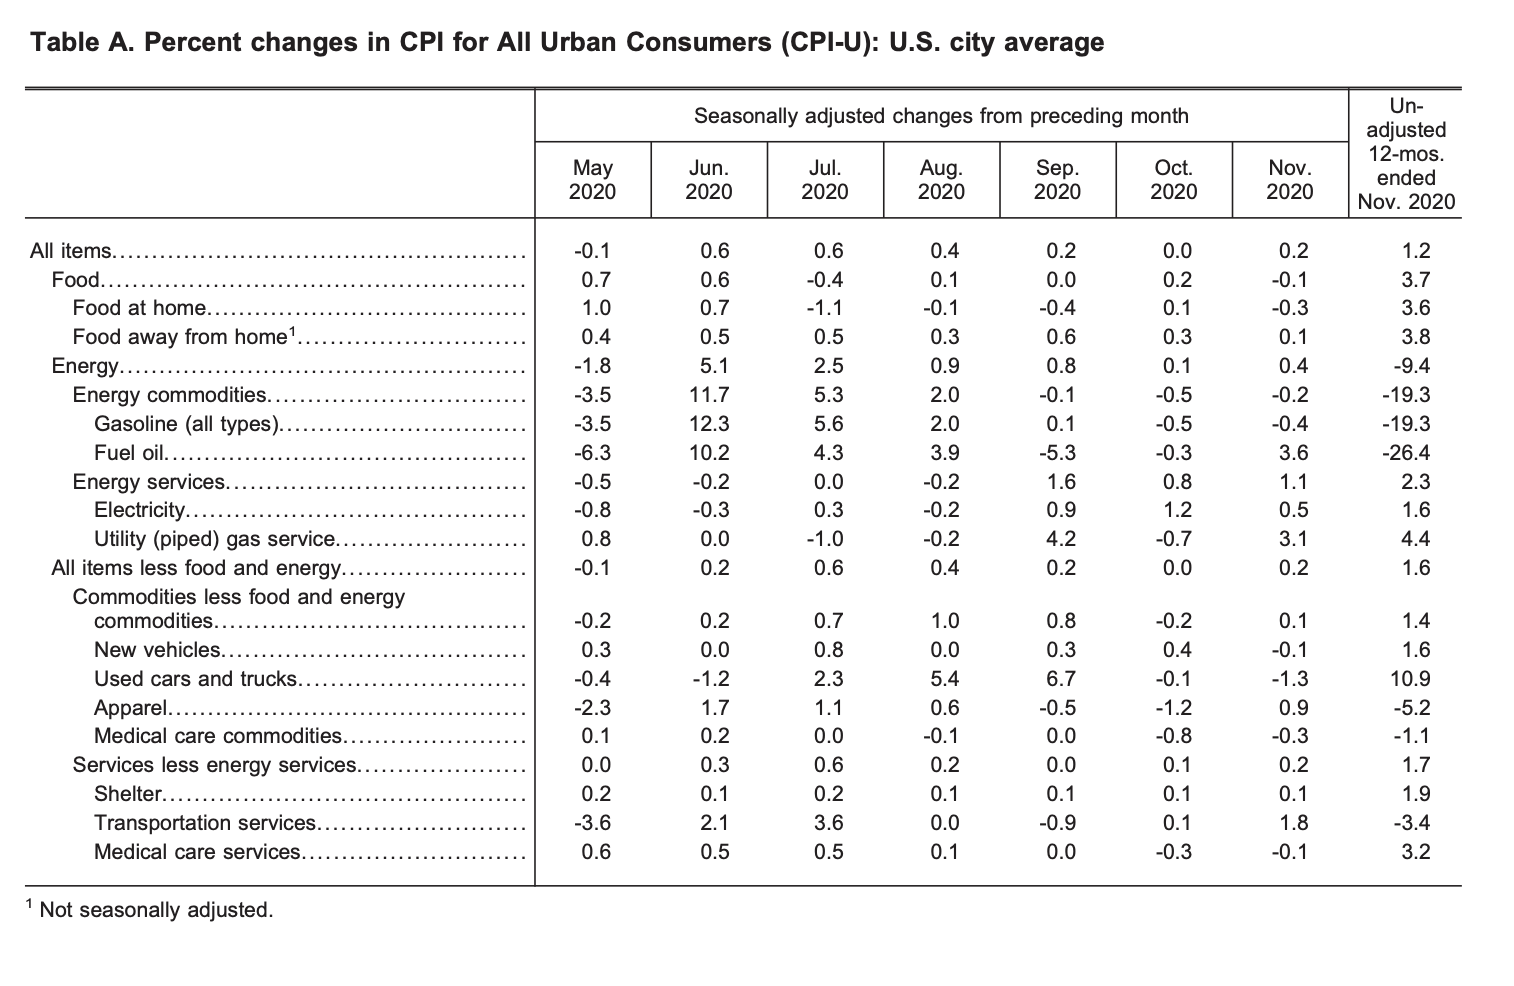
The Consumer Price Index for All Urban Consumers (CPI-U) edged up 0.2% in November, reported the U.S. Bureau of Labor Statistics. Before seasonal adjustment, the all items index increased 1.2% since this time last year.
(Source: U.S. Bureau of Labor Statistics)
Food Index
The index for food dropped 0.1% in November, after rising 0.2% the previous month. The food at home index decreased 0.3%.
“Major grocery store food group indexes were mixed in November. The index for nonalcoholic beverages fell 0.9 percent in November, its largest monthly decline since December 2010. The index for other food at home fell 0.6 percent in November, and the index for cereals and bakery products decreased 0.5 percent; both indexes increased in October,” reported the U.S. Bureau of Labor Statistics.
Over the past 12 month period, the food at home index rose 3.6%. All six major grocery store group indexes saw percentage increases since this time last year. The index for meats, poultry, fish, and eggs saw the largest percentage rise at 5.9%, with specifically the index for beef edging up 7.5% over the last 12 months. Likewise, the food away from home index increased by 3.8% over the same timeframe.
Energy Index
The index for energy increased 0.4% in November, marking the sixth consecutive monthly percentage rise. The indexes for natural gas, electricity, and fuel oil all rose, 3.1%, 0.5%, 3.6%, respectively.
“In contrast to these increases, the gasoline index declined for the second month in a row, falling 0.4%. Before seasonal adjustment, gasoline prices fell 2.7% in November,” stated the bureau in its report.
Over the last 12-month period, the energy index dropped 9.4%. The price of gasoline plunged 19.4%, and the index for fuel oil plummeted an astonishing 26.4% since this time last year. Conversely, the natural gas and electricity indexes rose 4.4% and 1.6%, respectively.
(Source: U.S. Bureau of Labor Statistics)
All Items Less Food and Energy
In November, the all items less food and energy index edged up 0.2%, reported the U.S. Bureau of Labor Statistics. Several component indexes saw percentage increases including the shelter index at 0.1%, the apparel index at 0.9%, airline fares at 3.5%, and motor vehicle insurance at 1.1%.
Over the last year, the all items less food and energy index increased by 1.6%. The index for shelter edged up 1.9% over the past 12-month span, as did the medical care index with a percentage increase of 2.4%.
“Despite the monthly increases in November, the indexes for apparel, airline fares, and motor vehicle insurance all declined over the past 12 months,” reported the U.S. Bureau of Labor Statistics.
The US Bureau of Labor Statistics released a statement on the impact of the COVID-19 pandemic for the November 2020 data collection:
“Data collection by personal visit for the Consumer Price Index (CPI) program has been suspended since March 16, 2020. When possible, data normally collected by personal visit were collected either online or by phone. Additionally, data collection in November was affected by the temporary closing or limited operations of certain types of establishments. These factors resulted in an increase in the number of prices considered temporarily unavailable and imputed. While the CPI program attempted to collect as much data as possible, many indexes are based on smaller amounts of collected prices than usual, and a small number of indexes that are normally published were not published this month. Additional information is available at www.bls.gov/covid19/effects-of-covid-19-pandemic-on-consumer-price-index.htm.”
Source cited: https://www.bls.gov/news.release/archives/cpi_12102020.htm
by Liam Hunt | Apr 10, 2020 | Definitions
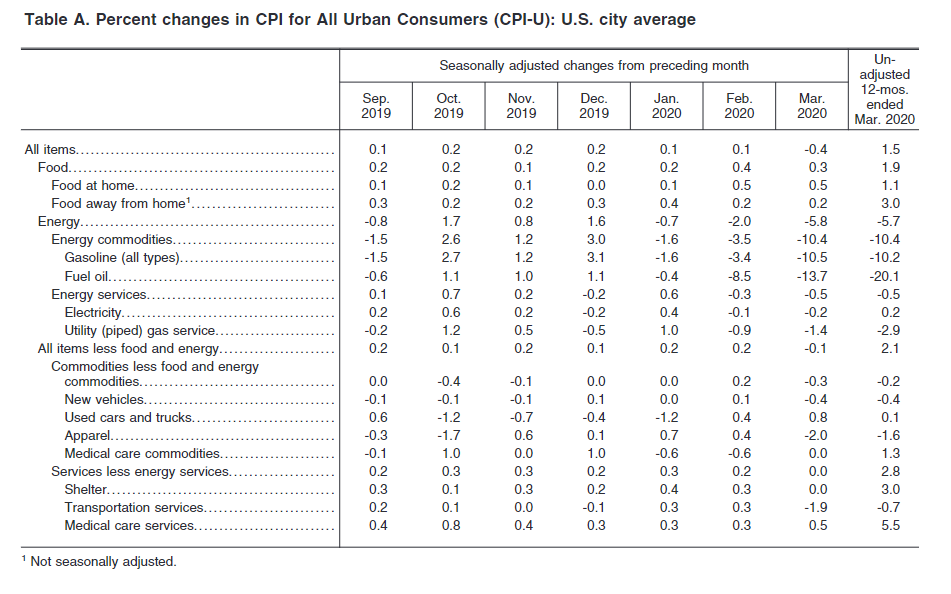
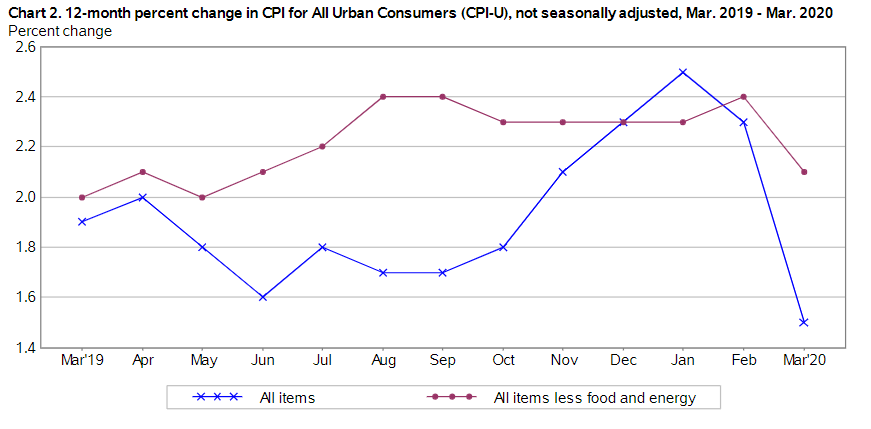
The Consumer Price Index for All Urban Consumers (CPI-U) dropped 0.4% in March according to a new summary report by the U.S. Bureau of Labor Statistics. The 0.4% drop in consumer prices is reported on a seasonally-adjusted basis, and represents the largest single-month decline since January 2015. From March 2019 to March 2020, the CPI-U increased 1.5% before adjustment and consumer prices rose 0.1% in both February and January.
(Source: U.S. Bureau of Labor Statistics)
The drop in U.S. consumer prices in March is led by two principal factors. First, the price of oil reaching 18-year lows due to reduced industrial and consumer demand in tandem with the ongoing Saudi-Russian oil price war. Second, a generally strained U.S. economy due to the Covid-19 pandemic.
(Source: U.S. Bureau of Labor Statistics)
Food Index
Despite a large overall drop in the CPI-U, the food index rose by 0.3% in March. This price movement represents a minor cool-down from February’s 0.4% increase in the food index. The Food at home index shot up 0.5%, which matches its growth in February.
In March, all six grocery store food group indexes increased during the month of March. Consumer prices for non-alcoholic beverages increased by 0.9% and the fruits and vegetables index rose 0.8% following a stagnant month in February.
The food away from home index rose a more modest 0.2% in March, which matches its February increase. The Labor Department reported that the index for food away from home rose 3.0% over the past year, and the food at home index rose by 1.1%.
All Items Less Food and Energy Index
In March, the index for all items less food and energy fell by 0.1%. The indexes for rent and owners’ equivalent rent edged up by a modest 0.3%, although these increases were offset by a 6.8% fall in the index for lodging away from home.
Although the airline fares index fell by only 0.3% in February, March saw a much more pronounced decline of 12.6%. After four consequent months of increases, the apparel index fell by 2.0% in March and the index for new consumer vehicles fell by 0.4% in March despite increasing through February.
The medical care index rose 0.4% in March amid the developing novel coronavirus pandemic. The physicians’ services index rose 0.3% while the hospital services index rose by 0.4% in March. The prescription drug index fell by 0.2%. In the past 12-month period, the index for all items less food and energy rose by 2.1%.
(Source: U.S. Bureau of Labor Statistics)
Energy Index
Notably, the U.S. energy index fell by 5.8% in March, marking its largest drop in over five years. The monthly decrease was led by a sharp drop in gasoline prices, as the gasoline index declined by 10.5% after seasonal adjustment.
Other energy index items also fell in March, including the fuel oil index (-13.7%), the natural gas index (-1.4%), and the electricity index (-0.2%). In the past year, the U.S. energy index dropped by 5.7%, which the Labor Department reports to be the largest 12-month decline since the year ending August 2016.
Source cited: https://www.bls.gov/news.release/archives/cpi_04102020.htm
by Sarah Bauder | Feb 13, 2020 | CPI, Definitions
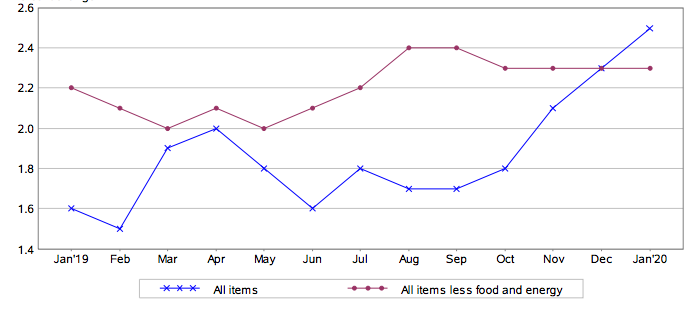
The US Bureau of Labor Statistics (BLS) reported today, that in January, the Consumer Price Index for All Urban Consumers (CPI-U) increased 0.1% on a seasonally adjusted basis. The all items index has risen 2.5% before seasonal adjustment, over the past year.
Based upon the data provided by the BLS, the shelter index was the largest component, which attributed to the rise in the seasonally adjusted all items index. In addition, the medical care and food indexes also increased. Conversely, the energy index dropped in January.
(Source: US Bureau of Labor Statistics)
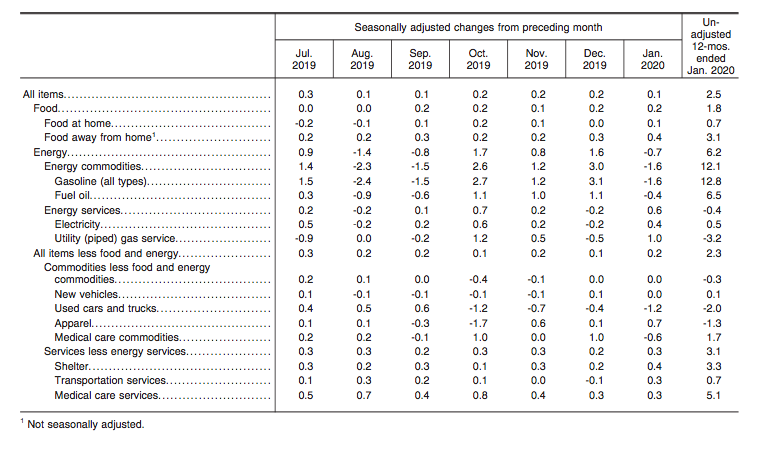
Energy Index
In January, the index for energy decreased by 0.7%. This is in contrast to December when the energy index edged up 1.6%. The price of gasoline dropped 1.6% in January, compared to the 3.1% rise the previous month. The electricity index edged up 0.4%, as did the natural gas index, with an increase of 1.0%.
Overall, over the past 12-month period, the energy index rose 6.2%. The price of gasoline soared up 12.8% since January 2019. The index for electricity edged up 0.5%, while the natural gas index dropped 3.2%.
Food Index
Similarly to December, the index for food rose 0.2%. The food at home index also increased 0.1% in January. The food away from home index also edged up 0.4%.
Since January 2019, the food at home index rose 0.7%. Likewise, the food away from home index also increased 3.1% over the past 12 months.
(Source: US Bureau of Labor Statistics)
All Items Less Food And Energy Index
In January, the index for all items less food and energy rose 0.2% – December saw an increase of 0.1%. As mentioned, the shelter index increased 0.4%. The owners’ equivalent rent index saw a 0.3% increase, and the index for rent rose 0.4%.
The index for medical care also increased by 0.2%, as did the hospital services index, which rose 0.8%.
Over the last 12 months, the all items less food and energy index increased 2.3%. Since January 2019, the index for shelter edged up 3.3%. The medical care index also saw an increase over this same period, rising 4.5%. Over the past 12 months, there have been few indexes that decreased in this category.
Source cited: https://www.bls.gov/news.release/archives/cpi_02132020.htm