
Alex Demolitor
Alex Demolitor is a Canadian financial writer hailing from Halifax, NS. Alex has a Bachelors Degree from King's College and passed the CFA Exam Level III. He specializes in fundamental analysis of the stock, bond, commodity, and FX markets. He also covers US & Canadian economic indicators.
by Alex Demolitor | Jul 14, 2026 | Definitions
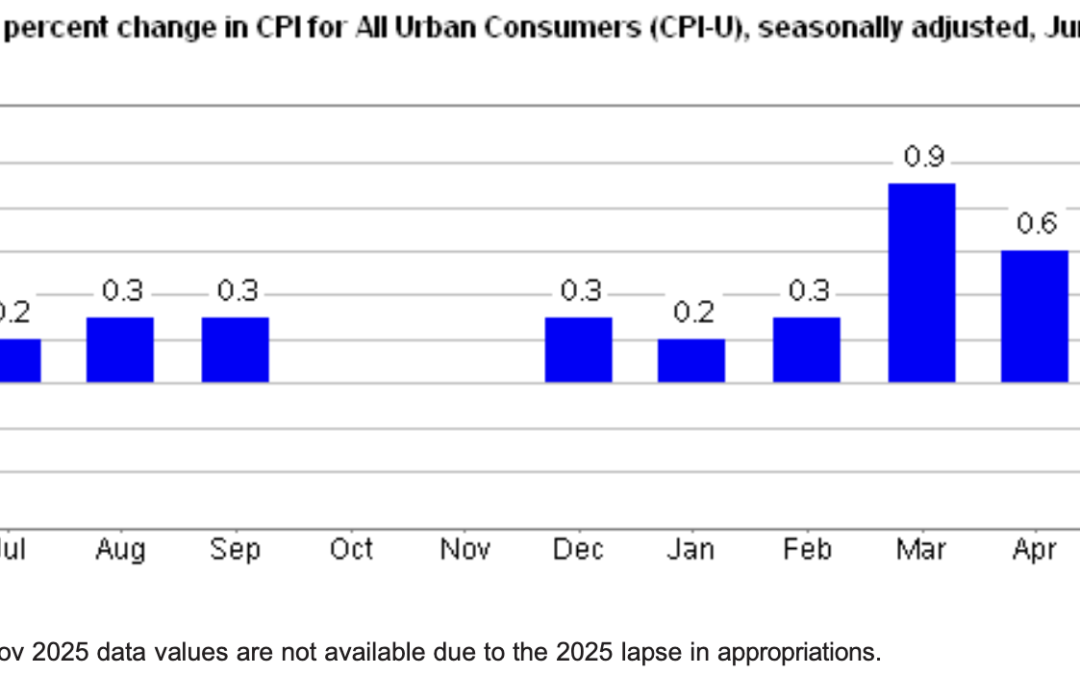
The June 2026 Consumer Price Index of All Urban Consumers (CPI-U) report indicates that inflation declined by 0.4% this month, down from a rise of 0.5% in May. These data were released at 8:30 am EST on July 14, 2026, by the Bureau of Labor Statistics (BLS). Before seasonal adjustment, the year-over-year (Y-o-Y) inflation rate in the all-items index grew by 3.5%.
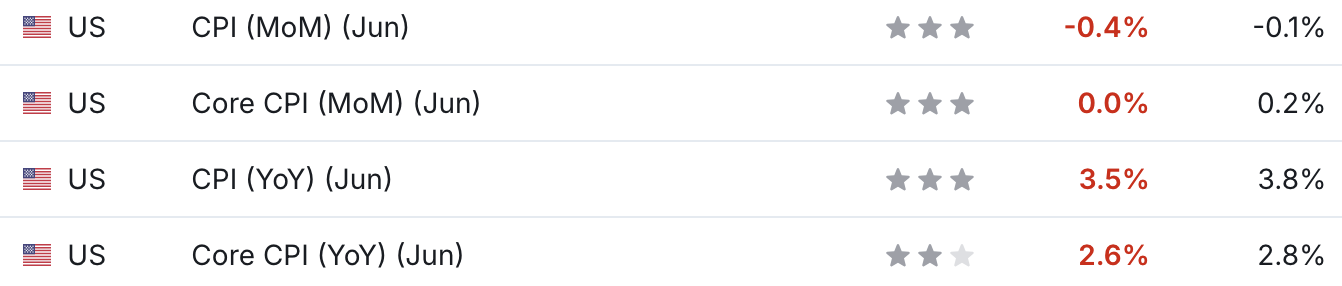
This month’s results missed economists’ consensus estimates. The table below is courtesy of Investing.com. The left column represents June’s figures, while the right column represents forecasters’ expectations. As you can see, the red metrics highlight the monthly underperformance.
Yet, with the U.S.-Iran conflict heating up again, the inflationary impact has Fed officials hinting at rate hikes. Fed Governor Christopher Waller said on Jul. 13 that “We’re building off of basically almost, you know, five to six months of ‘higher, higher, higher, higher,’ on inflation readings. If I get another higher one, I’m going to treat that as signal, not noise….
“I am concerned about the equally plausible case that data in the coming weeks will show that inflation will remain at its elevated level or even trend higher, requiring tighter monetary policy in the near term.”
As such, the recent spike in oil prices should only embolden his view the longer it persists.
Food Prices
The food index increased by 0.2% in June, matching the rise from May. Four of the major grocery indices increased this month, while two decreased.
- Cereals and bakery products (+0.3%)
- Meats, poultry, fish, and eggs (+0.6%)
- Dairy and related products (+1.2%)
- Fruits and vegetables (-0.2%)
- Nonalcoholic beverages (-1.5%)
- Other food at home (+0.5%)
In addition, the food away from home index increased by 0.2%, as restaurant inflation aligned with grocery inflation.
Energy Prices
The energy index fell by 5.7% MoM in June, the largest monthly drop since April 2020. Gasoline prices fell by 9.7%, electricity by 1.0%, and natural gas rose by 0.5%.
Core CPI
The June core CPI rose by 2.6% Y-o-Y, a deceleration from the 2.9% recorded in May. Below is an itemized breakdown of the various components:
- Shelter index: (+0.1%) [May: +0.3%]
- Rent index: (+0.1%) [May: +0.4%]
- Owners’ equivalent rent: (+0.2%) [May: +0.3%]
- Motor vehicle insurance: (-2.0%) [May: -1.7%]
- Medical care services: (-0.1%) [May: +0.5%]
- Physician services: (-0.2%) [May: +0.0%]
- Hospital services: (+0.1%) [May: +0.7%]
- Airline fares: (+0.2%) [May: +2.7%]
Seasonally Unadjusted CPI
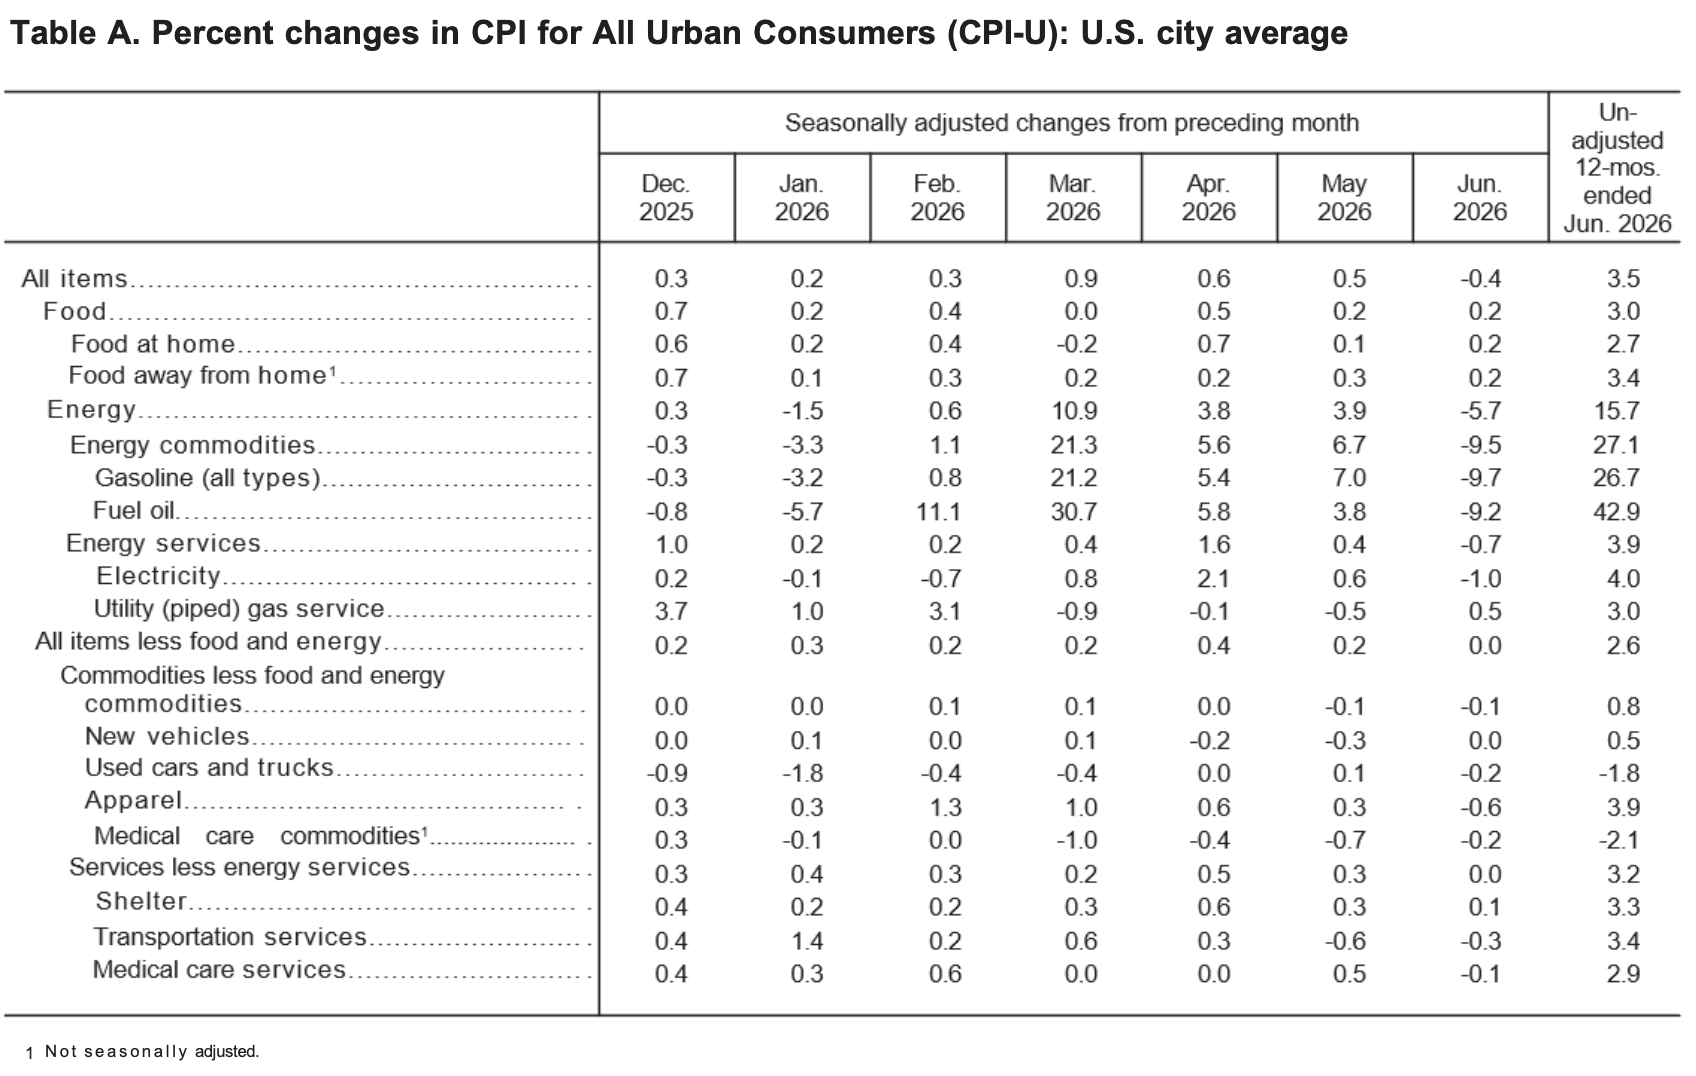
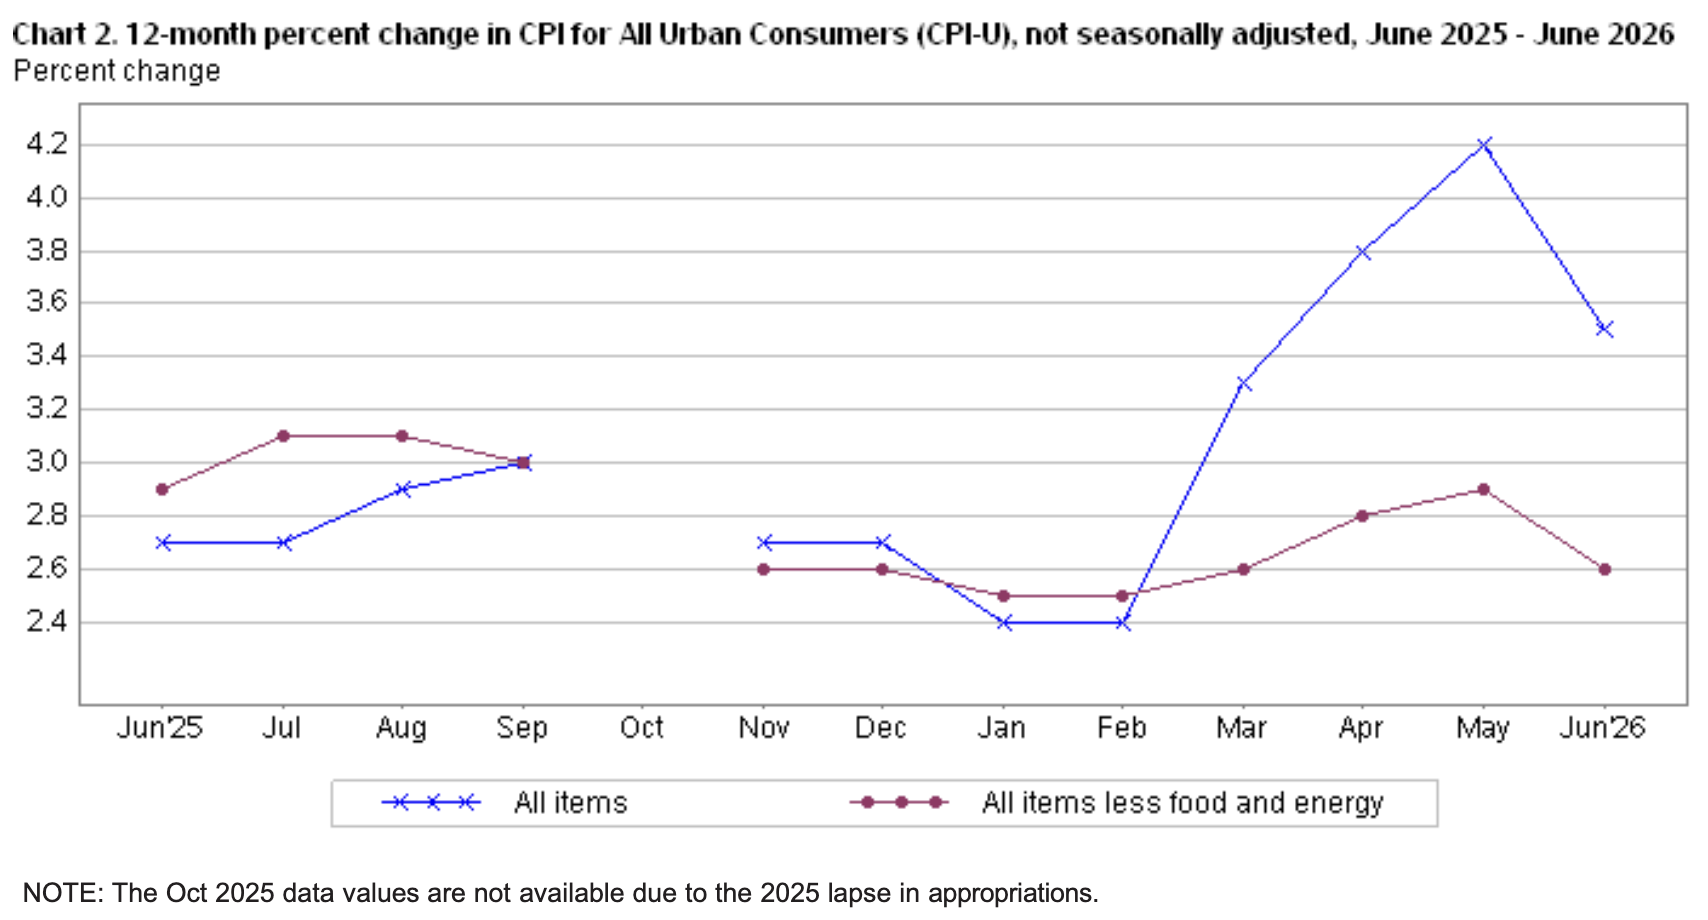
Before seasonal adjustments, the CPI-U for June 2026 increased by 3.5% Y-o-Y to an index level of 333.952. Since these figures are unadjusted, they include regular seasonal price fluctuations that can create volatility in the results.
The Chaos Continues
After another escalation in the U.S.-Iran conflict, higher oil prices and potentially higher inflation are back in the spotlight. Yet, this time the uncertainty and the bond market sell-off are occurring when U.S. economic growth is slipping.
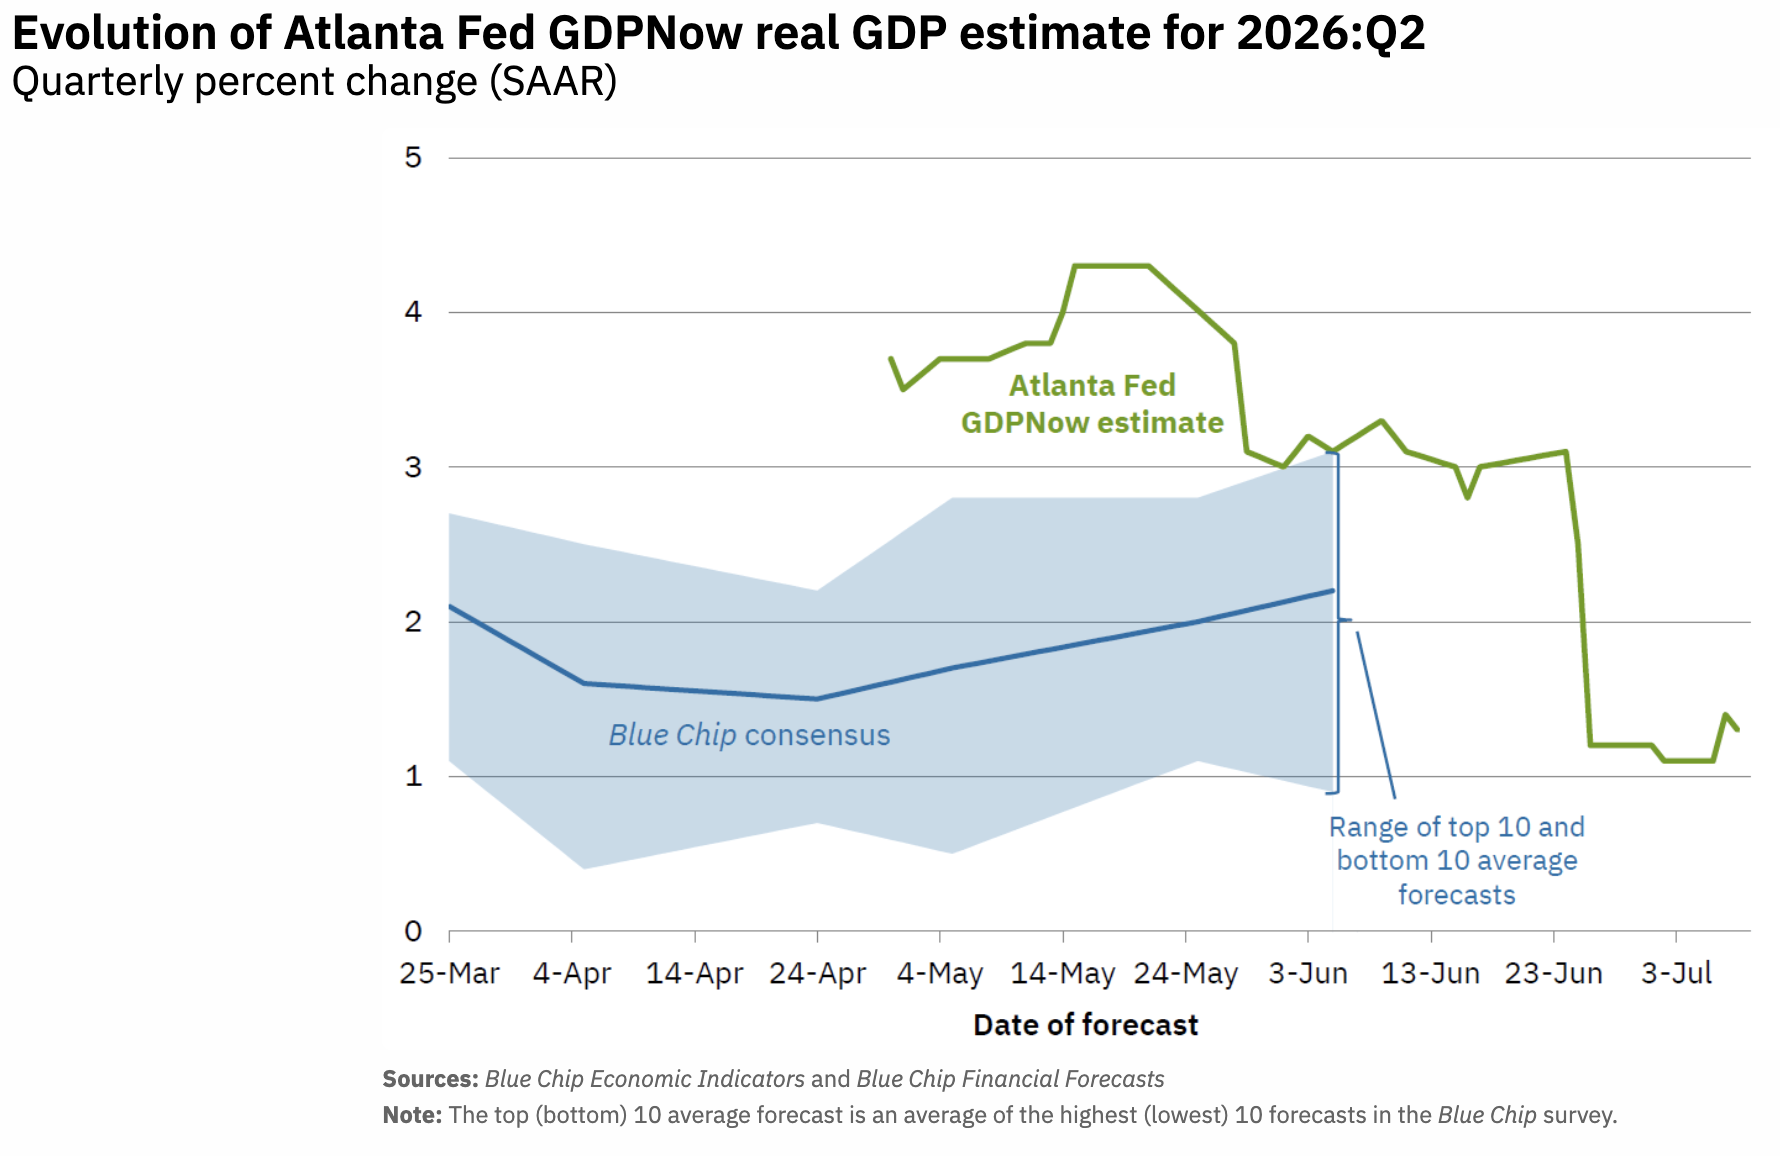
To explain, the green line above tracks the Atlanta Fed’s second-quarter 2026 GDP growth estimate. If you analyze the movement, you can see that higher interest rates and financial market volatility are starting to weigh on economic output. Moreover, with the metric sitting near 1.30%, the U.S. economy may continue to struggle until the geopolitical turmoil ends.
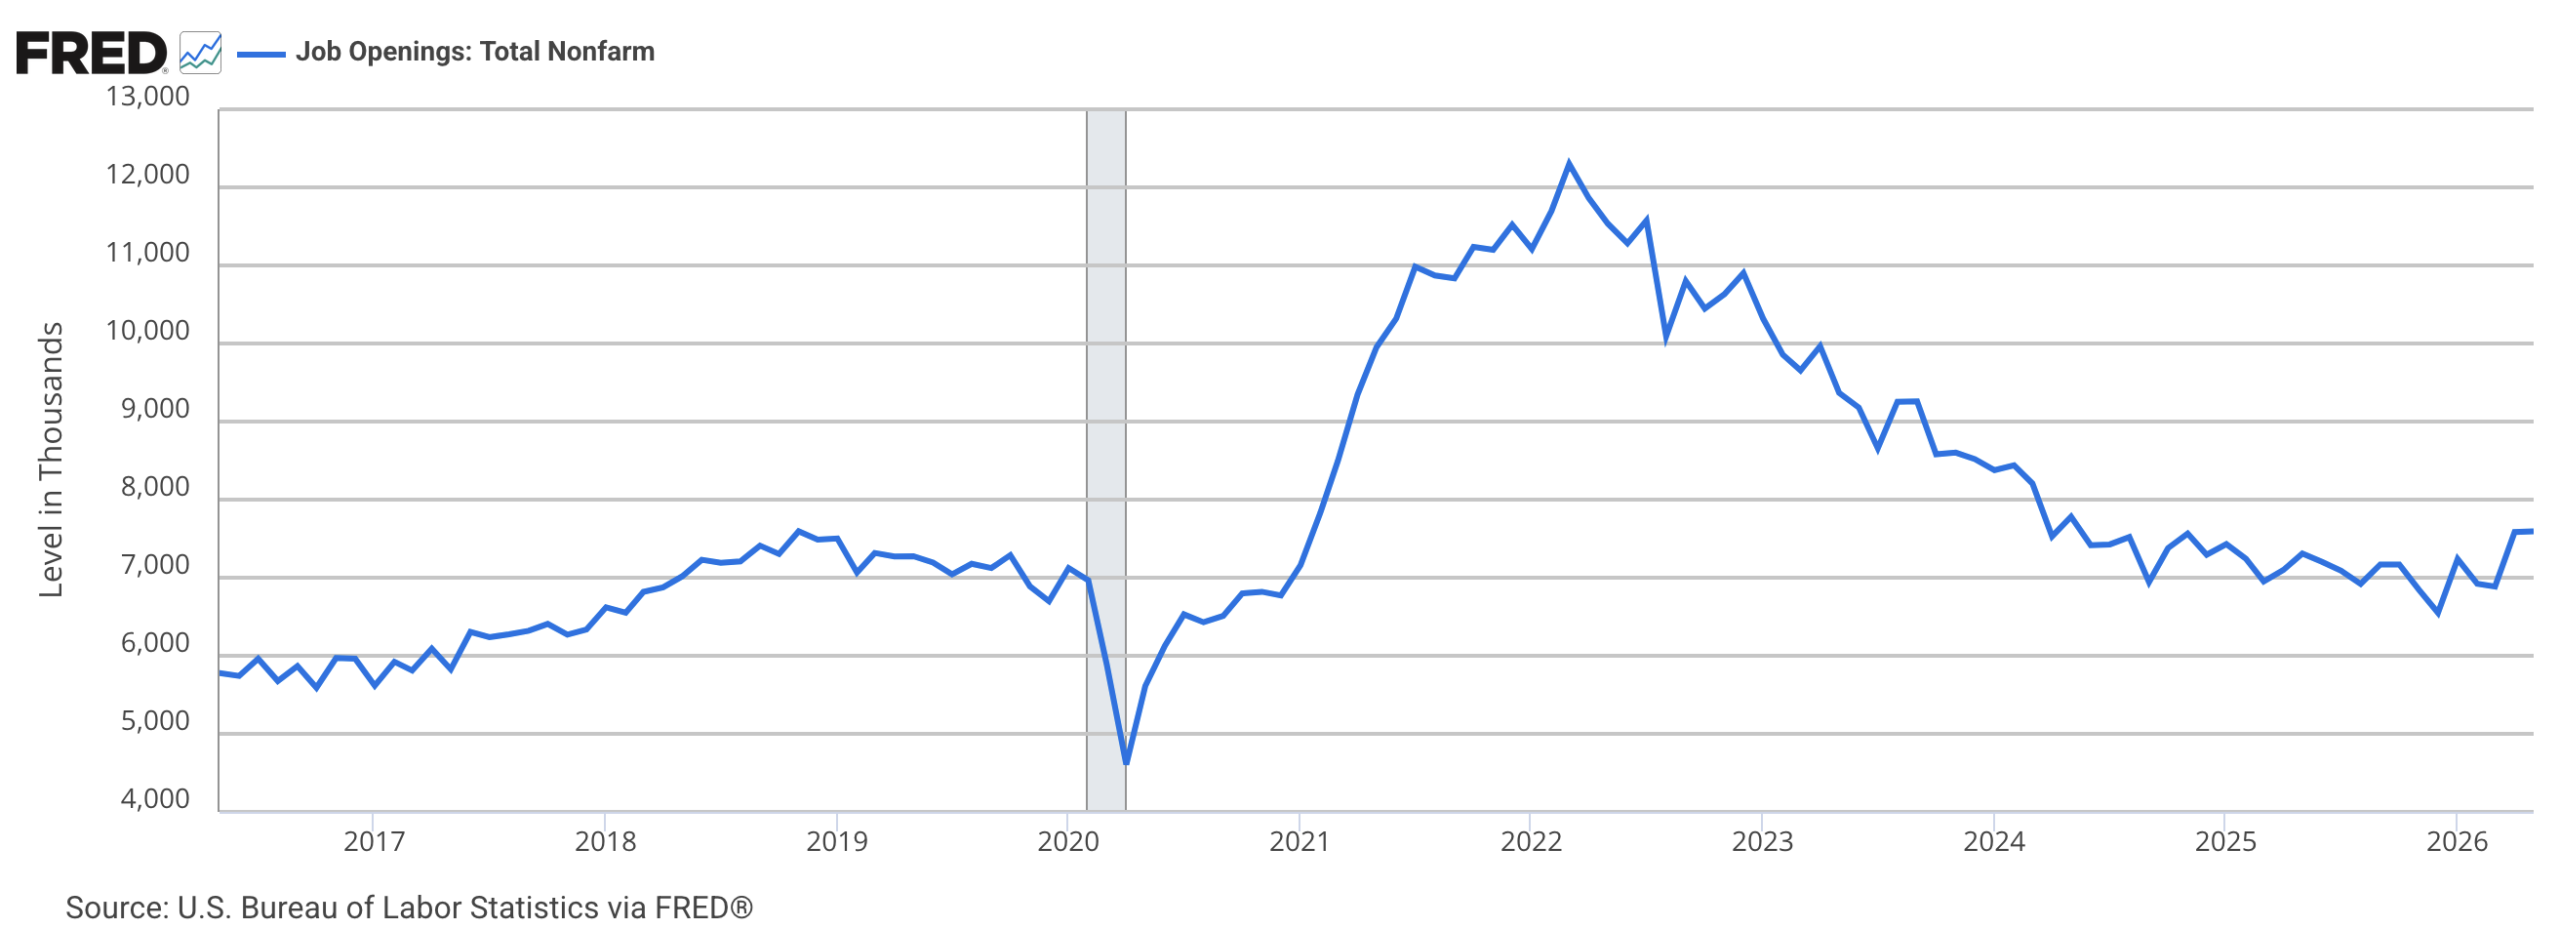
In contrast, U.S. job postings have increased recently. After bottoming near 6.6 million in December 2025, the metric has increased to almost 7.6 million as of the end of May. Consequently, divergent data make the outlook even more murky for policymakers.
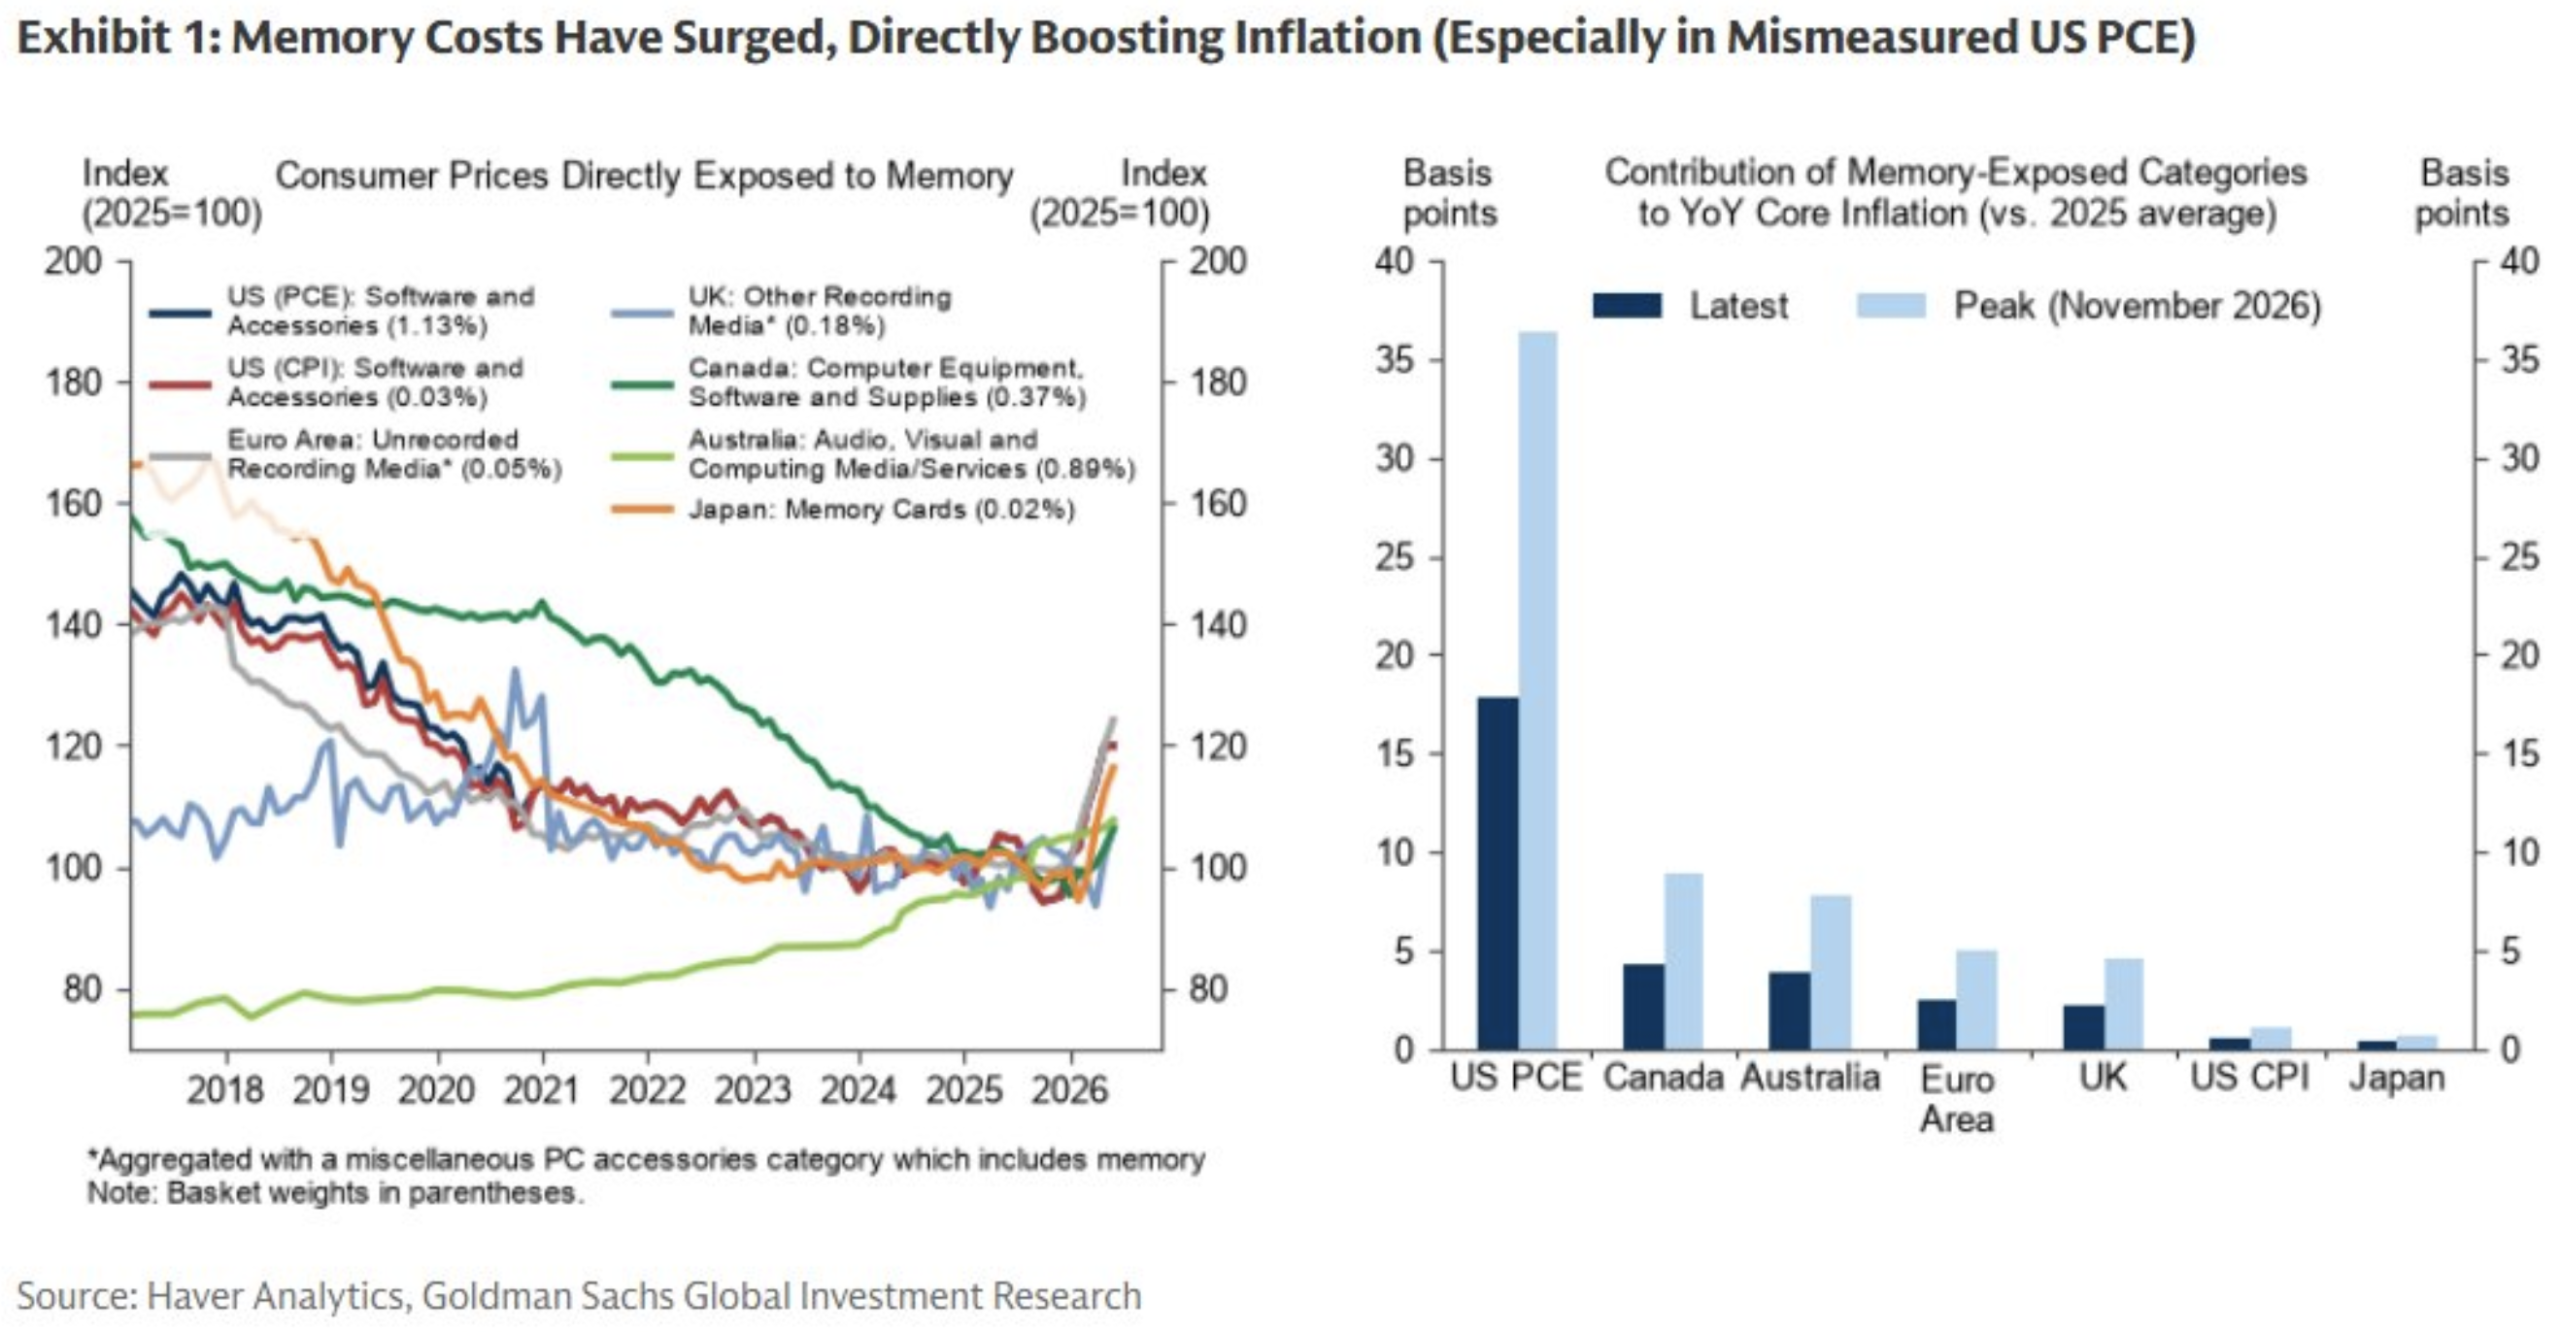
Finally, Goldman Sachs told clients recently that the AI spending spree could uplift inflation. With soaring memory, software, and electricity prices poised to flow into the PCE and CPI baskets, they could create even more challenges for the Fed in the months ahead.
Turning to the financial markets, gold continues to suffer from the geopolitical volatility. But interestingly, the recent correction is similar to 2008, right before the multi-year surge.
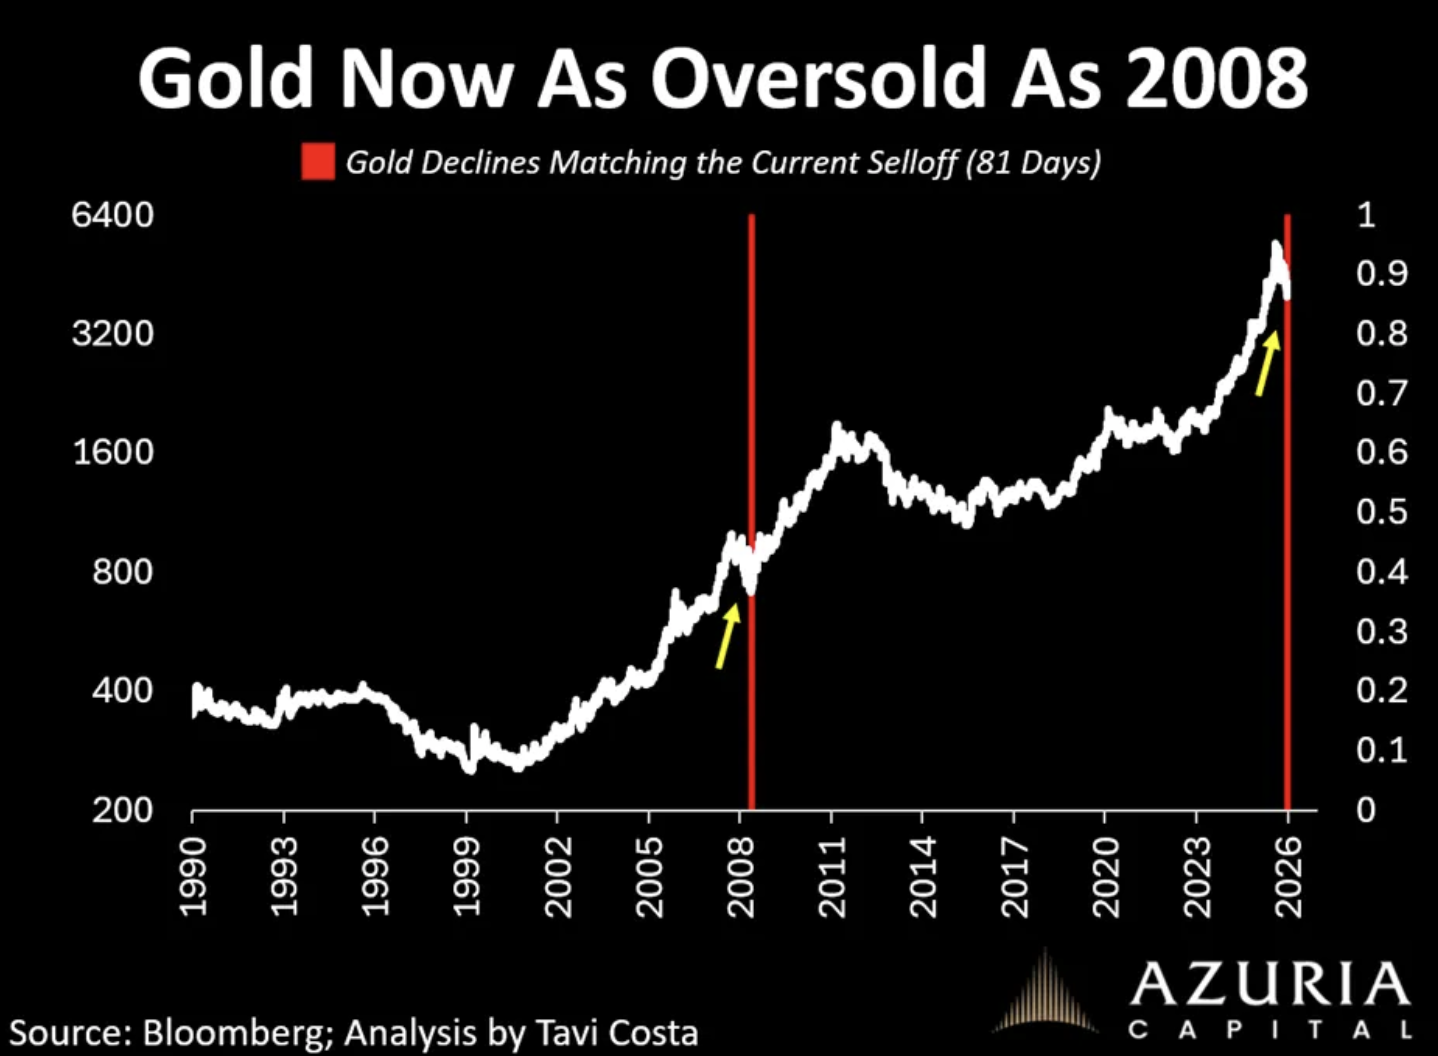
To explain, the vertical red lines above highlight the similarity between the 2008 correction and the current one. And with the timeframes and magnitude quite consistent, it could be an interesting clue that gold is nearing an inflection point.
Are you thinking about diversifying into precious metals? Talk to your financial advisor about initiating a gold IRA account today, allowing you to invest in this red-hot asset on a tax-advantaged basis. Additionally, our complimentary CPI inflation calculator remains at your disposal, enabling you to assess inflation’s impact on your finances. Please seek the guidance of a financial advisor before making any investment decision.
As a worthwhile option, Augusta Precious Metals specializes in precious metal IRAs, helping to roll your existing retirement accounts, such as a 401 (k), into IRAs backed by physical gold or silver. You can also purchase bullion directly, and the company has an exceptional reputation, with either AAA or 4.5 to 5-star reviews across multiple ratings agencies.
Furthermore, if you need a financial reset but are unsure which company and path are right for you, several reputable options are available.
Up first, CuraDebt has been in business since 1996 and helps Americans struggling with unsecured claims like credit cards, personal loans, medical bills, and tax obligations. The company helps negotiate with creditors on your behalf and has roughly 300 positive reviews. The only downside is that service is not available in all states.
Second, Americor sets itself apart by providing counseling and consolidation services, but also offers in-house loans through its affiliate lender, Credit9. The firm has nearly 25,000 positive reviews, but may not be the best fit if you have a low credit score.
Last, we created an extensive guide covering the 23 Best Debt Relief Companies that deserve consideration. Comparing the various options helps identify their strengths and weaknesses, and often makes it easier to find the best option for your unique situation.
by Alex Demolitor | Jun 10, 2026 | Definitions
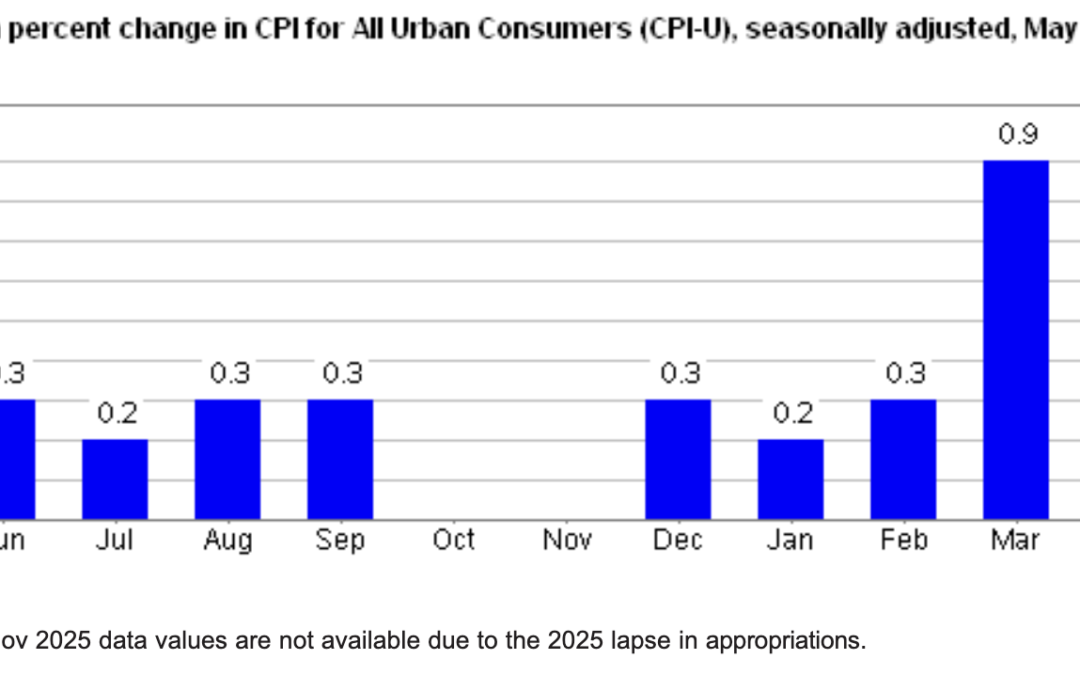
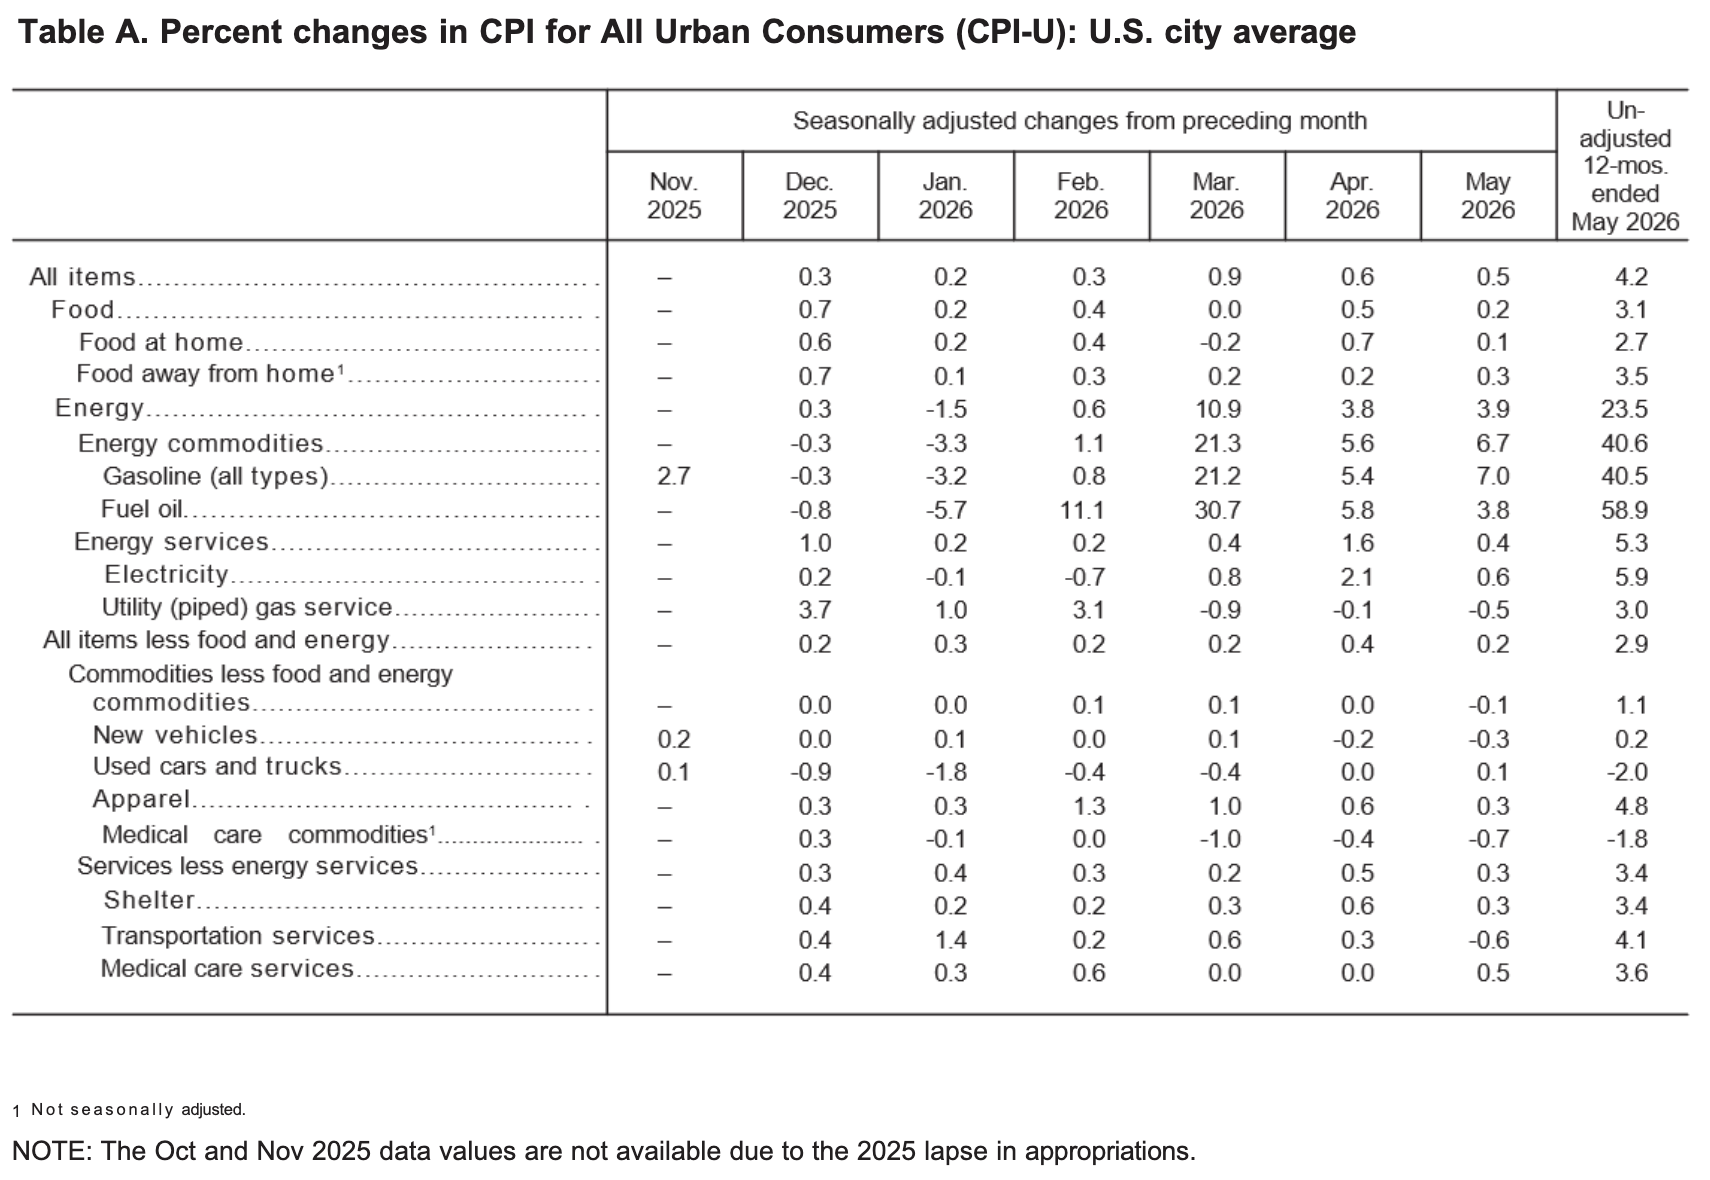
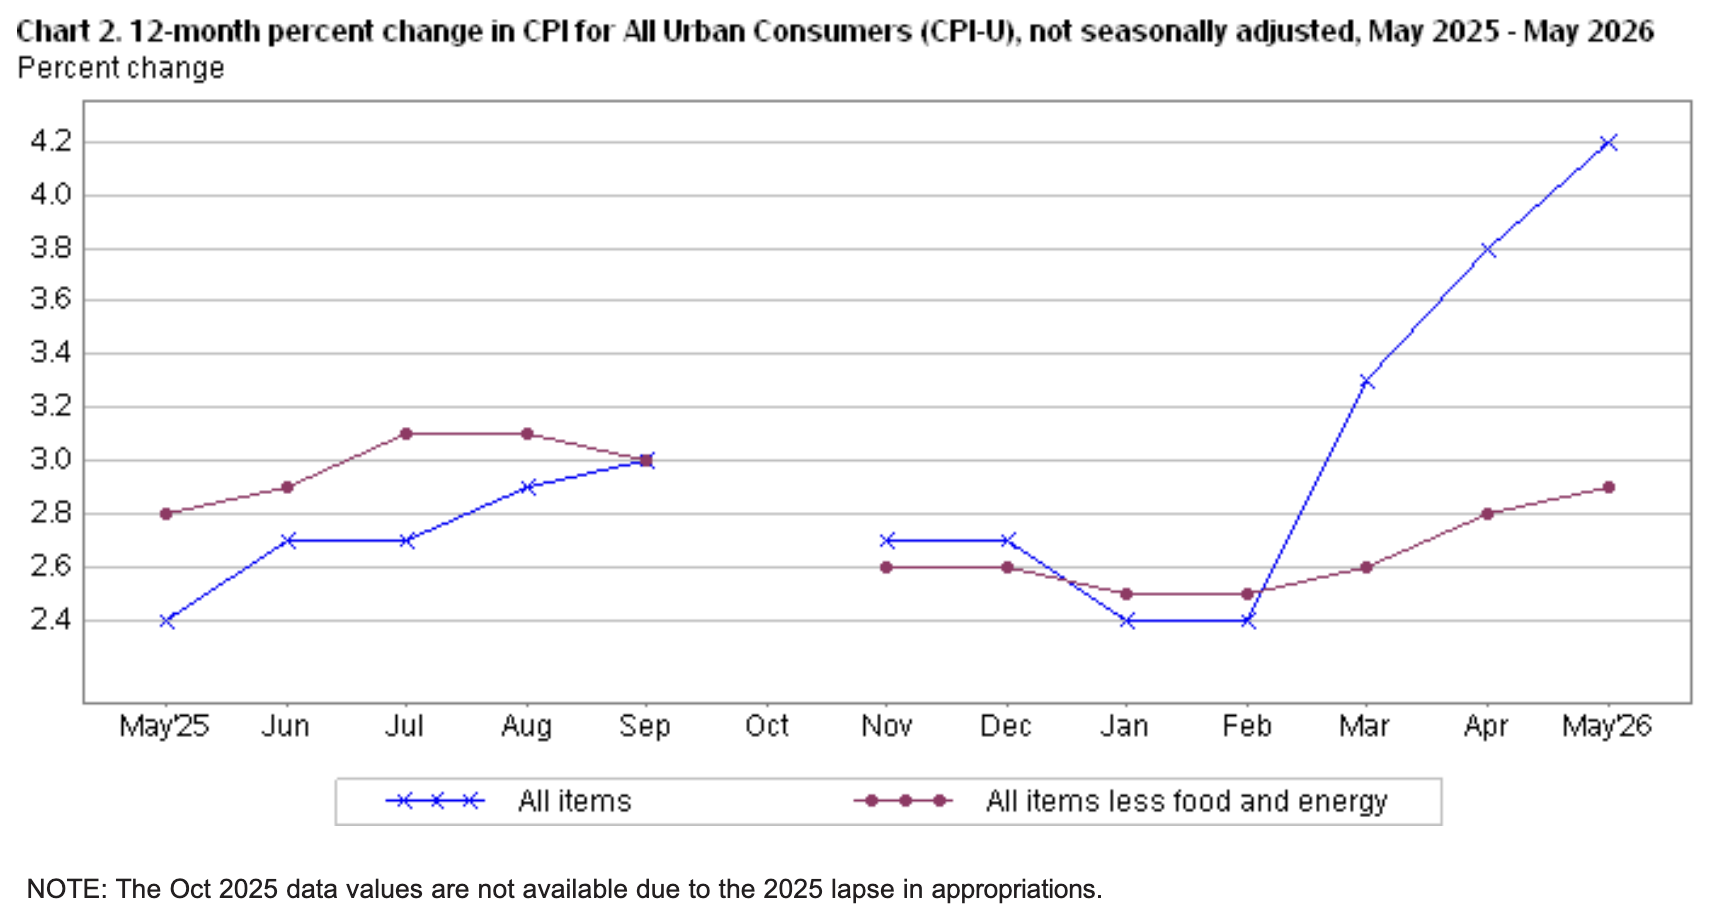
The May 2026 Consumer Price Index of All Urban Consumers (CPI-U) report indicates that inflation increased by 0.5% this month, down from 0.6% in April. These data were released at 8:30 am EST on June 10, 2026, by the Bureau of Labor Statistics (BLS). Before seasonal adjustment, the year-over-year (Y-o-Y) inflation rate in the all-items index grew by 4.2%.
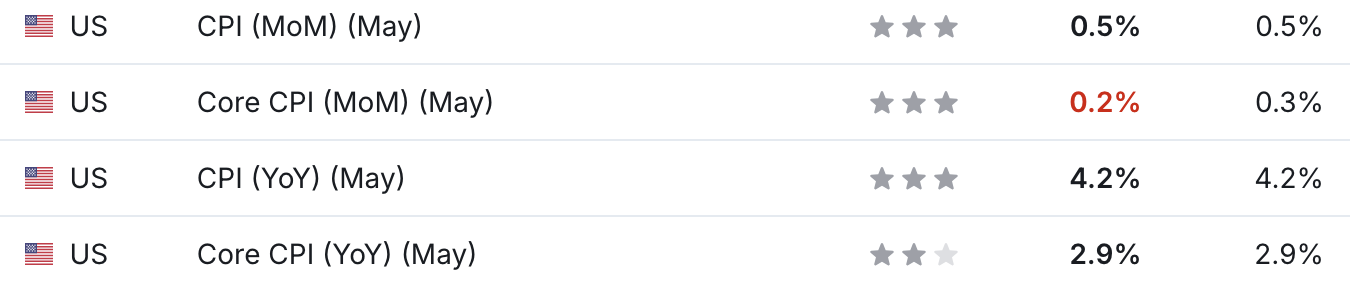
This month’s results mostly aligned with economists’ consensus estimates. The table below is courtesy of Investing.com. The left column represents May’s figures, while the right column represents forecasters’ expectations. As you can see, the black figures were in line, while the core CPI was slightly weaker than anticipated.
Yet, with new Federal Reserve Chair Kevin Warsh inheriting a difficult situation with the U.S.-Iran conflict, higher oil prices and their impact on inflation have hurt the case for rate cuts. And the longer it takes for the conflict to resolve, the more likely it is that tighter monetary policy emerges in the months ahead.
Food Prices
The food index increased by 0.2% in May after jumping by 0.5% in April. Three of the major grocery indices increased this month, one was flat, and two decreased.
- Cereals and bakery products (+0.4%)
- Meats, poultry, fish, and eggs (-0.2%)
- Dairy and related products (-0.6%)
- Fruits and vegetables (+0.2%)
- Nonalcoholic beverages (+0.6%)
- Other food at home (+0.0%)
In addition, the food away from home index increased by 0.3%, as restaurant inflation surpassed grocery inflation in May after underperforming in April.
Energy Prices
The energy index rose by 3.9% MoM in May following a 3.9% increase in April. Gasoline prices rose by 7.0%, electricity by 0.6%, and natural gas fell by 0.5%.
Core CPI
The May core CPI rose by 2.9% Y-o-Y, ahead of the 2.8% figure from April. Below is an itemized breakdown of the various components:
- Shelter index: (+0.3%) [April: +0.6%]
- Rent index: (+0.4%) [April: ++0.5%]
- Owners’ equivalent rent: (+0.3%) [April: +0.5%]
- Motor vehicle insurance: (-1.7%) [April: +0.1%]
- Medical care services: (+0.5%) [April: +0.0%]
- Physician services: (+0.0%) [April: +0.6%]
- Hospital services: (+0.7%) [April: -0.3%]
- Airline fares: (+2.7%) [April: +2.8%]
Seasonally Unadjusted CPI
Before seasonal adjustments, the CPI-U for May 2025 increased by 4.2% Y-o-Y to an index level of 335.123. Since these figures are unadjusted, they include regular seasonal price fluctuations that can create volatility in the results.
Fighting the Bond Market
While the Fed will likely do everything in its power to avoid raising interest rates, the bond market has already sounded the alarm.
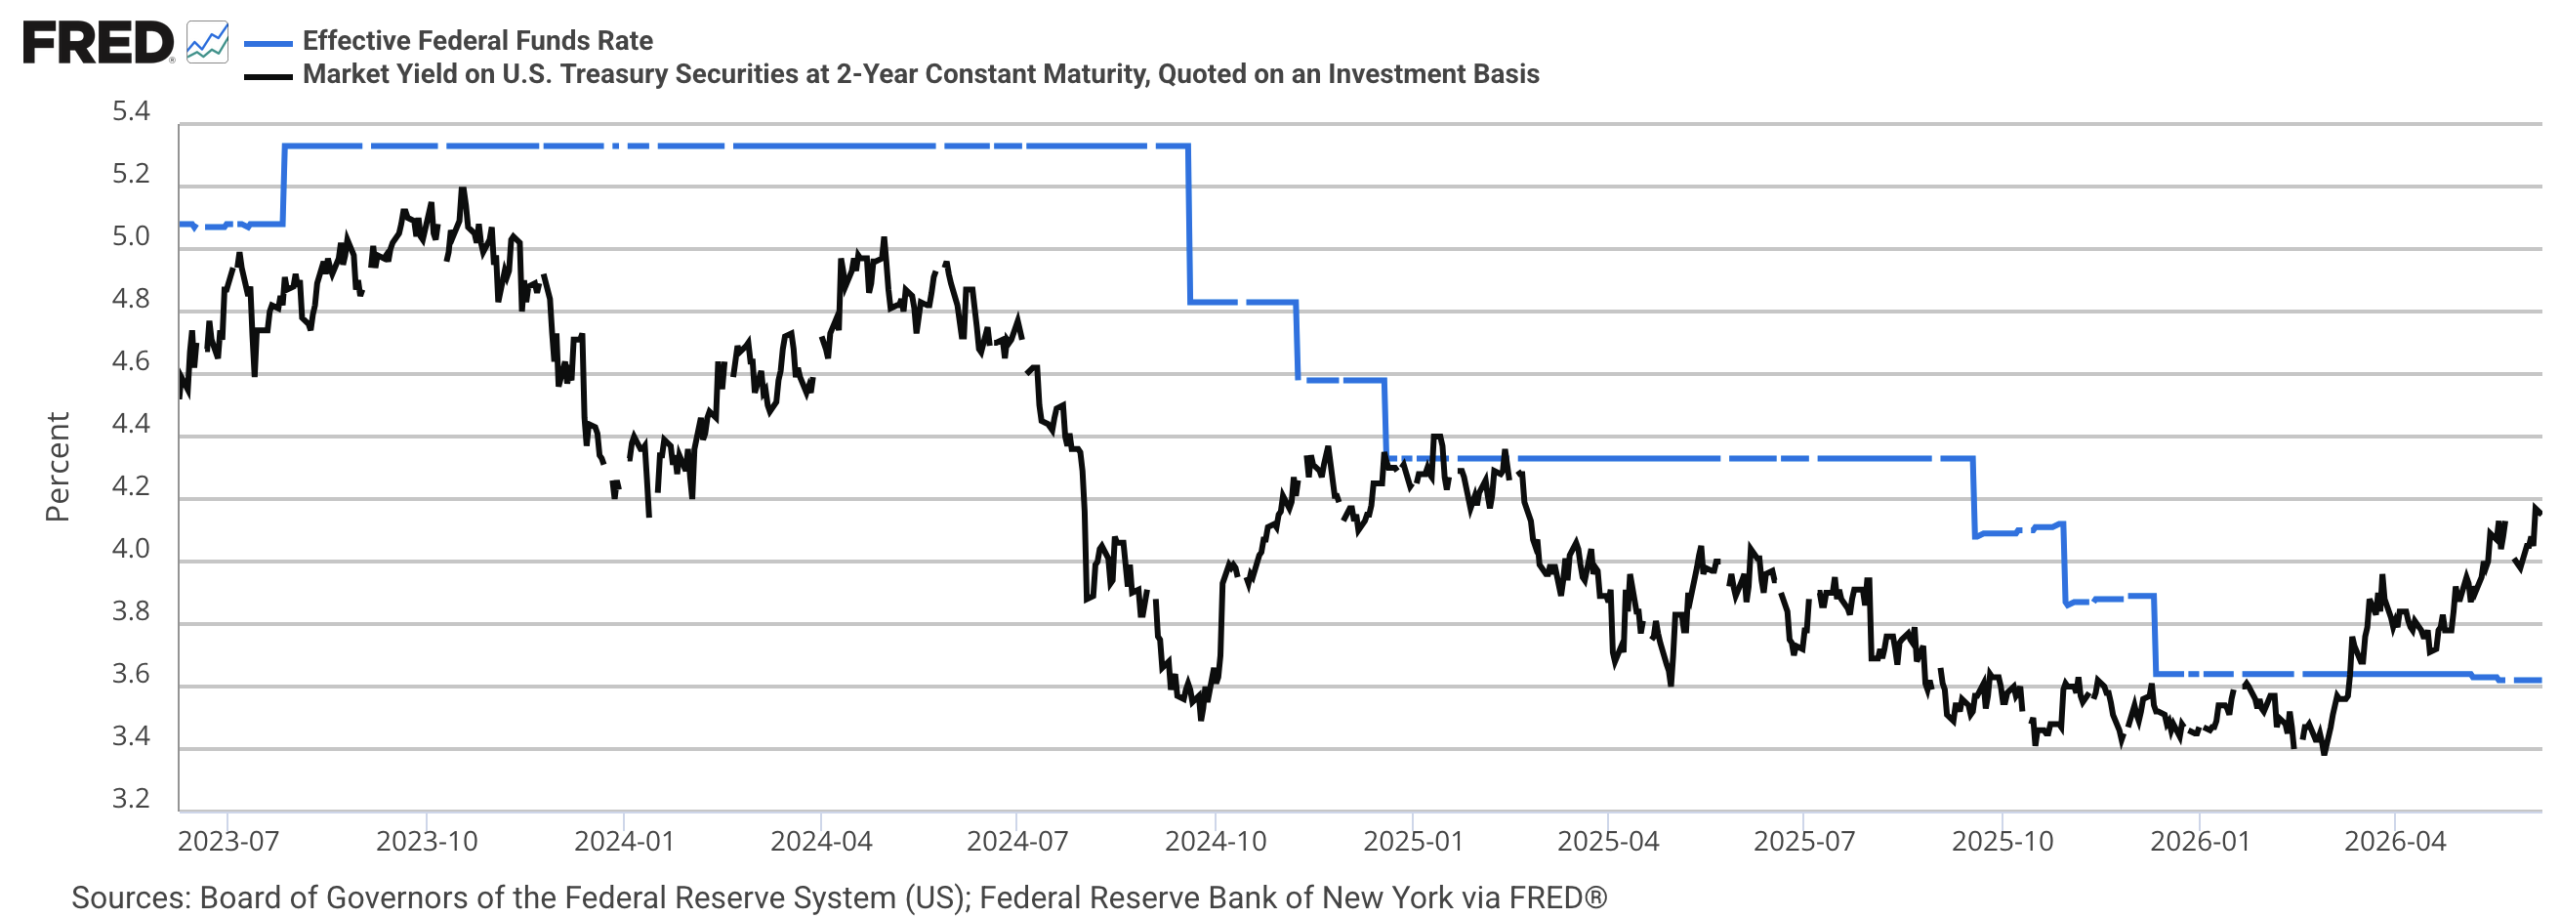
To explain, the blue line above tracks the federal funds rate, while the black line above tracks the 2-Year Treasury yield. The latter is considered a gauge of what the Fed should do; and with the metric rising sharply over the last few months, the bond market expects the committee to raise interest rates to combat inflation.
Supporting the argument, the U.S. labor market remains in a healthy place, which places more pressure on the Fed to prioritize its inflation mandate.
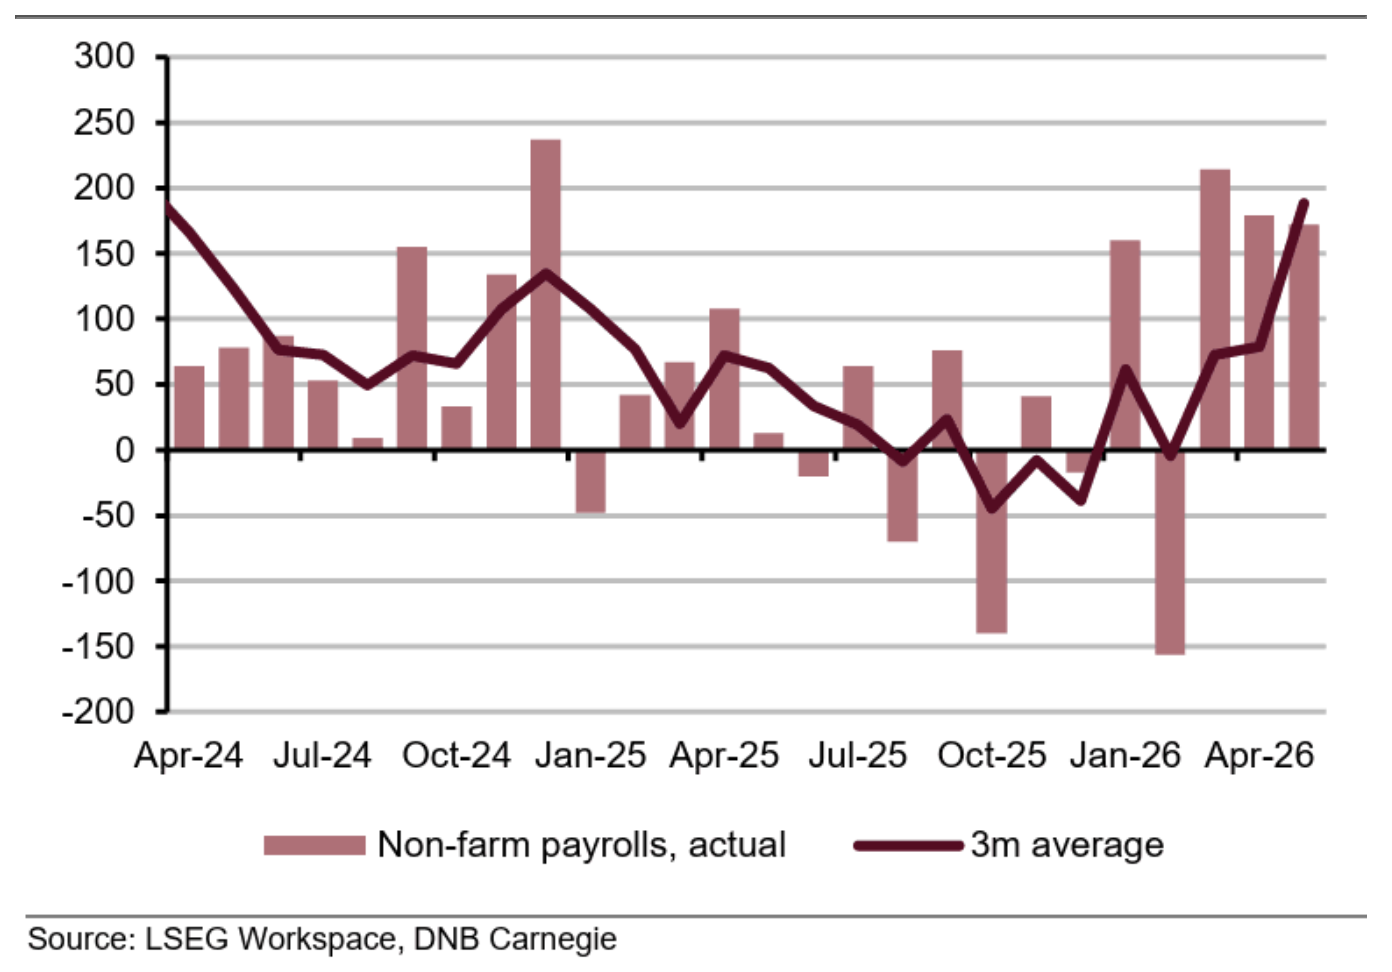
To explain, the red bars above track the monthly change in U.S. nonfarm payrolls, while the dark red line above tracks the 3-month average. If you analyze the right side of the chart, you can see that payroll growth has accelerated, which reduces the case for loose monetary policy. As such, inflation will likely be the main issue plaguing the Fed over the medium term.
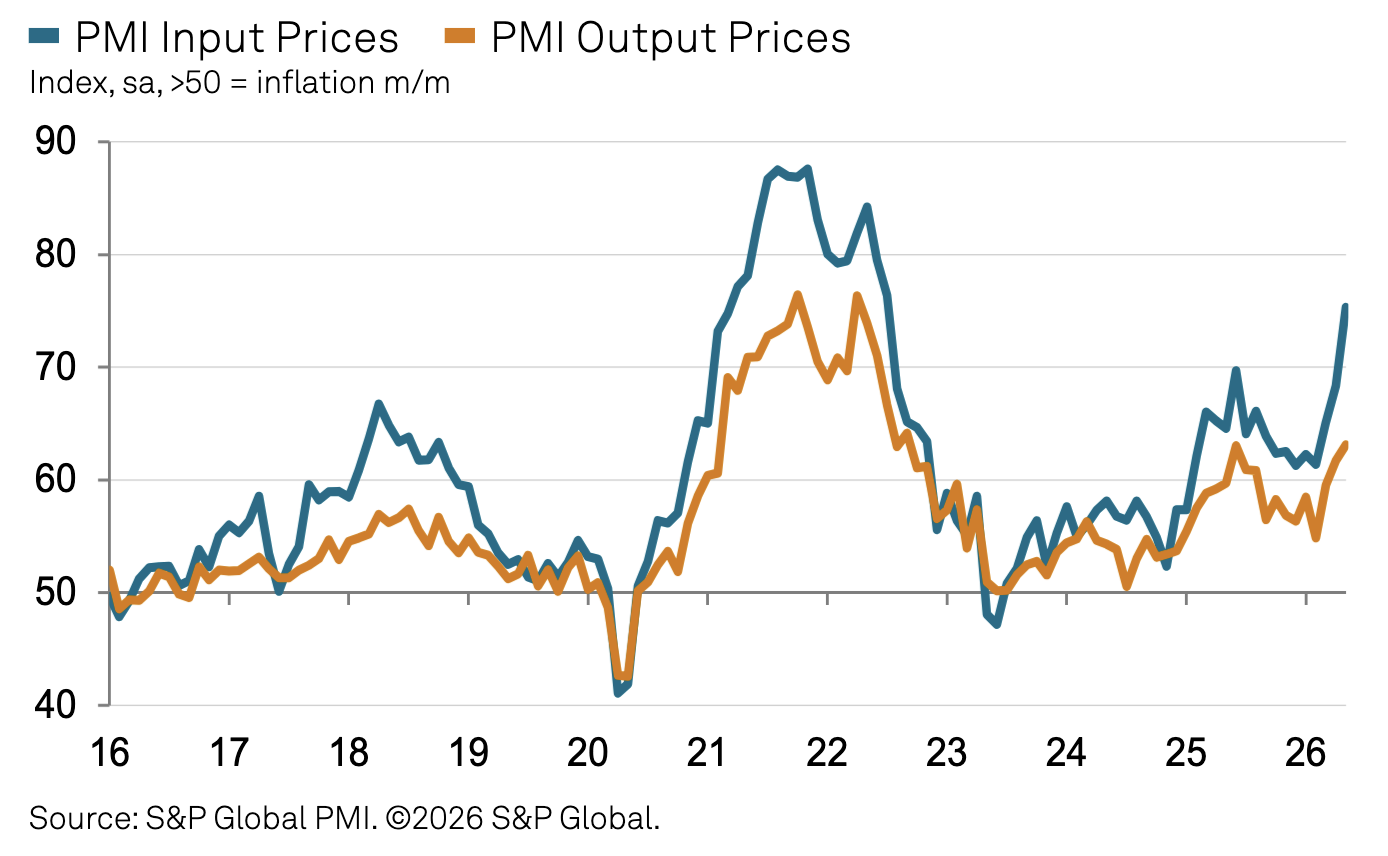
Finally, the latest S&P Global U.S. Manufacturing PMI (released on Jun. 1) adds to the story as it showed that input and output inflation have risen considerably. Therefore, the results could feed into the CPI over the coming months and continue to influence interest rate expectations.
Turning to the financial markets, gold has struggled as higher interest rates and a stronger U.S. dollar reduce its relative appeal. However, Ed Yardeni believes it’s a buying opportunity and reiterated his bullish forecast.
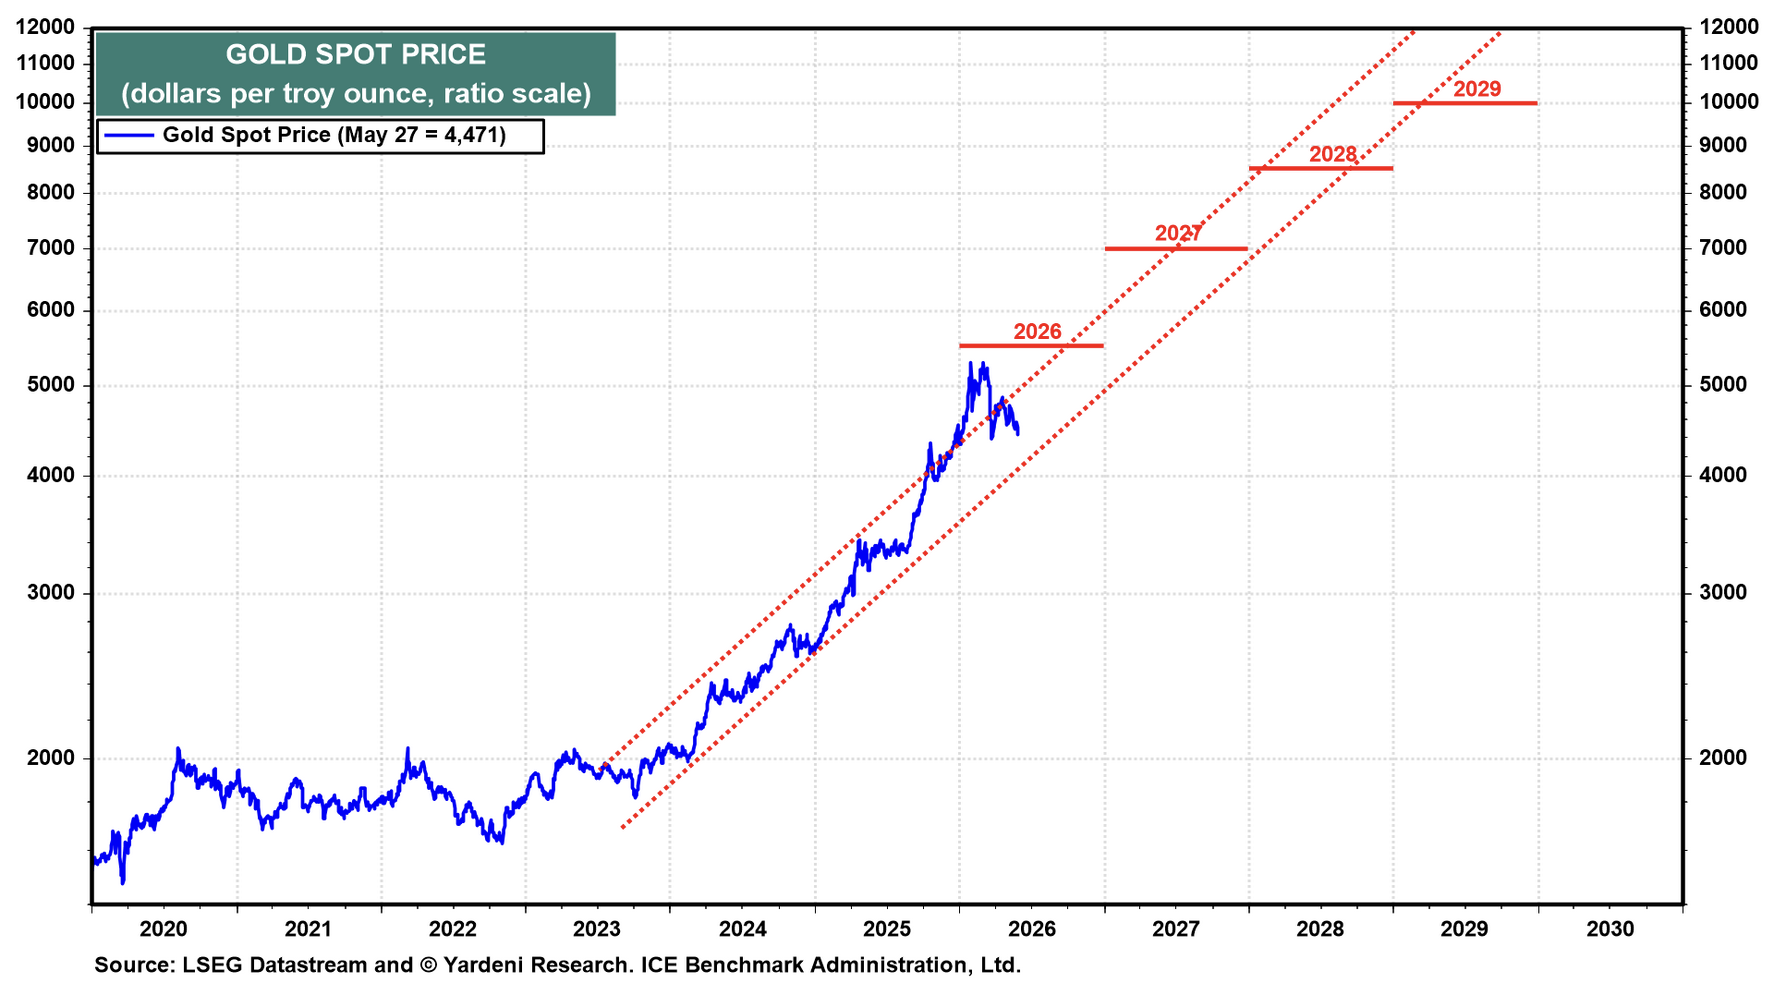
To explain, Yardeni still expects gold to hit $5,500 by the end of 2026 and $10,000 by the end of the decade. Consequently, the yellow metal could outperform once the U.S.-Iran conflict ends.
Are you thinking about diversifying into precious metals? Talk to your financial advisor about initiating a gold IRA account today, allowing you to invest in this red-hot asset on a tax-advantaged basis. Additionally, our complimentary CPI inflation calculator remains at your disposal, enabling you to assess inflation’s impact on your finances. Please seek the guidance of a financial advisor before making any investment decision.
As a worthwhile option, Augusta Precious Metals specializes in precious metal IRAs, helping to roll your existing retirement accounts, such as a 401 (k), into IRAs backed by physical gold or silver. You can also purchase bullion directly, and the company has an exceptional reputation, with either AAA or 4.5 to 5-star reviews across multiple ratings agencies.
Furthermore, if you need a financial reset and are unsure of the right path to solving your credit problems, we’ve identified the 22 Best Debt Settlement & Consolidation Companies that provide everything from credit counseling to bankruptcy advisory. Seeking professional help is often the best way to find the right solution for your unique circumstances.
To that point, Accredited Debt Relief is an excellent resource for Americans with at least $5,000 in unsecured debts across categories like credit cards, personal loans, medical bills, collections, and some other nice products.
Finally, bankruptcy is typically the last resort for borrowers who have exhausted all other resources. But even then, filers often overlook how the IRS treats your tax liabilities. Our guide covers which tax debts qualify, the rules the courts use, and how Chapter 7 and Chapter 13 bankruptcy differ.
by Alex Demolitor | May 12, 2026 | Definitions
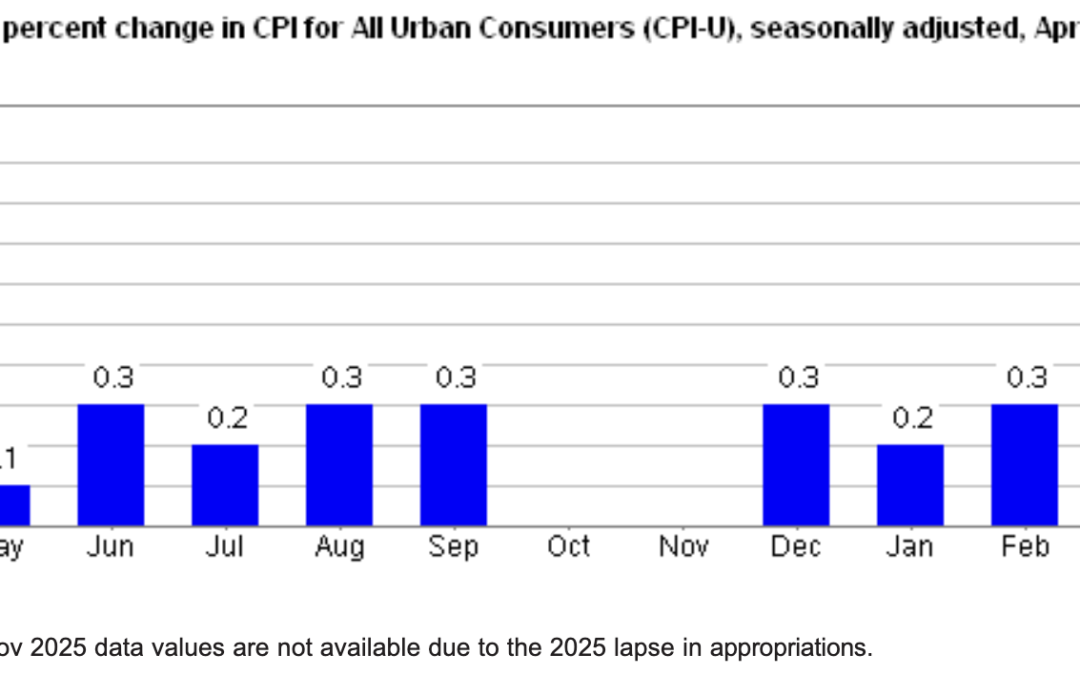
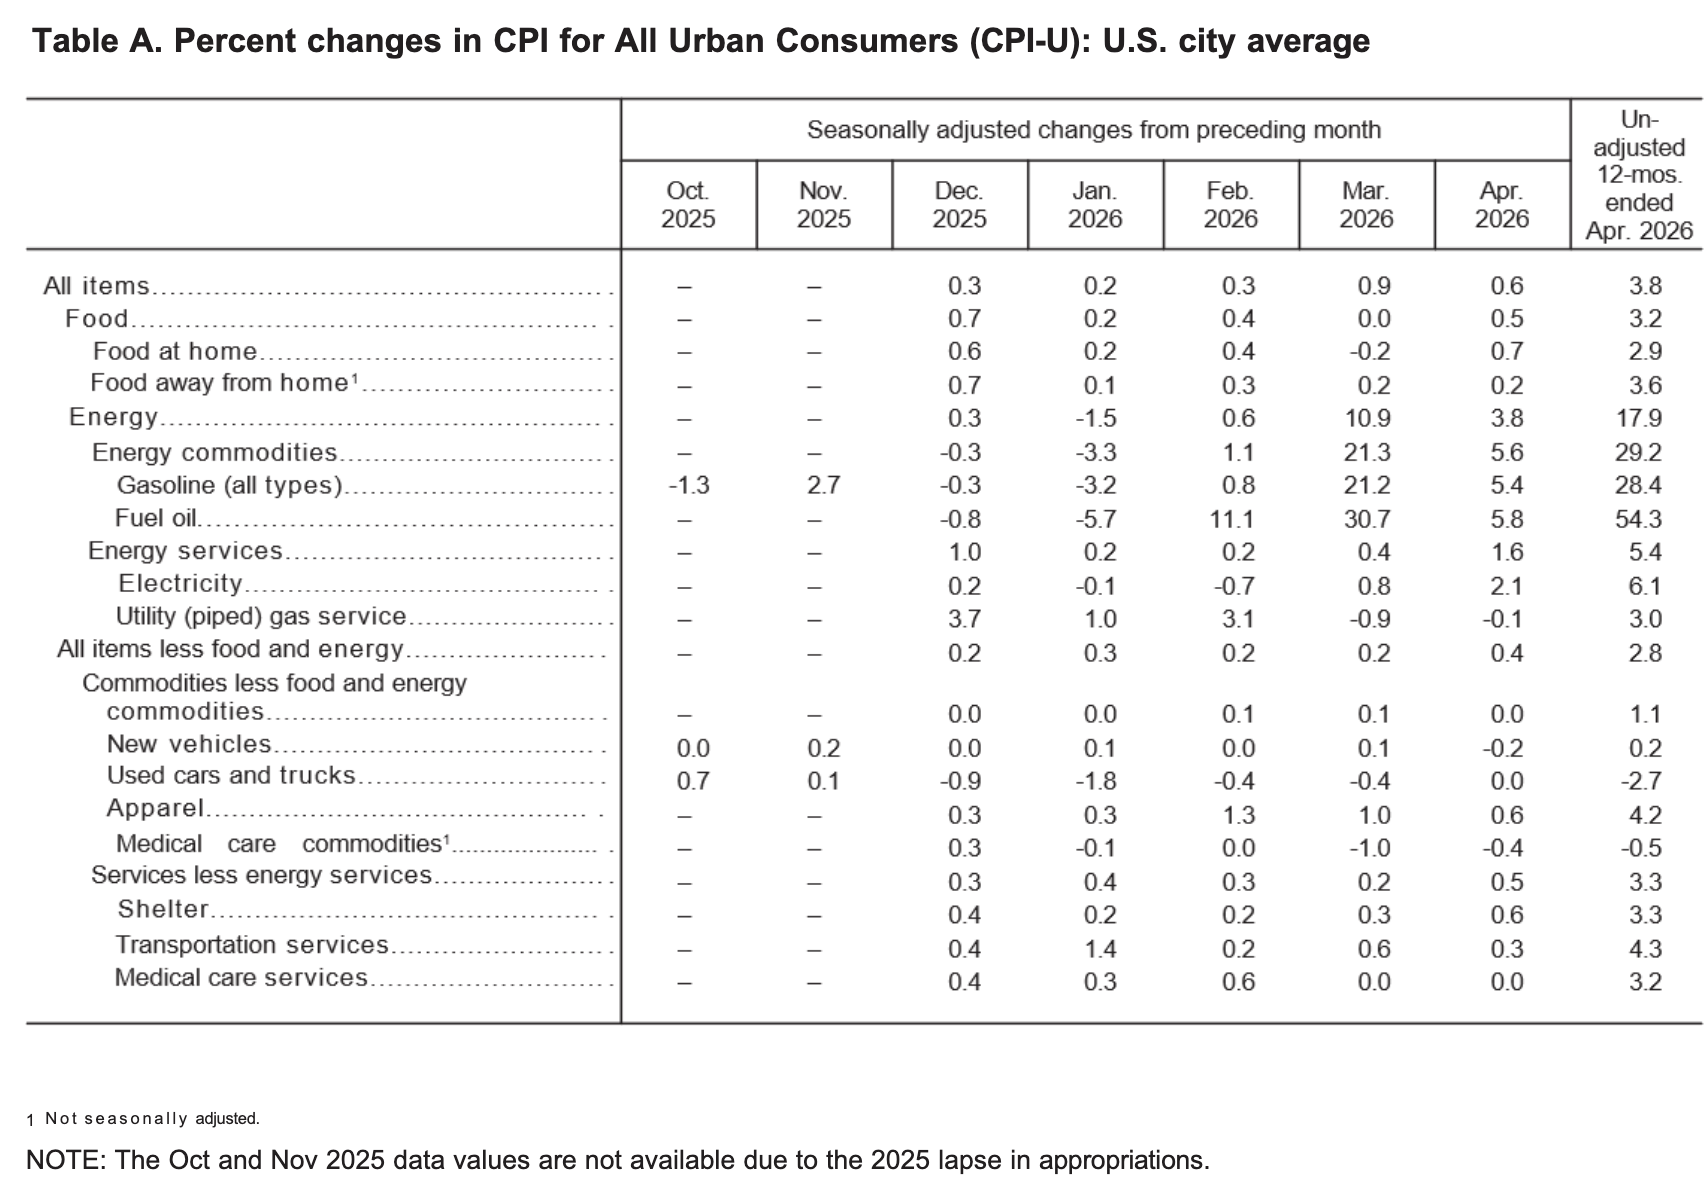
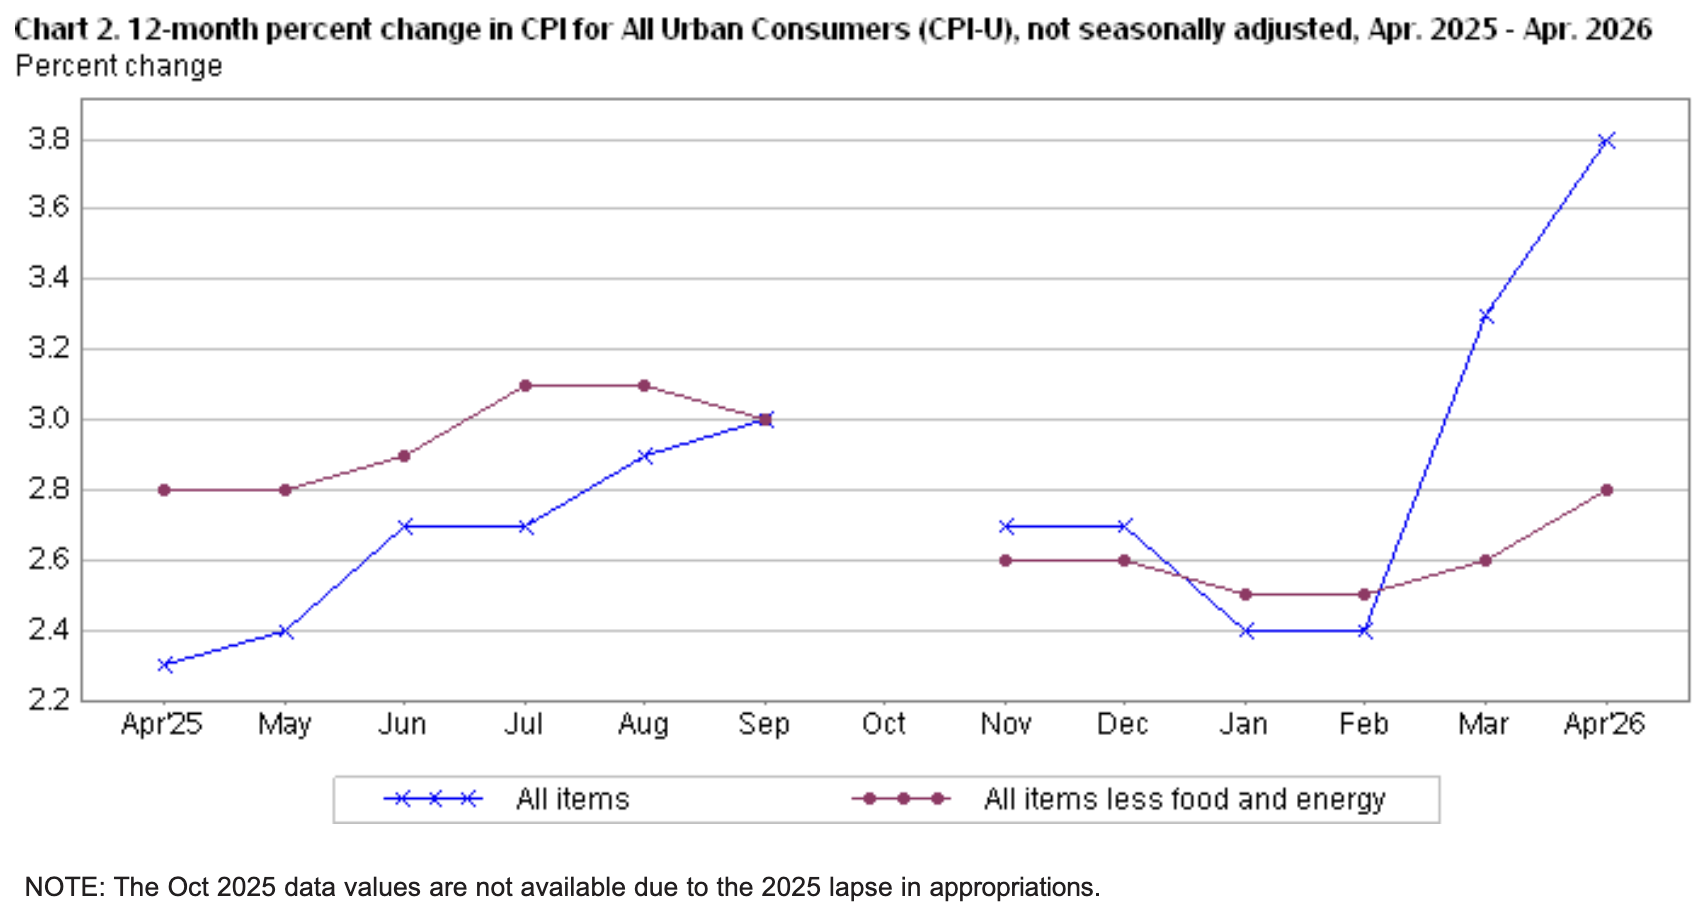
The April 2026 Consumer Price Index of All Urban Consumers (CPI-U) report indicates that inflation increased by 0.6% this month, down from 0.9% in March. These data were released at 8:30 am EST on May 12, 2026, by the Bureau of Labor Statistics (BLS). Before seasonal adjustment, the year-over-year (Y-o-Y) inflation rate in the all-items index grew by 3.8%, as higher energy prices accounted for over 40% of the monthly increase.
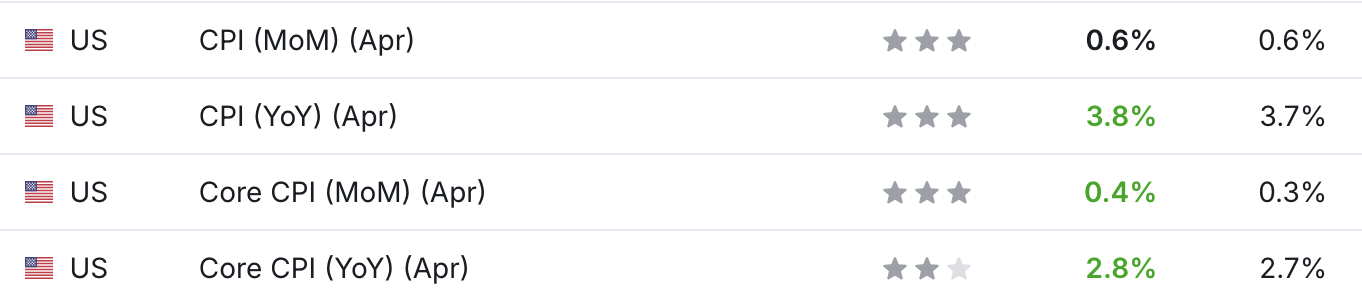
This month’s results also exceeded economists’ consensus estimates. The table below is courtesy of Investing.com. The left column represents April’s figures, while the right column represents forecasters’ expectations. As you can see, the data was slightly hotter than anticipated.
Yet, as the on-again, off-again, conflict between the U.S. and Iran persists, crude oil continues to hold policymakers hostage. The original assumption among market participants was that the duration of the oil surge would determine whether or not the FOMC needed to raise interest rates. And with little progress made toward lowering WTI prices and alleviating the inflation ramifications, more watching and waiting are likely for at least a couple of months.
Food Prices
The food index rose by 0.5% in April after being flat in March. Five of the major grocery indices increased this month, while one decreased.
- Cereals and bakery products (+0.1%)
- Meats, poultry, fish, and eggs (+1.3%)
- Dairy and related products (+0.8%)
- Fruits and vegetables (+1.8%)
- Nonalcoholic beverages (+1.1%)
- Other food at home (-0.4%)
In addition, the food away from home index increased by 0.2%, as restaurant inflation underperformed grocery inflation in April.
Energy Prices
The energy index jumped by 3.8% MoM in April following a 10.9% increase in March. Gasoline prices rose by 5.4%, electricity by 2.1%, and natural gas fell by 0.1%.
Core CPI
The April core CPI rose by 2.8% Y-o-Y, above the 2.6% print from March. Below is an itemized breakdown of the various components:
- Shelter index: (+0.6%) [March: +0.3%]
- Rent index: (+0.5%) [March: +0.2%]
- Owners’ equivalent rent: (+0.5%) [March: +0.3%]
- Motor vehicle insurance: (+0.1%) [March: +0.0%]
- Medical care services: (+0.0%) [March: +0.0%]
- Physician services: (+0.6%) [March: +0.7%]
- Hospital services: (-0.3%) [March: +0.4%]
- Airline fares: (+2.8%) [March: +2.7%]
Seasonally Unadjusted CPI
Before seasonal adjustments, the CPI-U for April 2025 increased by 3.8% Y-o-Y to an index level of 333.020. Since these figures are unadjusted, they include regular seasonal price fluctuations that can create volatility in the results.
Still Going Strong
While the geopolitical conflict has taken a toll on other regions, the U.S. has been a relative outperformer. For one, the U.S. is the largest oil producer in the world, so higher prices aren’t as problematic as they are for net-importing countries. Second, with the U.S. labor market still in solid shape, the FOMC doesn’t have to worry about the second half of its dual mandate.
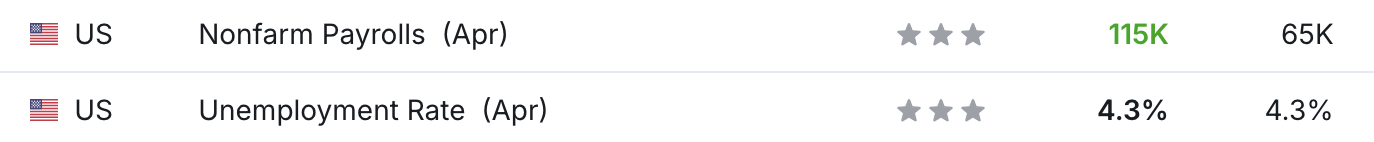
The BLS reported on May 8 that “Total nonfarm payroll employment edged up by 115,000 in April, and the unemployment rate was unchanged at 4.3 percent.” More importantly, the result outperformed economists’ consensus estimate (115k vs. 65k), reinforcing the belief that the labor market is stronger than expected.
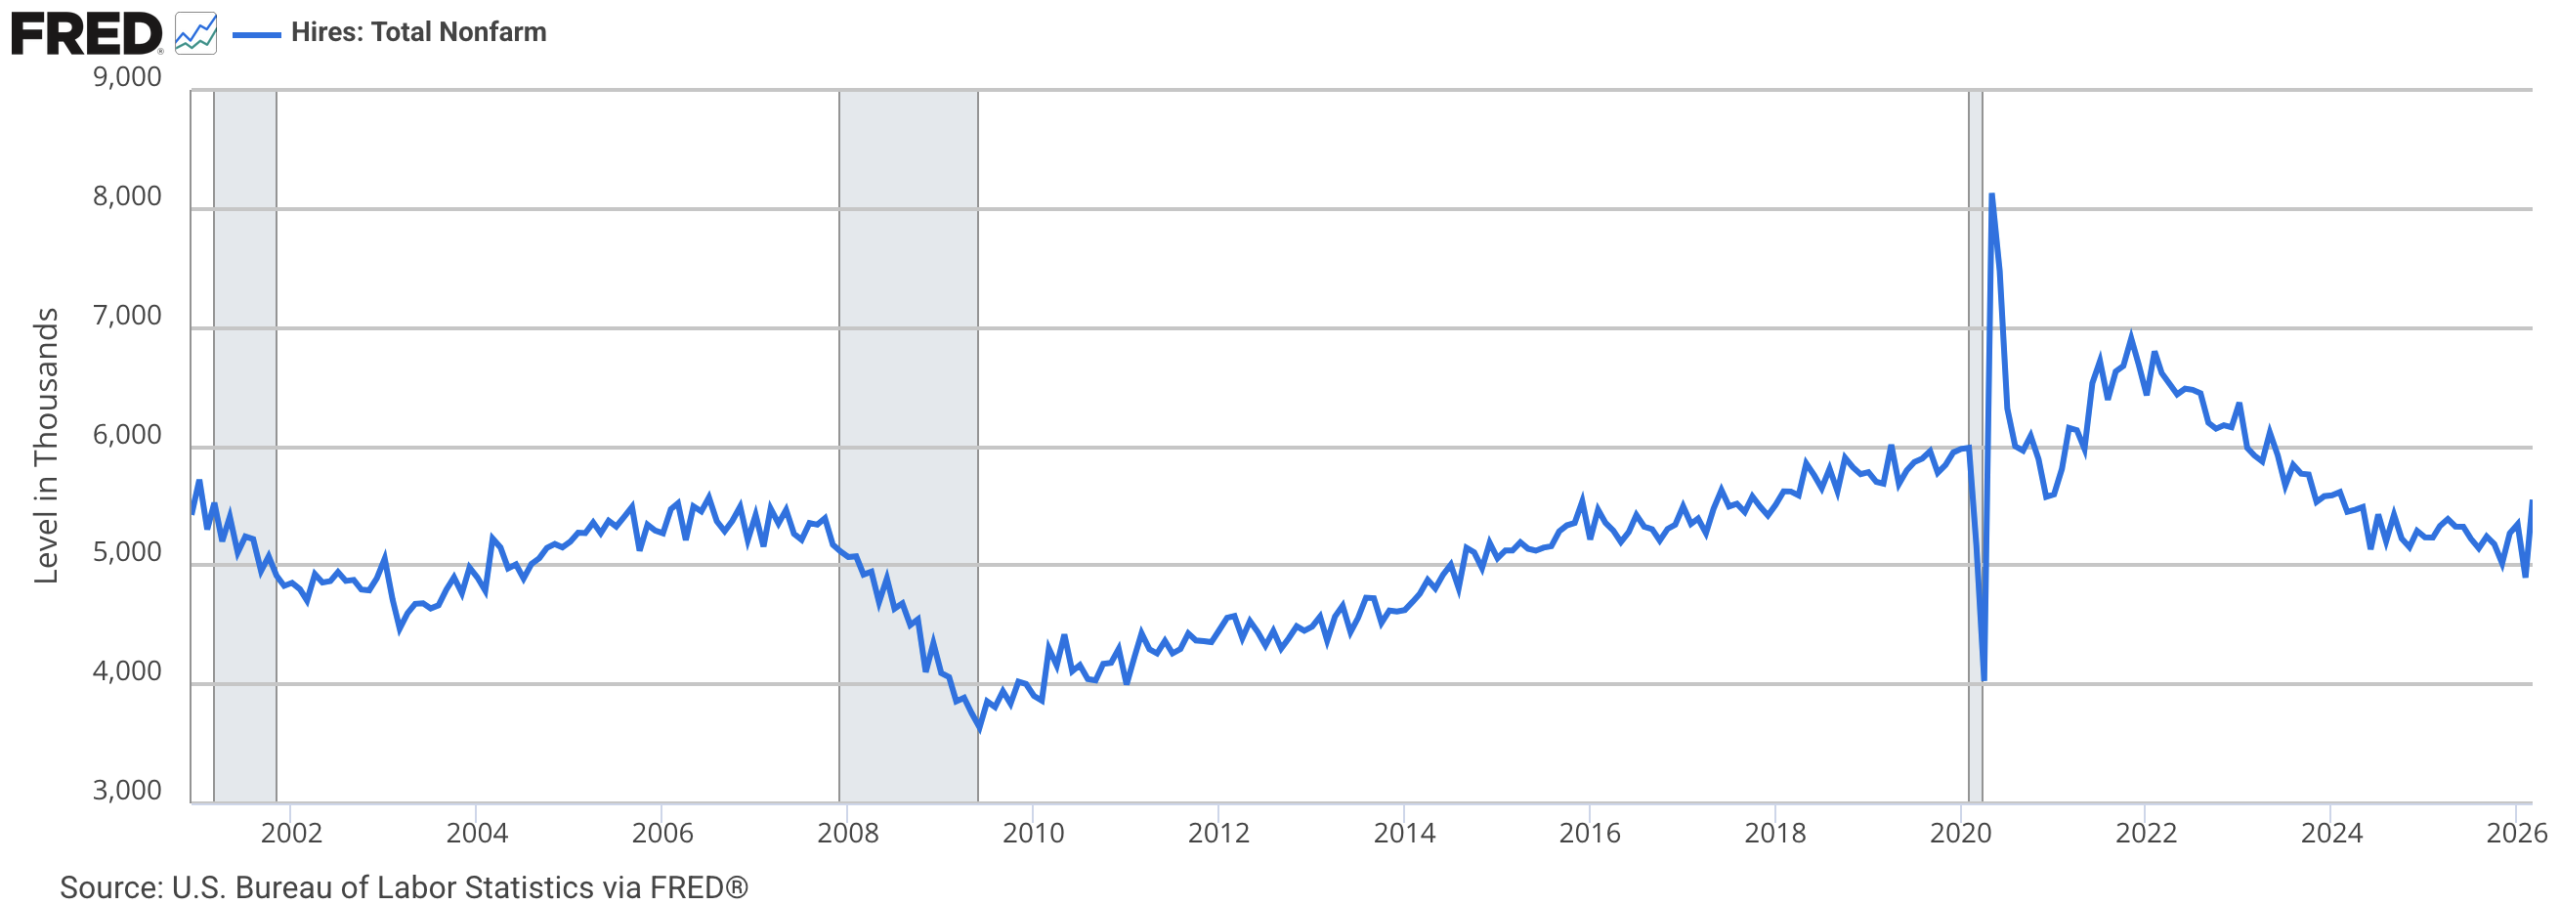
Similarly, JOLTS job openings came in at 6.866 million vs. 6.860 million on May 5, and the report noted how “The number of hires increased to 5.6 million (+655,000), and the rate increased to 3.5 percent in March, more than offsetting decreases in those measures the previous month.”
Thus, with the metric attempting to reverse its years-long downtrend, the bounce in March was welcome news for the FOMC.
Finally, a declining inventory-sales ratio could help support economic growth in the back half of the year.
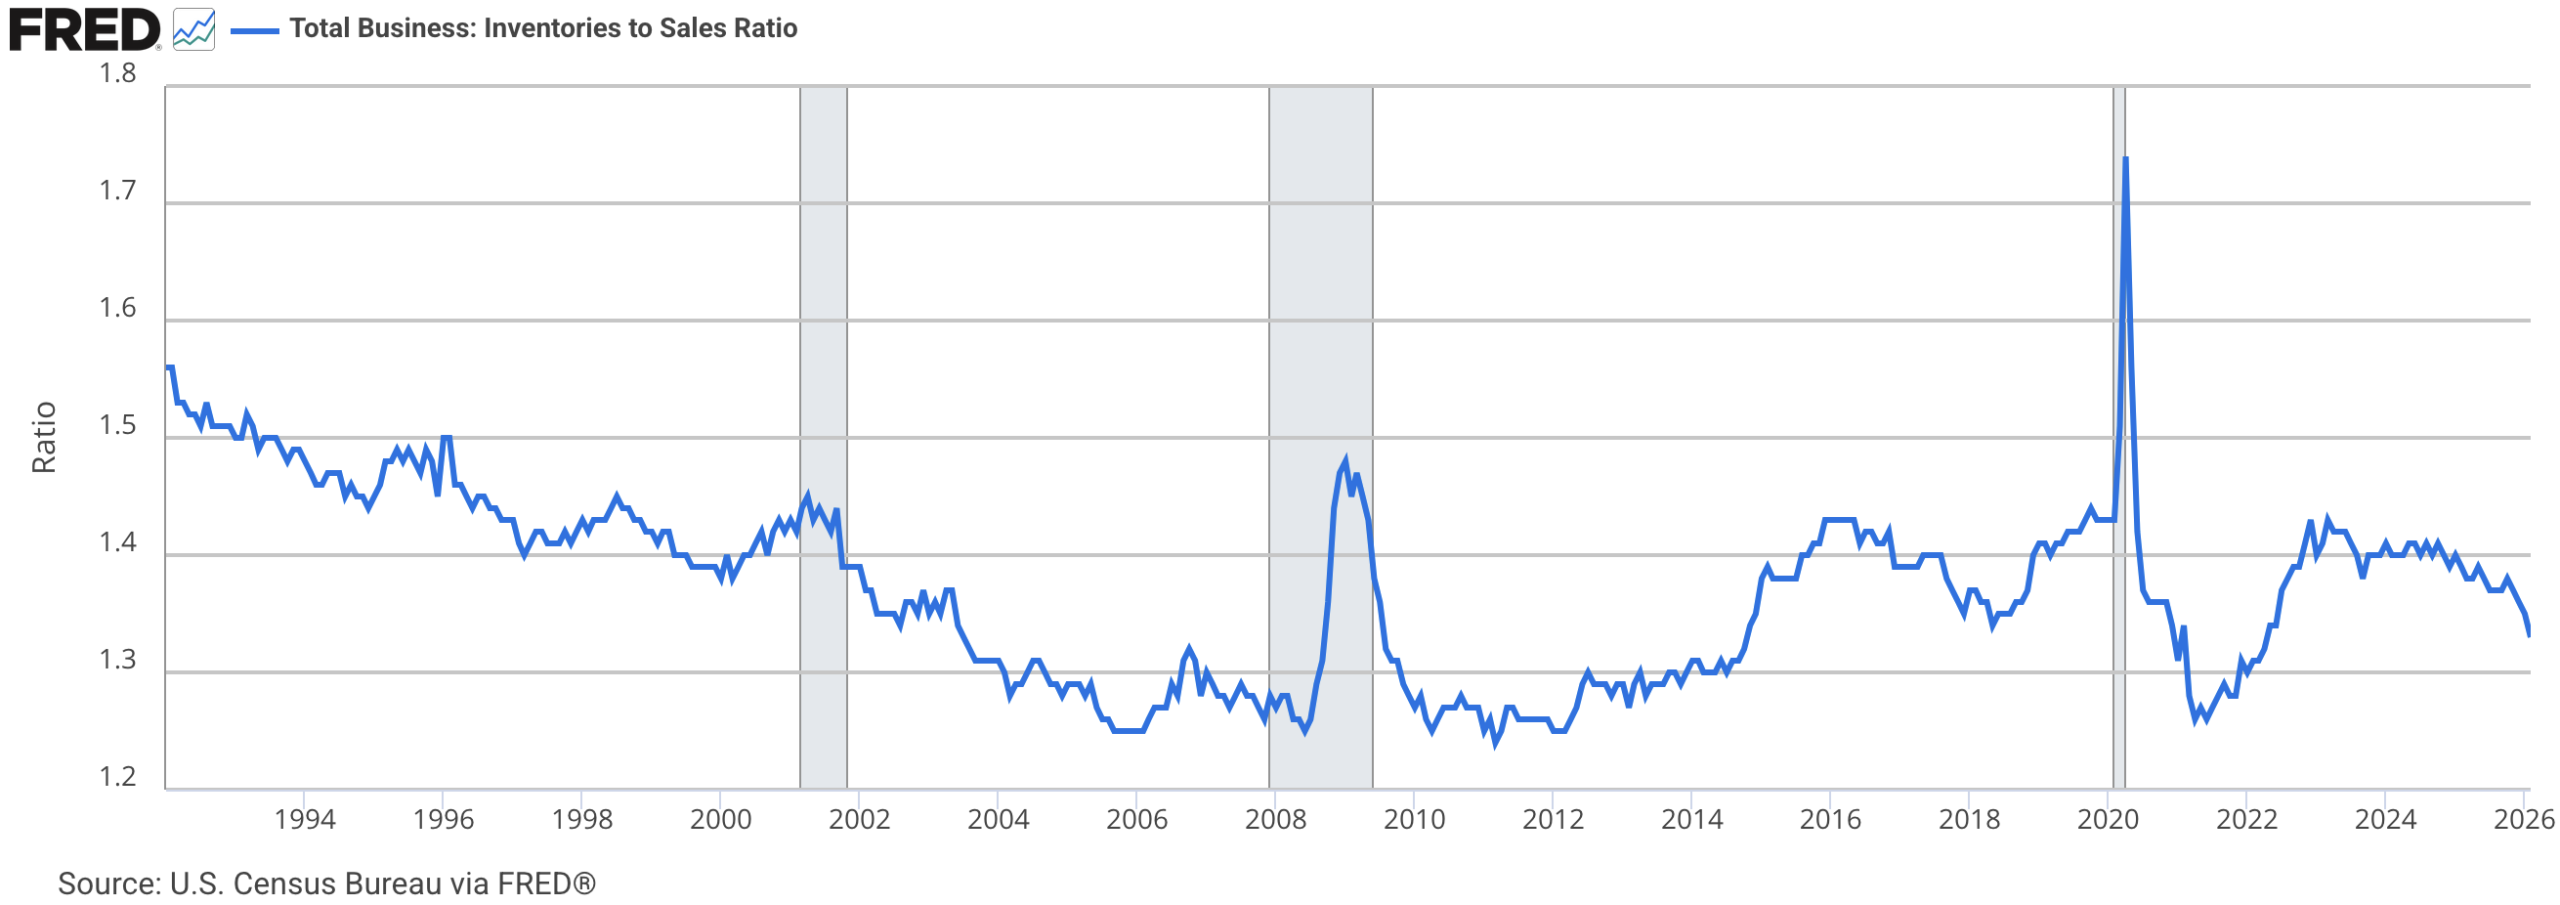
To explain, when the blue line above is falling, it means that U.S. business inventories are declining as a percentage of sales. Eventually, these firms will need to increase production to replenish their inventories, which typically supports GDP growth and employment. As a result, a potential restocking cycle could provide the FOMC with more leeway to focus on inflation rather than worry about growth and employment.
Turning to the financial markets, while volatility continues to whipsaw gold, Citigroup has mostly bullish scenarios unfolding in the months and years ahead.
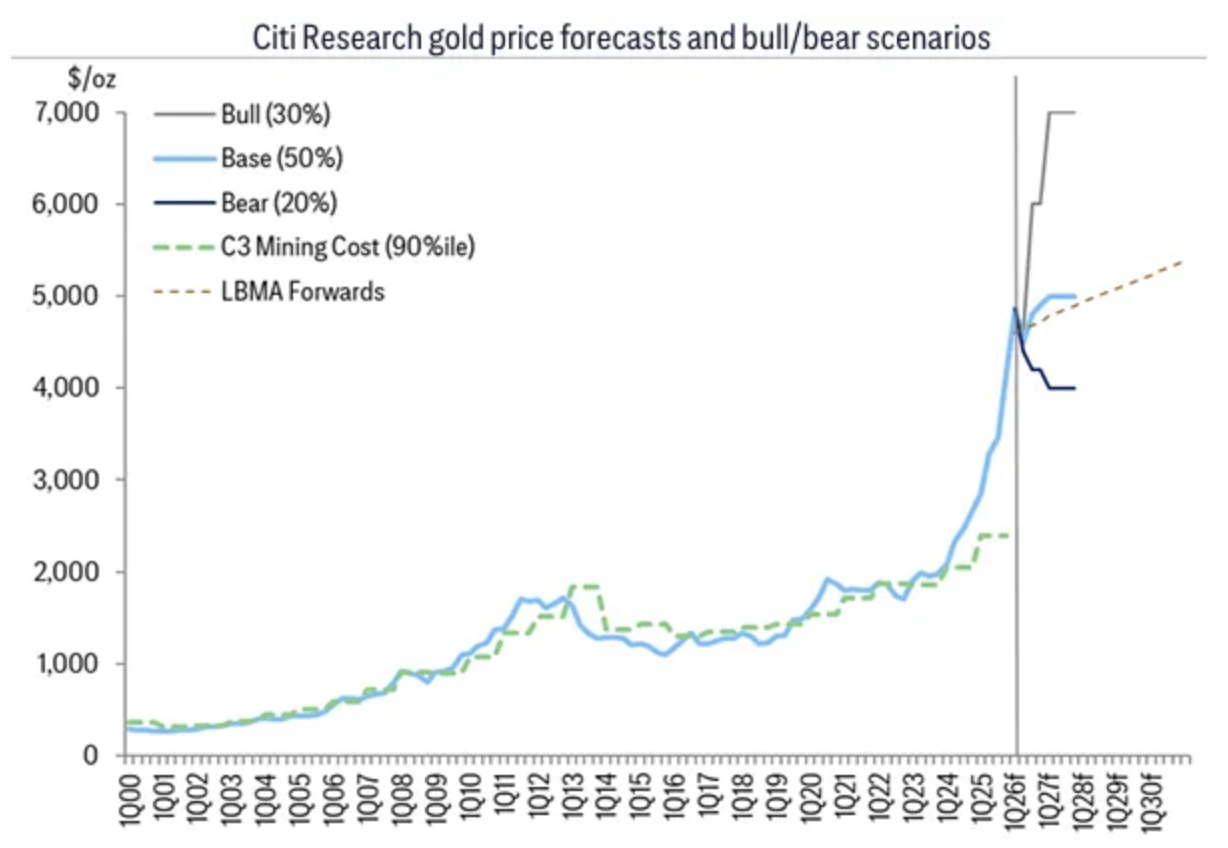
To explain, the base case (~50% probability) is a steady rise to $5,000; the bull case (~30%) is a sharp rally to $6,000 in 2026 and $7,000 in 2027 under stagflation and prolonged geopolitical stress; the bear case (~20%) is a drop to ~$4,000. Add it all up, and with the potential upside more than the potential downside, the investment bank remains constructive on gold’s future prospects.
Are you thinking about diversifying into precious metals? Talk to your financial advisor about initiating a gold IRA account today, allowing you to invest in this red-hot asset on a tax-advantaged basis. Additionally, our complimentary CPI inflation calculator remains at your disposal, enabling you to assess inflation’s impact on your finances. Please seek the guidance of a financial advisor before making any investment decision.
As a worthwhile option, Augusta Precious Metals specializes in precious metal IRAs, helping to roll your existing retirement accounts, such as a 401 (k), into IRAs backed by physical gold or silver. You can also purchase bullion directly, and the company has an exceptional reputation, with either AAA or 4.5 to 5-star reviews across multiple ratings agencies.
Furthermore, if you’re an Indiana entrepreneur looking to rebalance your investment portfolio, our guide on Selling a Business in Indiana arms you with valuation best practices, regulatory tips, and deep insights on how to think like a buyer and develop a successful sales plan.
For consumers struggling in the current K-shaped economy, credit card debt and recurring interest payments can feel like a never-ending cycle. Our guide outlines several paths to help solve the problem and rebuild your financial health, whether you have have $5,000, $10,000, or even $20,000 in debt.
Finally, if you’re unsure of the right strategy and need professional help, Beyond Finance is one of the largest debt settlement companies in the United States, specializing in unsecured claims like credit cards, personal loans, and medical bills. The firm is A+ rated by the Better Business Bureau (BBB) and is often used by Americans with at least $10,000 in unsecured debt.
by Alex Demolitor | Apr 10, 2026 | Definitions
The March 2026 Consumer Price Index of All Urban Consumers (CPI-U) report indicates that inflation increased by 0.9% this month, well above the 0.3% from February. These data were released at 8:30 am EST on April 10, 2026, by the Bureau of Labor Statistics (BLS). Before seasonal adjustment, the year-over-year (Y-o-Y) inflation rate in the all-items index grew by 3.3%, as higher oil prices had a noticeable impact.
Despite that, this month’s results missed economists’ consensus estimates. The table below is courtesy of Investing.com. The left column represents March’s figures, while the right column represents forecasters’ expectations. As you can see, the data slightly underperformed.

Yet, while a ceasefire has been reached in the U.S.-Iran conflict, the two-week moratorium creates uncertainty for investors, and therefore, the Fed. With oil prices gyrating with every headline, WTI has largely ranged between $115 and $90. And with the former poised to increase headline inflation, it makes it difficult for the FOMC to project a monetary policy path. As a result, while higher CPI prints are expected over the next few months, the duration of the conflict will likely determine the committee’s response.

Food Prices
The food index was flat in March after increasing by 0.4% MoM in February. Four major grocery indices declined this month, while one increased and the other was flat.
- Cereals and bakery products (-0.6%)
- Meats, poultry, fish, and eggs (-0.6%)
- Dairy and related products (-0.6%)
- Fruits and vegetables (+1.0%)
- Nonalcoholic beverages (-0.3%)
- Other food at home (+0.0%)
In addition, the food away from home index increased by 0.2%, as restaurant inflation outpaced grocery inflation in March.
Energy Prices
The energy index soared by 10.9% MoM in March, the largest monthly increase since September 2005. Gasoline prices jumped by 21.2% (the largest monthly increase since the series was first published in 1967), while electricity rose by 0.8%, and natural gas fell by 0.9%.
Core CPI
The March core CPI rose by 2.6% Y-o-Y, slightly above the 2.5% print from February. Below is an itemized breakdown of the various components:
- Shelter index: (+0.3%) [February: +0.2%]
- Rent index: (+0.2%) [February: +0.1%]
- Owners’ equivalent rent: (+0.3%) [February: +0.2%]
- Motor vehicle insurance: (0.0%) [February: -0.3%]
- Medical care services: (+0.0%) [February: +0.6%]
- Physician services: (+0.7%) [February: +0.3%]
- Hospital services: (+0.4%) [February: +0.6%]
- Airline fares: (+2.7%) [February: +1.4%]

Seasonally Unadjusted CPI
Before seasonal adjustments, the CPI-U for March 2025 increased by 3.3% Y-o-Y to an index level of 330.213. Since these figures are unadjusted, they include regular seasonal price fluctuations that can create volatility in the results.
Waiting For Clarity
With the U.S.-Iran conflict a tailwind for inflation, resilient economic data makes it easier for the FOMC to take a cautious approach. For example, after the U.S. economy shed 92,000 jobs in February, the March Employment Situation report was much more optimistic. The release noted how nonfarm payrolls increased by 178,000 in March and the unemployment rate fell to 4.3%.
Moreover, the figures easily surpassed economists’ consensus estimates (the numbers on the right), and even though wage inflation decelerated, it still outpaced the Y-o-Y CPI in March.

In addition, ADP’s weekly employment tracker has remained resilient, with the firm noting on Apr. 7 that “For the four weeks ending March 21, 2026, U.S. private employers added an average of 26,000 jobs a week. It was the third straight week of improvement in hiring.”
As such, while February was a struggle, the employment data in March held strong, despite the ongoing conflict and its impact on commodity prices and business sentiment.

Finally, the Lewis-Mertens-Stock Weekly Economic Index (WEI) has actually increased since the onset of the war, and has slowly crept higher since bottoming in 2023. For context, “The WEI is a composite of 10 weekly economic indicators” that uses “timely and relevant high-frequency data” to create “a single index of weekly economic activity.” In a nutshell: it uses consumer, labor market, and production data to gauge the strength of the U.S. economy. And with the metric still relatively elevated, it hasn’t signaled any stress as of Apr. 4.

Turning to the financial markets, while gold has corrected sharply amid the recent volatility, Goldman Sachs still expects the yellow metal to hit $5,400 by the end of 2026.

To explain, the investment bank sees speculative trading flows adding $195, 50 basis points of Fed rate cuts adding $120, and more central bank purchases adding $535. Add it all up, and there could be plenty of upside once the war uncertainty dissipates.
Are you thinking about diversifying into precious metals? Talk to your financial advisor about initiating a gold IRA account today, allowing you to invest in this red-hot asset on a tax-advantaged basis. Additionally, our complimentary CPI inflation calculator remains at your disposal, enabling you to assess inflation’s impact on your finances. Please seek the guidance of a financial advisor before making any investment decision.
As a worthwhile option, Augusta Precious Metals specializes in precious metal IRAs, helping to roll your existing retirement accounts, such as a 401 (k), into IRAs backed by physical gold or silver. You can also purchase bullion directly, and the company has an exceptional reputation, with either AAA or 4.5 to 5-star reviews across multiple ratings agencies.
Furthermore, if you’ve built a thriving business and are looking to cash in on your success, it’s essential to think from a buyer’s perspective. Our extensive guide covers prep work, valuation, marketing, and provides other useful tips to help you create a professional pitch. We also have more valuation resources to help better understand the key financial metrics that can make or break a deal.
In addition, if you own an HVAC business in Texas, our niche guide is the perfect playbook to help you obtain the best price.
On top of that, there are several debt management firms that can help get your finances back on track. And with TurboDebt specializing in unsecured claims (like credit cards, personal loans, medical bills, and collections), it’s the perfect consultant to help connect you with the right professional. The company has over 15,000 combined reviews on Trustpilot and the Better Business Bureau (BBB), and with an average rating of nearly 4.9/5, it may be a suitable solution for you.
by Alex Demolitor | Mar 11, 2026 | Definitions
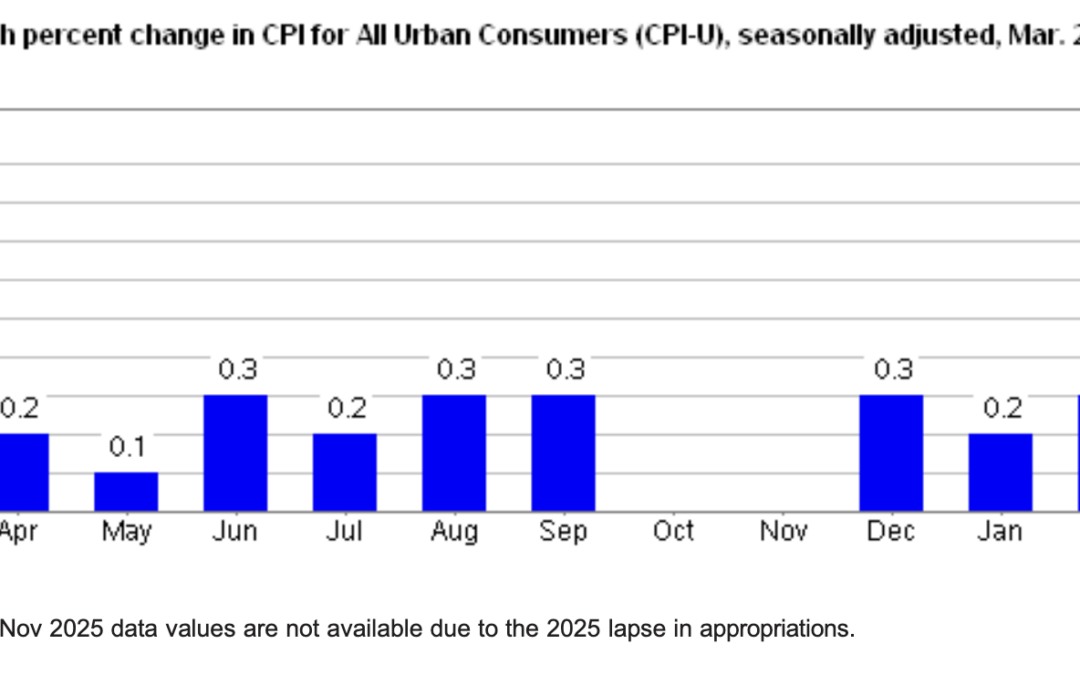
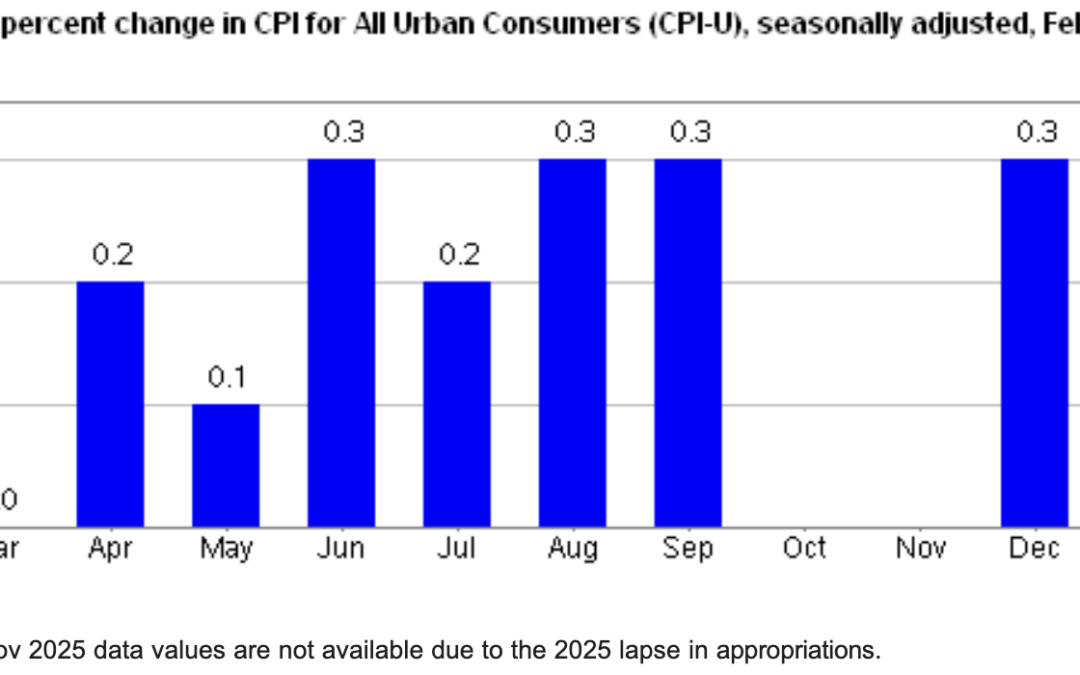
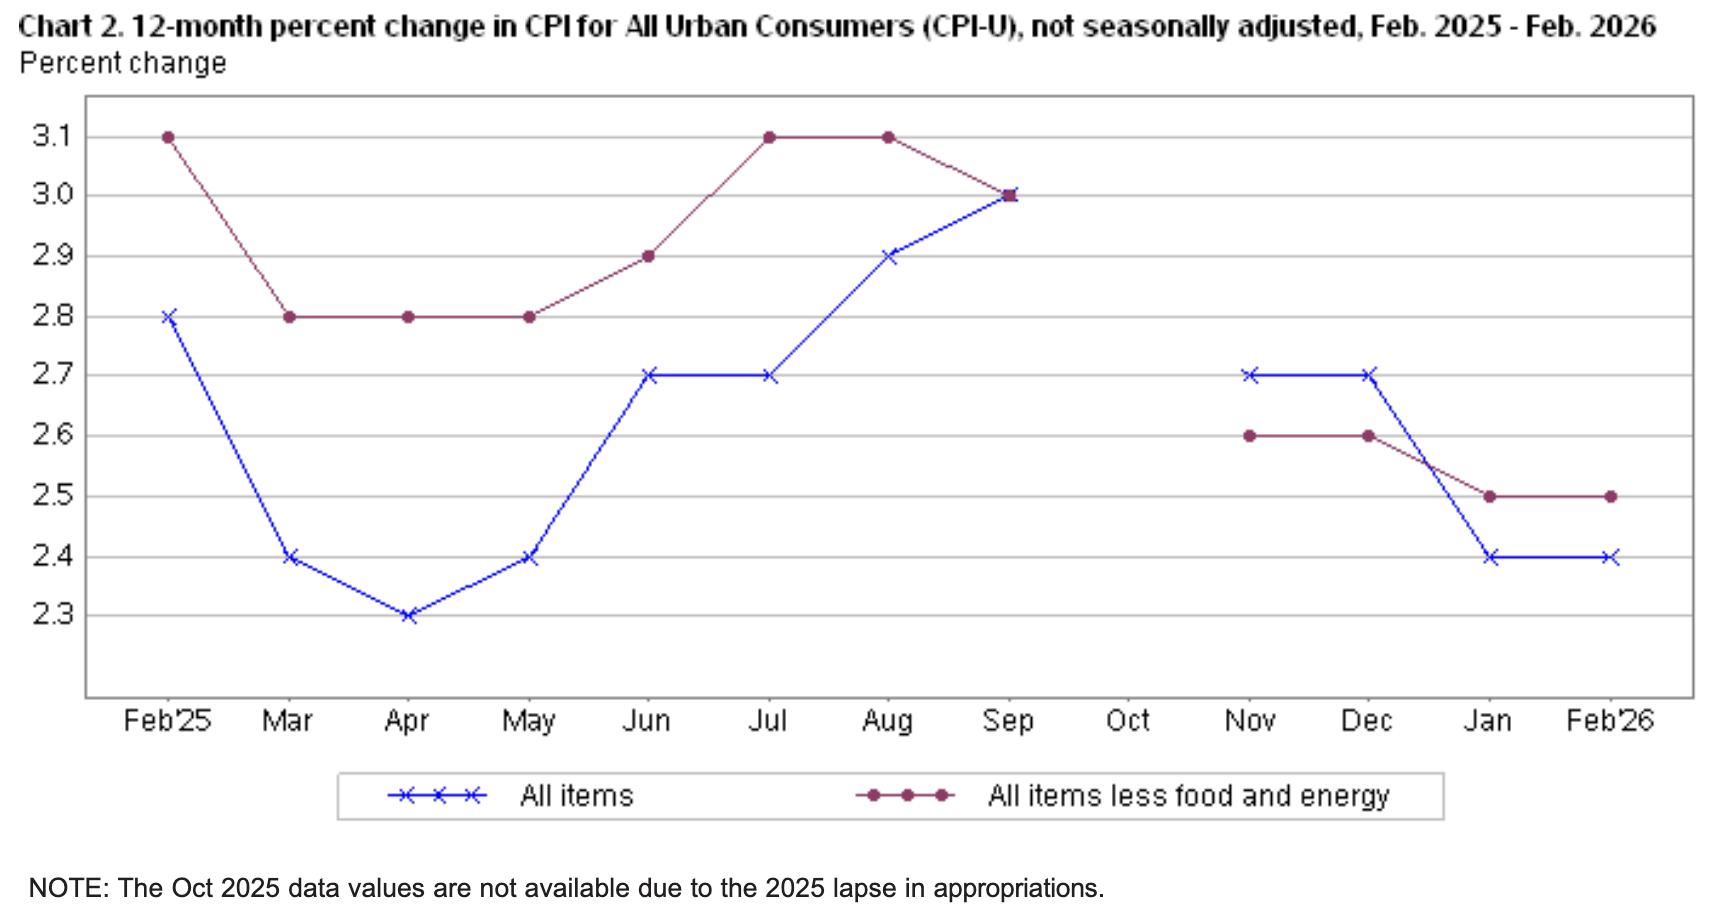
The February 2026 Consumer Price Index of All Urban Consumers (CPI-U) report indicates that inflation increased by 0.3% this month, up from the 0.2% rise in January. These data were released at 8:30 am EST on March 11, 2026, by the Bureau of Labor Statistics (BLS). Before seasonal adjustment, the year-over-year (Y-o-Y) inflation rate in the all-items index grew by 2.4%, matching the annualized figure from January.
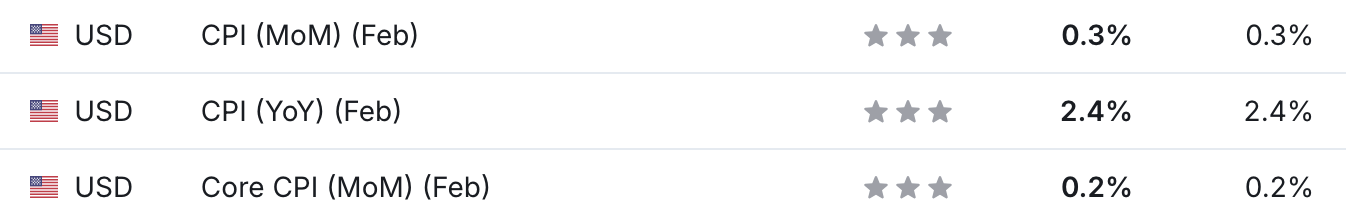
It was a relatively uneventful CPI release as the figures aligned with economists’ consensus estimates. The table below is courtesy of Investing.com. The left column represents February’s figures, while the right column represents forecasters’ expectations. As you can see, there were no surprises in February.
Yet, with troubling developments unfolding in the Middle East, the recent spike in oil prices could derail investors’ hopes for future rate cuts. The only game plan is to observe how the drama unfolds, as a short-term disruption and a dramatic drop in Brent and WTI futures could facilitate further normalization. If not, and prices hover above $100 a barrel for a sustained period, the FOMC may face some tough choices over the next few months.

Food Prices
The food index rose by 0.4% MoM in February, double the monthly rate from January. Three major grocery indices increased this month, one was flat, and two decreased.
- Cereals and bakery products (-0.2%)
- Meats, poultry, fish, and eggs (+0.0%)
- Dairy and related products (-0.6%)
- Fruits and vegetables (+1.4%)
- Nonalcoholic beverages (+0.8%)
- Other food at home (+0.8%)
Back on track, the food away from home index increased by 0.3% in February (versus 0.1% in January), as restaurant inflation showcased strength once again.
Energy Prices
The energy index rose by 0.6% MoM in February after dropping by 1.5% in January. Gasoline prices rose by 0.8%, electricity fell by 0.7%, and natural gas jumped by 3.1%.
Core CPI
The February core CPI rose by 2.5% Y-o-Y, matching the 2.5% print from January and a decline from 2.6% in December. Below is an itemized breakdown of the various components:
- Shelter index: (+0.2%) [January: +0.2%]
- Rent index: (+0.1%) [January: +0.2%]
- Owners’ equivalent rent: (+0.2%) [January: +0.2%]
- Motor vehicle insurance: (-0.3%) [January: -0.4%]
- Medical care services: (+0.6%) [January: +0.3%]
- Physician services: (+0.3%) [January: +0.3%]
- Hospital services: (+0.6%) [January: +0.9%]
- Airline fares: (+1.4%) [January: +6.5%]
Seasonally Unadjusted CPI
Before seasonal adjustments, the CPI-U for February 2025 increased by 2.4% Y-o-Y to an index level of 326.785. Since these figures are unadjusted, they include regular seasonal price fluctuations that can create volatility in the results.
Unsettling Times
With the U.S.-Iran war creating chaos in the Middle East, it’s always sad when disagreements turn into armed conflict. And while the human impact is the most troubling, a potential economic fallout could occur as well.
The recent volatility in oil prices could hurt (or help) inflation, depending on the duration of the war and the disruption in oil flows. And with the event occurring at a time when the U.S. labour market faces its own uncertainty, the Fed’s dual mandate may conflict with one another.
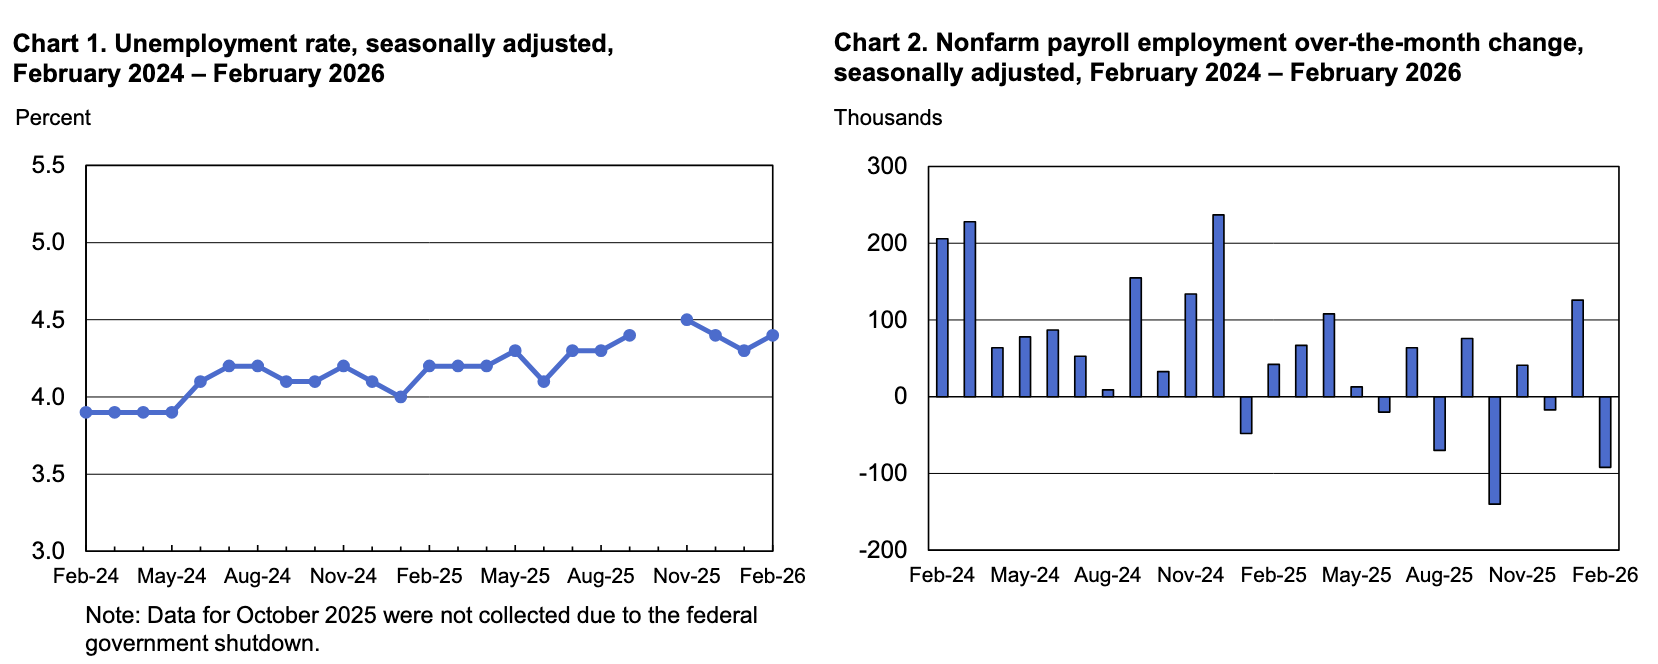
To explain, the BLS revealed on Mar. 6 that the U.S. economy shed 92,000 jobs in February, and the recent rotation between positive and negative prints creates a fragile foundation for employment. Therefore, more bad data alongside higher oil prices could have labor and inflation heading in the opposite directions.
In contrast, ADP’s February Employment Report — which uses data from private businesses — came in at +63,000 on Mar. 4. An excerpt read:
“Hiring jumped in February, delivering the best showing for job gains since November 2025. Construction, education, and health services led the growth.” Chief Economist Dr. Nela Richardson, added, “We’ve seen an increase in hiring and pay gains remain solid, especially for job-stayers.”
Thus, resilient private and shaky public payrolls data only clouds the outlook for monetary policy.
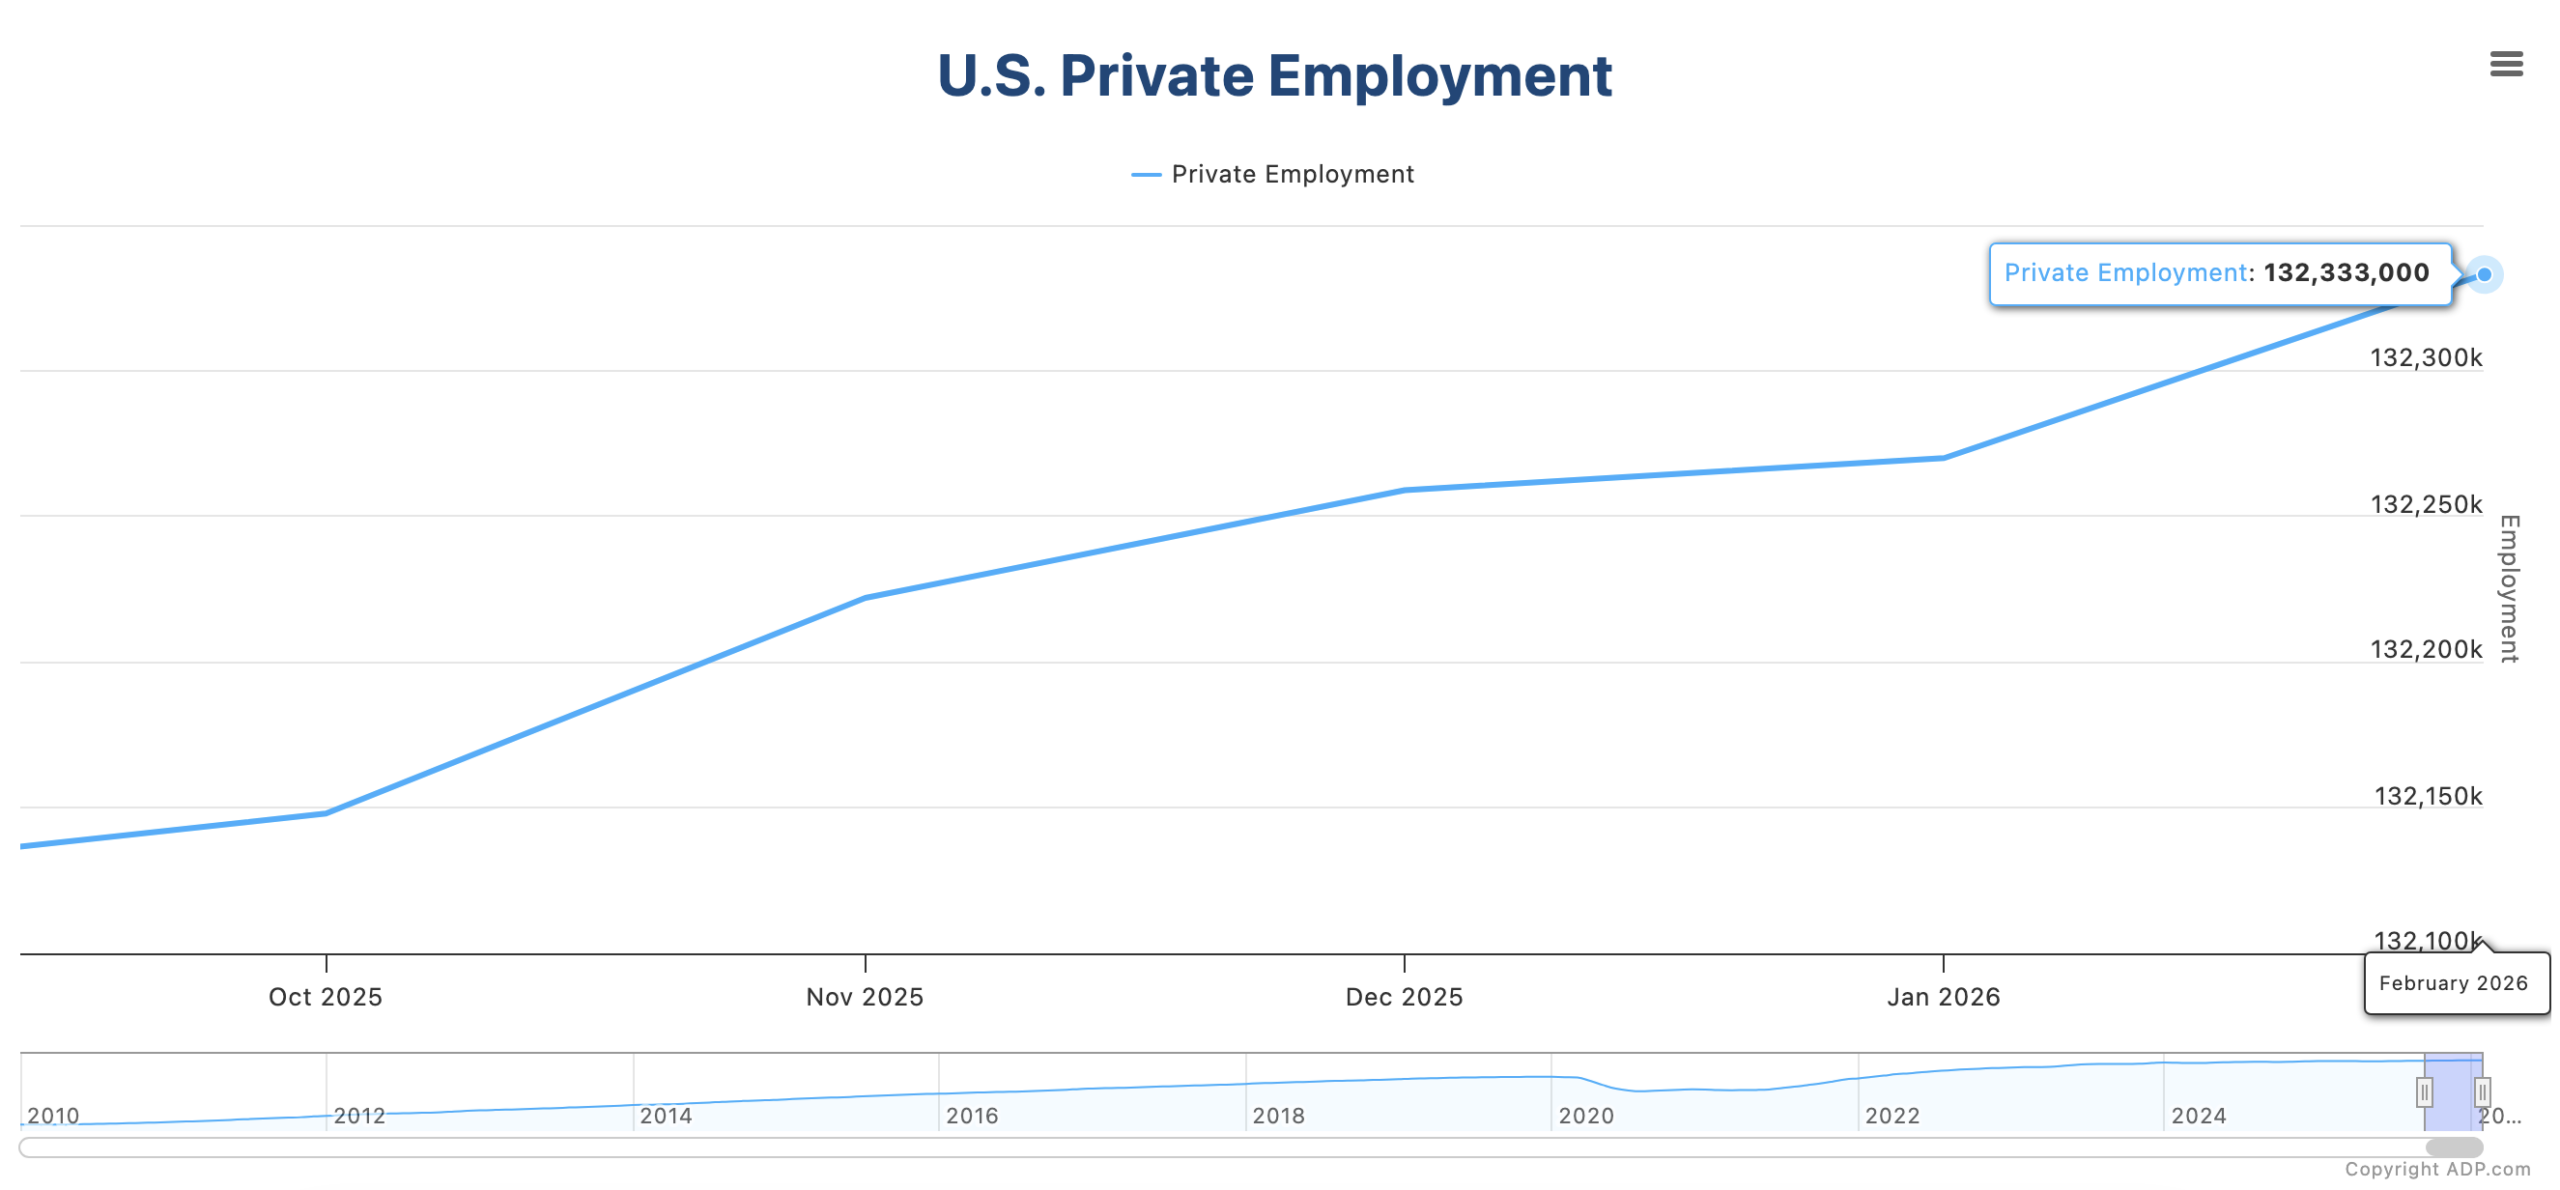
To break the tie, it’s prudent to monitor U.S. Job Postings on Indeed. Since the data set updates weekly, it’s a more timely indicator of employment demand. And because the metric has trended higher since bottoming in November 2025, it supports ADP’s results more than the BLS, aligning with a more optimistic outlook for the U.S. labor market.

Turning to the financial markets, gold and silver have been caught in the recent volatility, as the prospect of an oil-induced recession is bearish for inflation-driven assets like precious metals.
However, research from J.P. Morgan highlights how Middle East conflict is typically bullish for gold.
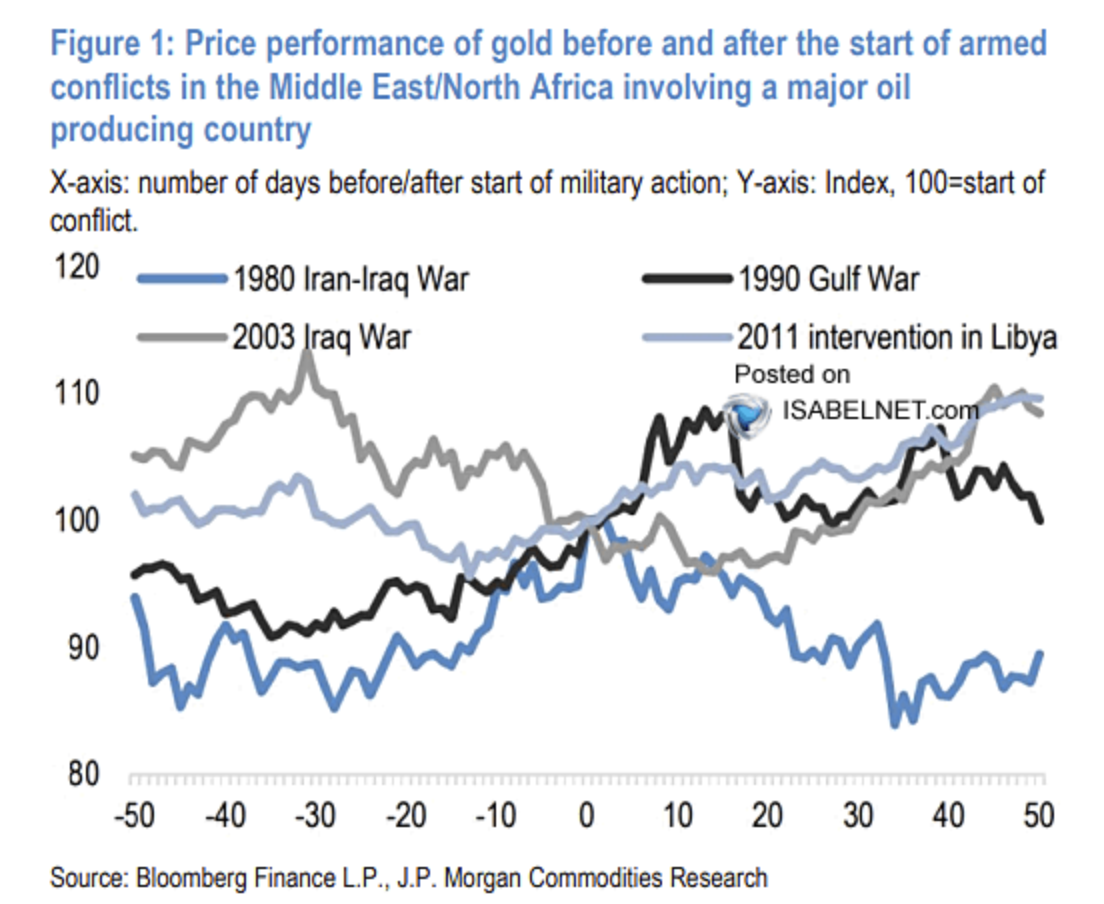
To explain, the colored lines above track the performance of gold before, during, and after conflicts in the Middle East. If you analyze the middle of the chart, the number zero on the x-axis represents the beginning of each battle. During three of the four events, gold either rose immediately or was higher within the next 50 days. As a result, the yellow metal should remain a reliable portfolio hedge during this bout of uncertainty.
Are you thinking about diversifying into precious metals? Talk to your financial advisor about initiating a gold IRA account today, allowing you to invest in this red-hot asset on a tax-advantaged basis. Additionally, our complimentary CPI inflation calculator remains at your disposal, enabling you to assess inflation’s impact on your finances. Please seek the guidance of a financial advisor before making any investment decision.
As a worthwhile option, Augusta Precious Metals specializes in precious metal IRAs, helping to roll your existing retirement accounts, such as a 401 (k), into IRAs backed by physical gold or silver. You can also purchase bullion directly, and the company has an exceptional reputation, with either AAA or 4.5 to 5-star reviews across multiple ratings agencies.
Furthermore, if you’ve built a thriving business and are looking to cash in on your success, it’s essential to think from a buyer’s perspective. Our extensive guide covers prep work, valuation, marketing, and provides other useful tips to help you create a professional pitch. We also have more valuation resources to help better understand the key financial metrics that can make or break a deal.
In addition, if you own an HVAC business in Texas, our niche guide is the perfect playbook to help you obtain the best price.
Finally, for creditor solutions, please consult our list of debt management firms for other financial resources in your area.

