Logo of New Era Debt Solutions (credit: neweradebtsolutions.com)
New Era Debt Solutions (https://neweradebtsolutions.com/) is a well-established, legitimate debt settlement company that’s been helping people get out of debt since 1999, which makes it one of the oldest debt settlement providers in America. Based in Camarillo, California, they operate nationwide (EXCEPT Maine, Oregon, and Iowa), and specialize in negotiating with creditors to settle unsecured debts, like credit card debt, personal loans and others for less than what you owe.
New Era Debt Company’s Snapshot
New Era Debt Solutions takes the #1 spot in our debt relief company rankings this year due to their combined score of 4.84/5 stars, as you can see below. This objective score takes into account their ratings on multiple third-party review sites.
New Era Debt Solutions has a good profile on Google reviews
What Services Does New Era Debt Offer?
New Era primarily offers debt settlement services, meaning they work with your creditors to reduce the total amount you owe. This service is specifically for unsecured debt (like credit cards, medical bills, personal loans and certain other types of debt). Their service cannot help for things like mortgages or student loans.
New Era Debt aims to create a plan that helps you become debt-free in as little as 24 to 48 months. One of the standout aspects of New Era is that they don’t charge any upfront fees. You only pay them when they’ve successfully settled your debt and you have agreed with their plan.
Reputation & Legitimacy Factors
In terms of reputation, New Era Debt Solutions has solid reviews across multiple platforms, as we covered earlier in the “company’s snapshot” section. They hold an A+ rating with the Better Business Bureau (BBB).
On Trustpilot, they’ve received mostly positive reviews, with customers praising them for professionalism and their ability to reduce large amounts of debt. Like any company, there are a few negative reviews, but those are often about the downsides of debt settlement itself (such as its impact on credit scores), rather than the company’s service.
Management Team
New Era’s CEO, Dan Smith, has a strong background in finance and a focus on ethical, transparent practices. The company is committed to not only helping clients get out of debt but also educating them on how to stay out of it in the future. They pride themselves on being a debt settlement company that actually does the work in-house—they do not outsource anything, so you’re always dealing with New Era directly.
Which States Do They Cover?
New Era Debt Solutions serves clients across the United States, except in the states of Maine, Oregon, and Iowa as we covered in the beginning of this article. This may change in the future, so it’s always a good idea to fill out their pre-qualification form to see if your address allows debt settlement and if New Era operates there.
What’s the Process Like?
When you sign up, you’ll first have a consultation to review your financial situation. After that, they’ll create a plan tailored to your debt and begin negotiating with your creditors. You’ll make monthly payments into an escrow account while New Era works to settle your debts for less than what you owe. It’s a fairly straightforward process, but as with any debt settlement plan, it’s important to know that your credit score will take a hit. While under negotiation, there are also risks like collection calls or lawsuits.
Is New Era Debt Solutions Right for You?
New Era Debt Solutions has been around for over 20 years, and their track record, coupled with strong reviews and no upfront fees, makes them a legitimate option if you’re considering debt settlement. They are especially appealing if you’re struggling with large amounts of unsecured debt and need an alternative to bankruptcy. That said, debt settlement isn’t for everyone—make sure to understand the pros and cons before diving in.
If you’re dealing with overwhelming debt due to this high-inflation economic landscape, and are looking for a company that can help you decrease and/or pay off your debt, and has a great reputation, New Era could be the right fit for you. Make sure you take advantage of their free consultation to ask which of their various debt relief options is best for you.
FAQ
Here’s a frequently asked questions (FAQ) section covering the most common questions new users have about New Era Debt Solutions:
1. How much does New Era Debt Solutions charge?
New Era charges between 14% and 23% of the initial enrolled debt amount. There are no upfront fees; they only get paid when they successfully negotiate a debt reduction. This is a contingency-based fee structure.
2. What types of debt does New Era handle?
They handle unsecured debts like credit card debt, personal loans, private student loans, medical bills, and some types of business debts. They do not handle secured debts like mortgages or car loans.
3. Will using New Era affect my credit score?
Yes, debt settlement, regardless of which company you choose to work with, will negatively impact your credit score. Settling a debt means paying less than the full amount owed, which creditors deem a negative event. However, the impact is less damaging than bankruptcy.
4. Is New Era Debt Solutions accredited and reputable?
Yes, New Era has BBB accreditation and has an A+ rating. They have generally positive reviews from clients on platforms like TrustPilot and the BBB website.
5. Where is New Era available?
New Era is accessible in 46 states as well as Washington D.C. and the Virgin Islands. They do NOT operate in Maine, Oregon, and Iowa.They collaborate with the Consumer First Legal Network to offer services in certain states where they may not directly operate.
6. What happens if a creditor refuses to settle?
If a creditor refuses to negotiate, they could potentially take legal action, which might result in lawsuits or wage garnishments. However, most creditors prefer to negotiate rather than pursue costly legal action.
7. How long does the debt settlement process take?
The typical debt settlement program with New Era takes around 28 months. The exact duration depends on the amount of debt, your monthly contributions, and how quickly creditors agree to settlements.
8. Can I cancel my program with New Era Debt Solutions?
Yes, clients can cancel their program with New Era at any time. However, any funds put towards fees or those that are in the dedicated account may be subject to the terms of the cancellation agreement.
Amine Rahal
Amine is an entrepreneur, investor and financial writer that covers the US economy, inflation, alternative investments, cryptocurrencies and more. He has been involved in the space for over a decade.
Lauren Brown
Lauren has over 13 years of experience in wealth management and financial planning. She is a CFA charterholder and holds a Bachelor’s degree in Finance. Lauren has worked with several asset management firms, offering wealth advisory and portfolio management services to high-net-worth clients.
In the realm of economics, three terms often crop up in discussions about the health of an economy: inflation, recession, and depression. While they are interconnected in various ways, each term represents a distinct economic phenomenon with different implications for the economy and, by extension, for investors, businesses, and consumers. This article will delve into the definitions of inflation, recession, and depression and explore how they are linked. Let’s start by looking at a comparison table:
Inflation
Recession
Depression
Definition
General increase in prices.
Significant decline in economic activity, typically for two quarters or more.
Severe and prolonged downturn in economic activity.
Impact on Economy
Decreases purchasing power. Can stimulate economic activity when moderate, but leads to instability when too high.
Results in higher unemployment, decreased consumer spending, and economic slowdown.
Severe declines in employment and production, often causing significant economic hardship.
Common Causes
Excessive growth in the money supply, demand-pull, or cost-push factors.
Various, including financial crises, economic bubbles, or external shocks.
Often a severe or prolonged recession, but can also be caused by a financial crisis or large-scale economic dislocation.
Central Bank Response
May raise interest rates to slow economic activity and curb inflation.
May lower interest rates and increase government spending to stimulate economic activity.
Similar to recession, but response typically needs to be larger and more sustained. May involve significant fiscal policy responses as well.
Link to Other Two Terms
High inflation can lead to a recession. Recession can lead to low inflation or deflation.
Can turn into depression if severe and prolonged. Lower demand during a recession can lead to lower inflation.
Could lead to deflation due to lower demand. However, policy responses could potentially lead to inflation.
Inflation
Inflation is the rate at which the general level of prices for goods and services is rising, eroding purchasing power. In other words, as inflation increases, each unit of currency buys fewer goods and services. Inflation is updated monthly.
Moderate inflation is typical in a growing economy and can even stimulate economic activity. However, if it gets out of hand, it can lead to economic instability. The BLS uses the CPI to measure inflation.
The Federal Reserve, like most central banks, aims to control inflation by adjusting interest rates. Lower interest rates encourage spending and investment, which can boost economic activity and, potentially, inflation. Higher interest rates can slow economic activity and curb inflation.
Recession
A recession is typically defined as a significant decline in economic activity spread across the economy, lasting more than a few months. This is often seen in real GDP, real income, employment, industrial production, and wholesale-retail sales. Economists generally agree that two consecutive quarters of negative GDP growth indicate a recession.
Recessions can be caused by various factors, including financial crises, external shocks, and the bursting of economic bubbles. Policymakers often respond to recessions by lowering interest rates and increasing government spending, aiming to stimulate economic activity.
Depression
A depression represents a severe and prolonged downturn in economic activity. It’s more extended and more profound than a recession, characterized by significant declines in output, employment, and trade, often lasting several years. The most notable example is the Great Depression of the 1930s.
Depressions are rare, and economists don’t have a standardized definition like they do for a recession. However, they generally agree that depressions involve a substantial contraction in economic activity that lasts several years.
How Are They Linked?
Inflation, recession, and depression are intertwined in many ways:
Inflation and Recession: Too much inflation can lead to a recession. When prices rise too quickly (hyperinflation), consumers can struggle to afford goods and services, and businesses can find it challenging to plan for the future. If the central bank tries to combat high inflation by raising interest rates too quickly, it can cool the economy too much and lead to a recession.
Recession and Inflation: On the flip side, recessions can lead to lower inflation or even deflation (a general decrease in prices). In a recession, demand for goods and services falls, which can lead to lower prices.
Recession and Depression: If a recession is particularly severe and prolonged, it can turn into a depression. While there’s no strict dividing line, depressions involve higher unemployment, lower output, and more significant declines in standards of living than recessions.
Inflation and Depression: Inflation rates during a depression can vary. Sometimes, depressions can involve deflation, as demand for goods and services falls and businesses lower prices to try to entice customers. However, economic policy responses to a depression could lead to inflation. For example, if the government responds by increasing the money supply or government spending dramatically, it could eventually lead to increased inflation.
In summary, inflation, recession, and depression are all interconnected elements of economic cycles. By understanding these terms and their relationships, we can better grasp the complexities of economic health and make
FAQ
Q1: What causes inflation? A1: Inflation can be caused by various factors, including excessive growth in the money supply, demand-pull inflation where demand for goods and services outpaces supply, or cost-push inflation where the cost of raw materials or wages increase.
Q2: How can inflation be controlled? A2: Central banks often aim to control inflation by adjusting interest rates. By raising interest rates, central banks can decrease borrowing and spending, thus reducing inflation. Conversely, lowering interest rates can stimulate borrowing and spending, potentially leading to increased inflation.
Q3: What are the signs of a coming recession? A3: Common signs of a coming recession include a decline in the GDP, higher unemployment rates, lower consumer spending, decrease in business profits, and a volatile stock market.
Q4: How can a recession affect the average person? A4: During a recession, people might face job loss or reduced working hours. They may also see the value of their investments decrease, and it could become harder to get credit.
Q5: What’s the difference between a recession and a depression? A5: The main difference between a recession and a depression is the duration and severity of the economic downturn. A recession is a temporary decline in economic activity, typically lasting six months to a year. A depression, on the other hand, is a severe and prolonged economic downturn, often lasting several years.
Q6: How do governments respond to a depression? A6: In a depression, governments may enact expansive fiscal policies, such as increasing government spending, cutting taxes, or both, to stimulate the economy. Central banks may also adopt expansionary monetary policies, such as lowering interest rates or implementing quantitative easing.
Q7: Can a depression lead to inflation? A7: A depression could potentially lead to deflation due to lower demand. However, the economic policy responses to a depression, such as increasing the money supply or government spending, could eventually lead to increased inflation.
Q8: How does a recession affect inflation? A8: A recession typically leads to lower inflation or even deflation. This is because, in a recession, the demand for goods and services falls, which can lead to lower prices. However, the specific impact on inflation can vary depending on the nature and severity of the recession, and the policy responses to it.
Q9: What role do central banks play in managing the economy through these cycles? A9: Central banks play a crucial role in managing the economy through inflation, recession, and depression. They often use tools like interest rates and open market operations to influence the money supply, aiming to stabilize prices and maintain low unemployment rates.
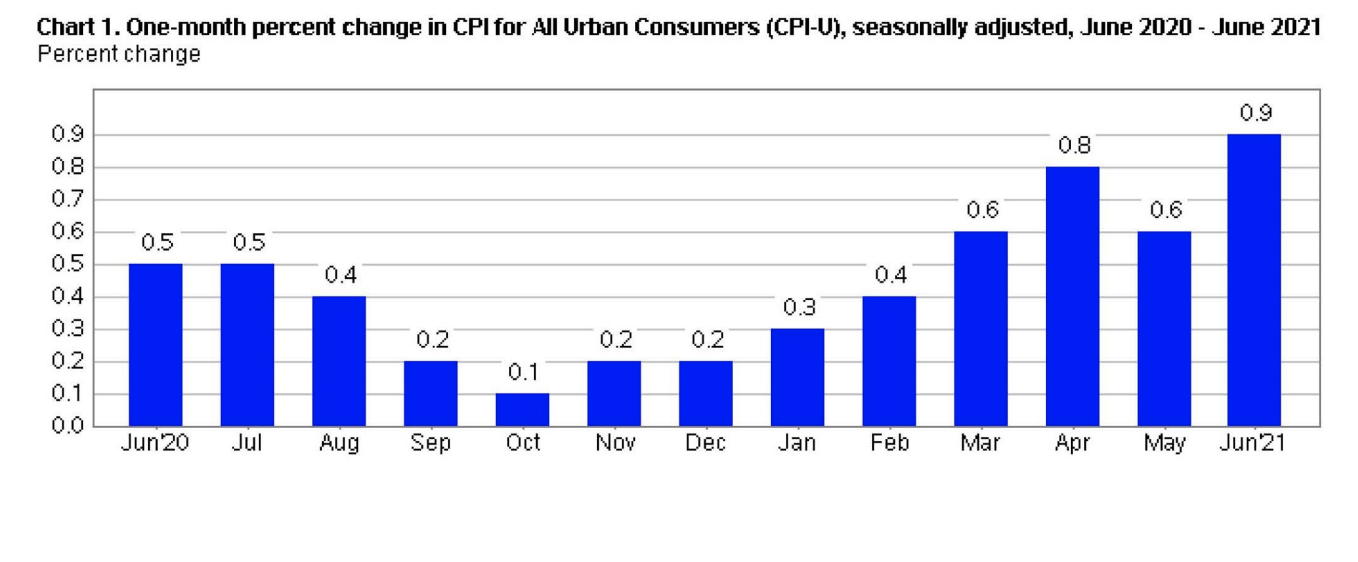
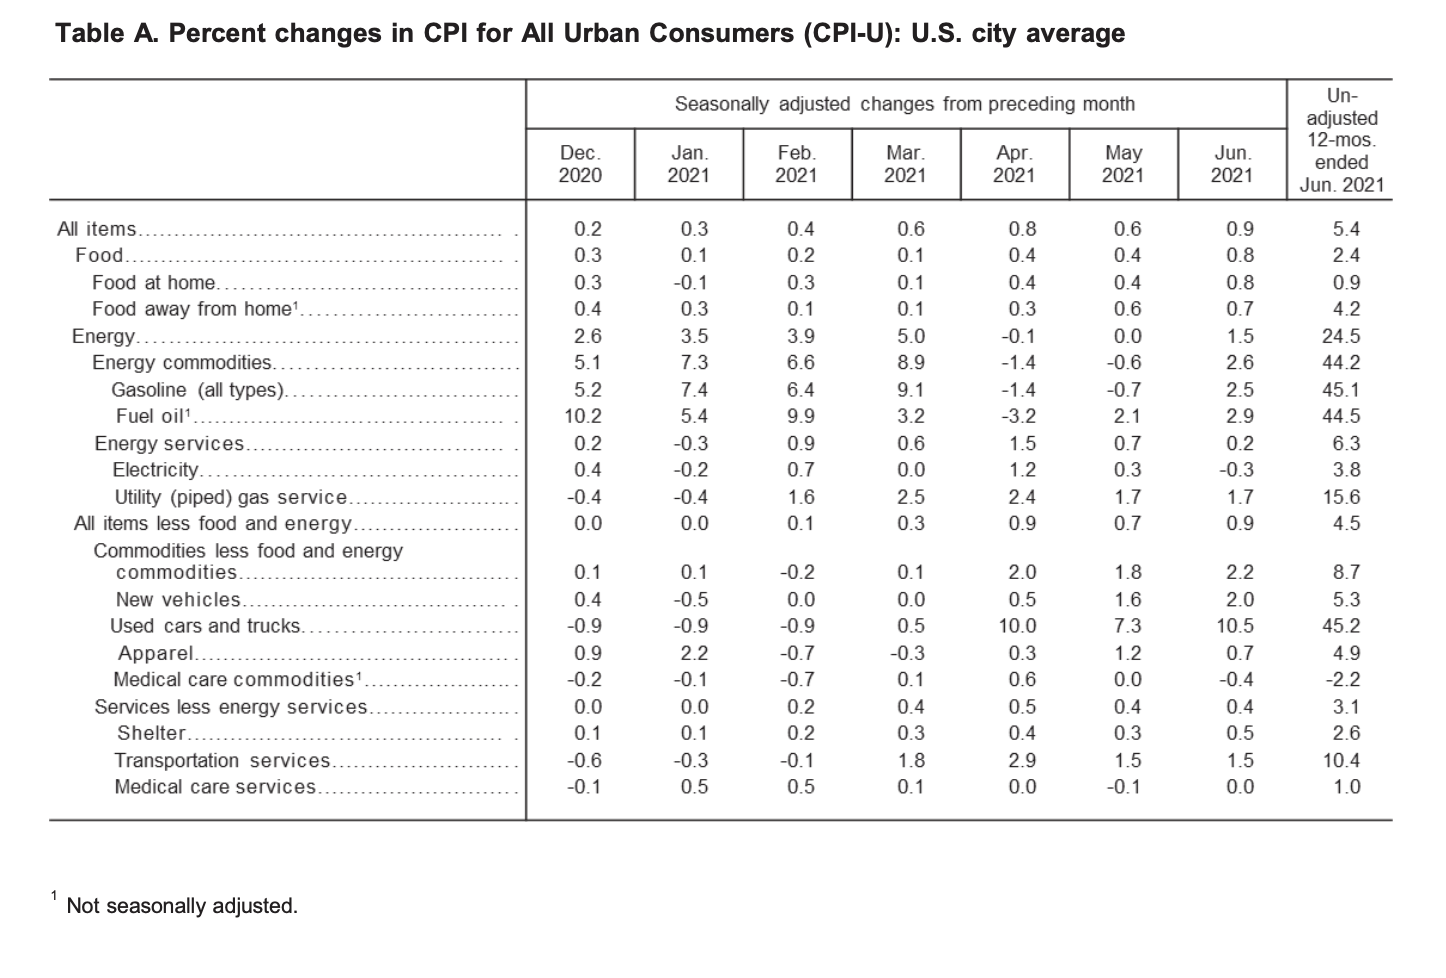
The Consumer Price Index for All Urban Consumers (CPI-U) edged up 0.9% in June on a seasonally adjusted basis, reported the US Bureau of Labor Statistics. In May, it had increased 0.6%.
“This was the largest 1-month change since June 2008 when the index rose 1%. Over the last 12 months, the all items index increased 5.4% before seasonal adjustment; this was the largest 12-month increase since a 5.4% increase for the period ending August 2008.” explained the bureau in its report.
(Source: U.S. Bureau of Labor Statistics)
Food
The index for food edged up 0.8% for the month. The index for food at home likewise increased 0.8% in June. Five of the six major grocery store category indexes all saw percentage increases over the month including the fruits and vegetables index by 0.7%, the index for meats, poultry, fish, and eggs by 2.5%, and the index for beef by 4.5%. The index for food away from home edged up 0.7% in June.
Over the last 12-month period, the food at home index rose 0.9%. All six of the component grocery store food group indexes saw percentage increases, with the fruits and vegetables index having the largest rise at 3.2%.
“The index for food away from home rose 4.2% over the last year, the largest 12-month increase in that index since the period ending in May 2009,” stated the US Bureau of Labor Statistics.
Energy
In June, the index of energy rose 1.5%. The index for gasoline rose 2.5% over the month. The price of gas increased 2.2%, prior to season adjustment. The natural gas index likewise increased 1.7%. Conversely, the index for electricity dropped 0.3% in June, after rising by 0.3% in May.
Since this time last year, the index for energy soared 24.5%. Over the last 12-month period, gas prices skyrocketed 45.1%. Likewise, the natural gas index increased 15.6%, and the electricity index rose 3.8% since this time last year.
(Source: U.S. Bureau of Labor Statistics)
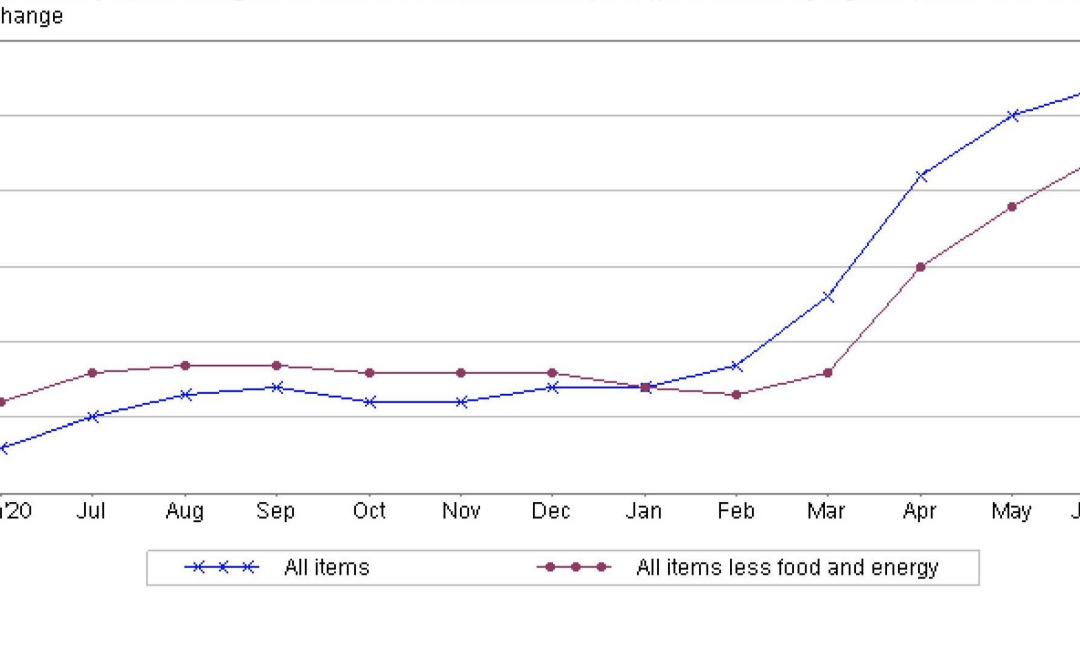
All Items Less Food and Energy
In June, the index for all items less food and energy increased 0.9%. Several of the component indexes all saw increases over the month including the shelter index by 0.5%, the index for owners’ equivalent rent rose 0.3%, and the rent index edged up 0.2%.
“The index for used cars and trucks rose sharply for the third consecutive month, increasing 10.5% in June. This was the largest monthly increase ever reported for the used cars and trucks index, which was first published in January 1953,” explained the bureau in its report.
Over the last 12 month period, the all items less food and energy index increased 4.5%.
“The index for used cars and trucks increased 45.2%, the largest 12-month change ever reported for that index. The index for new vehicles rose 5.3% over the past 12 months, its largest 12-month increase since the period ending January 1987. The motor vehicle insurance index increased 11.3% in the last year, while the index for car and truck rental rose 87.7% over that period. The shelter index increased 2.6% over the last 12 months. The medical care index rose 0.4% over the past 12 months, its smallest 12-month increase since the period ending March 1941,” reported the US Bureau of Labor Statistics.
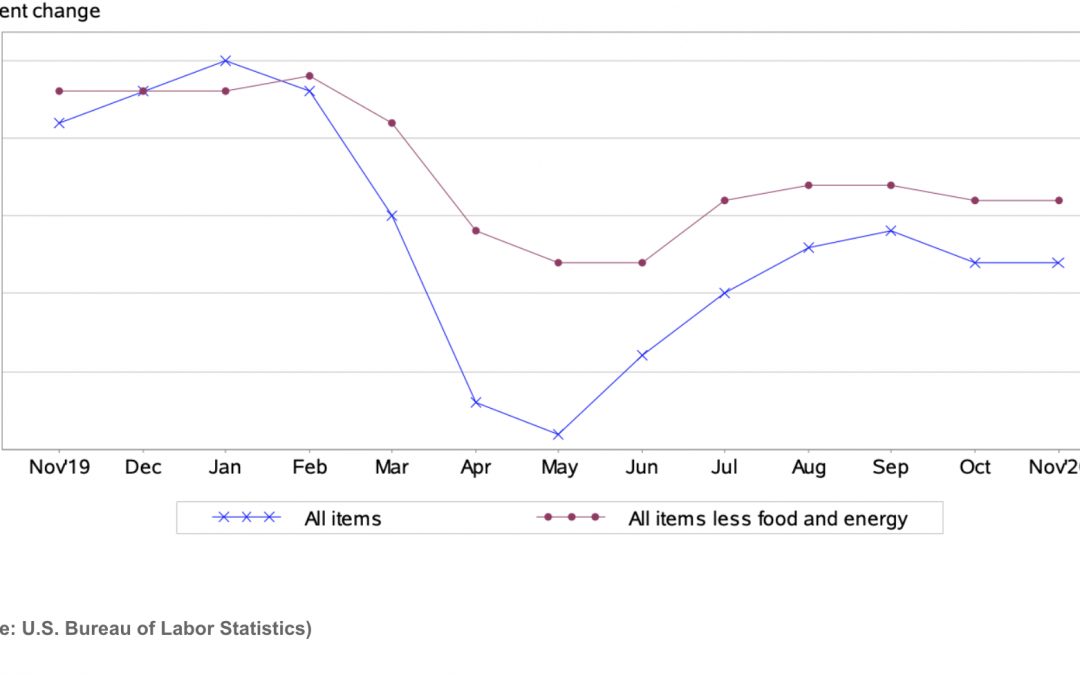
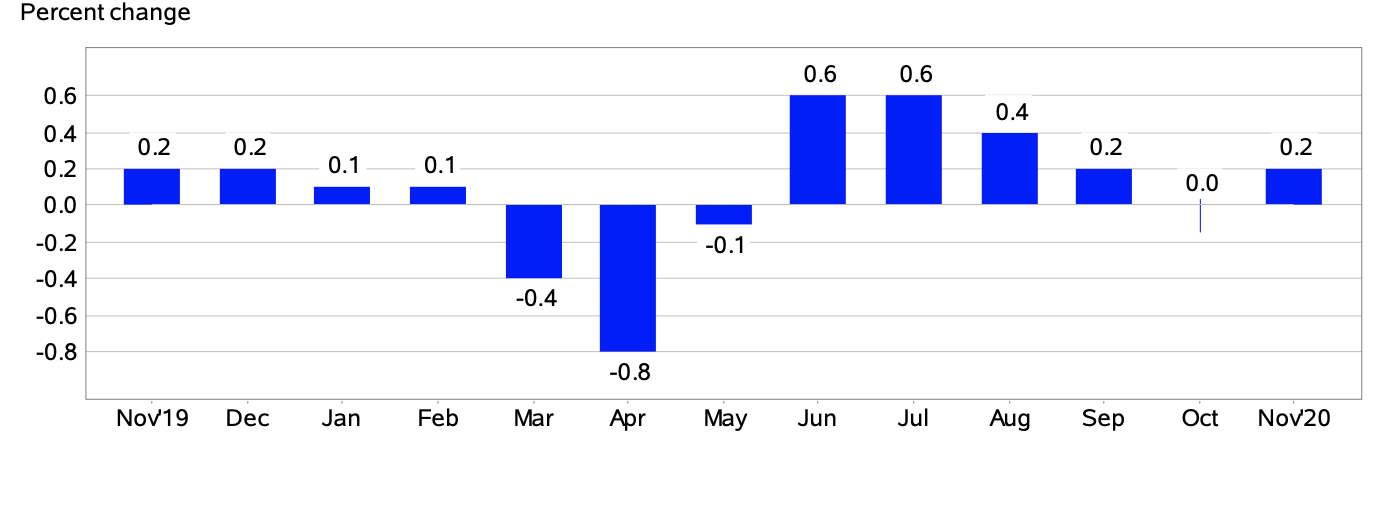
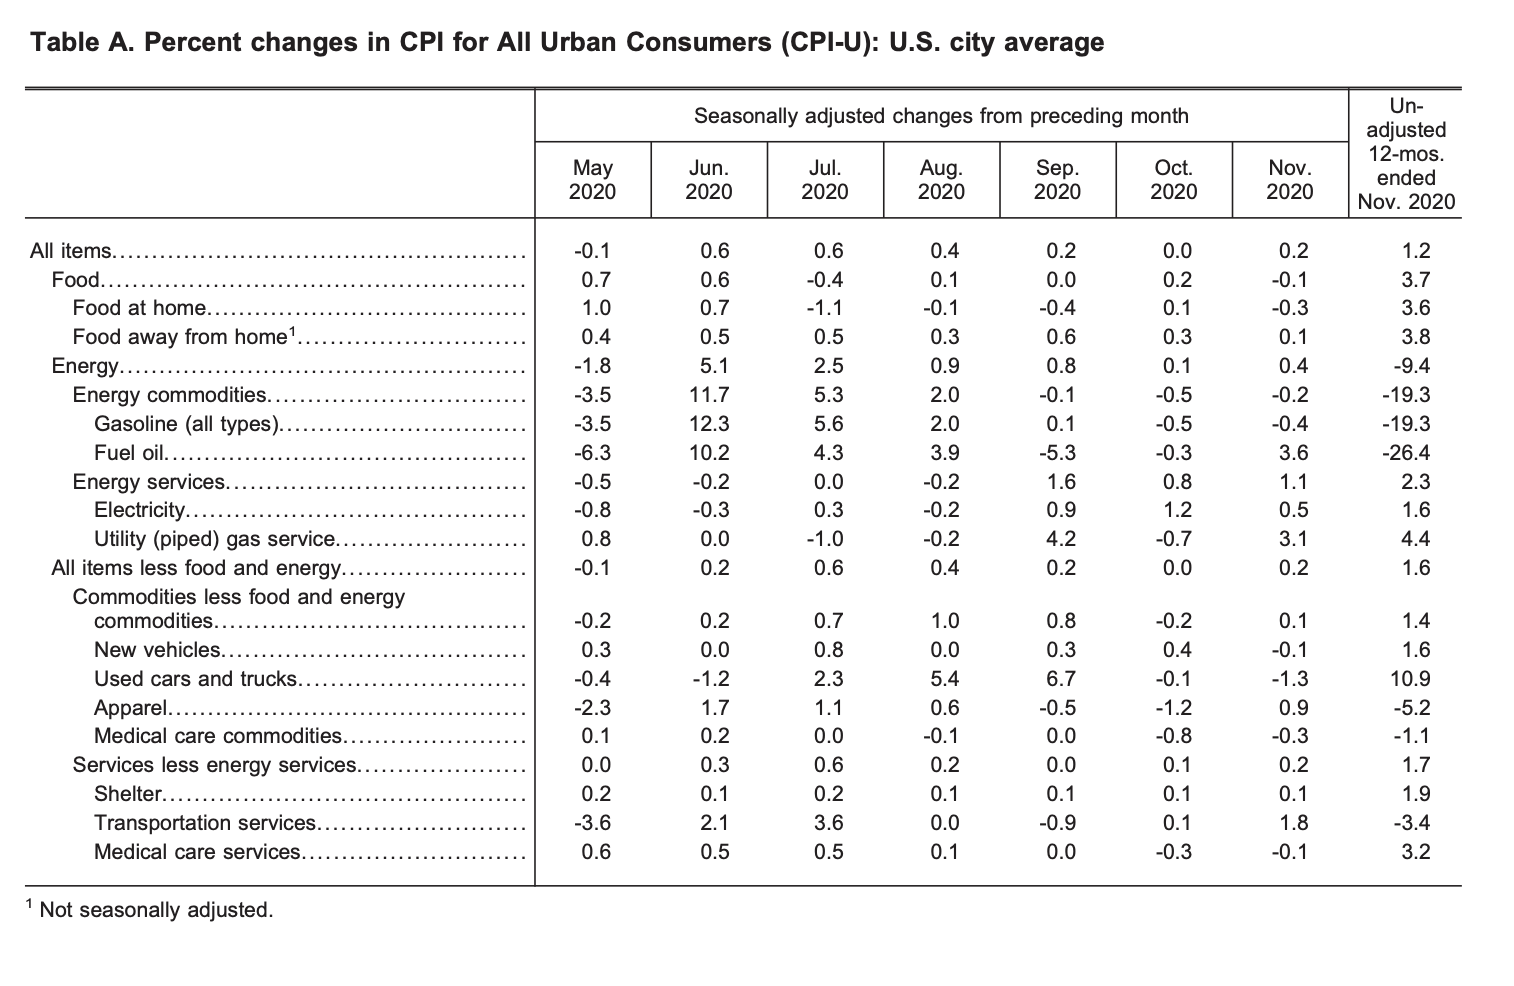
The Consumer Price Index for All Urban Consumers (CPI-U) edged up 0.2% in November, reported the U.S. Bureau of Labor Statistics. Before seasonal adjustment, the all items index increased 1.2% since this time last year.
(Source: U.S. Bureau of Labor Statistics)
Food Index
The index for food dropped 0.1% in November, after rising 0.2% the previous month. The food at home index decreased 0.3%.
“Major grocery store food group indexes were mixed in November. The index for nonalcoholic beverages fell 0.9 percent in November, its largest monthly decline since December 2010. The index for other food at home fell 0.6 percent in November, and the index for cereals and bakery products decreased 0.5 percent; both indexes increased in October,” reported the U.S. Bureau of Labor Statistics.
Over the past 12 month period, the food at home index rose 3.6%. All six major grocery store group indexes saw percentage increases since this time last year. The index for meats, poultry, fish, and eggs saw the largest percentage rise at 5.9%, with specifically the index for beef edging up 7.5% over the last 12 months. Likewise, the food away from home index increased by 3.8% over the same timeframe.
Energy Index
The index for energy increased 0.4% in November, marking the sixth consecutive monthly percentage rise. The indexes for natural gas, electricity, and fuel oil all rose, 3.1%, 0.5%, 3.6%, respectively.
“In contrast to these increases, the gasoline index declined for the second month in a row, falling 0.4%. Before seasonal adjustment, gasoline prices fell 2.7% in November,” stated the bureau in its report.
Over the last 12-month period, the energy index dropped 9.4%. The price of gasoline plunged 19.4%, and the index for fuel oil plummeted an astonishing 26.4% since this time last year. Conversely, the natural gas and electricity indexes rose 4.4% and 1.6%, respectively.
(Source: U.S. Bureau of Labor Statistics)
All Items Less Food and Energy
In November, the all items less food and energy index edged up 0.2%, reported the U.S. Bureau of Labor Statistics. Several component indexes saw percentage increases including the shelter index at 0.1%, the apparel index at 0.9%, airline fares at 3.5%, and motor vehicle insurance at 1.1%.
Over the last year, the all items less food and energy index increased by 1.6%. The index for shelter edged up 1.9% over the past 12-month span, as did the medical care index with a percentage increase of 2.4%.
“Despite the monthly increases in November, the indexes for apparel, airline fares, and motor vehicle insurance all declined over the past 12 months,” reported the U.S. Bureau of Labor Statistics.
The US Bureau of Labor Statistics released a statement on the impact of the COVID-19 pandemic for the November 2020 data collection:
“Data collection by personal visit for the Consumer Price Index (CPI) program has been suspended since March 16, 2020. When possible, data normally collected by personal visit were collected either online or by phone. Additionally, data collection in November was affected by the temporary closing or limited operations of certain types of establishments. These factors resulted in an increase in the number of prices considered temporarily unavailable and imputed. While the CPI program attempted to collect as much data as possible, many indexes are based on smaller amounts of collected prices than usual, and a small number of indexes that are normally published were not published this month. Additional information is available at www.bls.gov/covid19/effects-of-covid-19-pandemic-on-consumer-price-index.htm.”
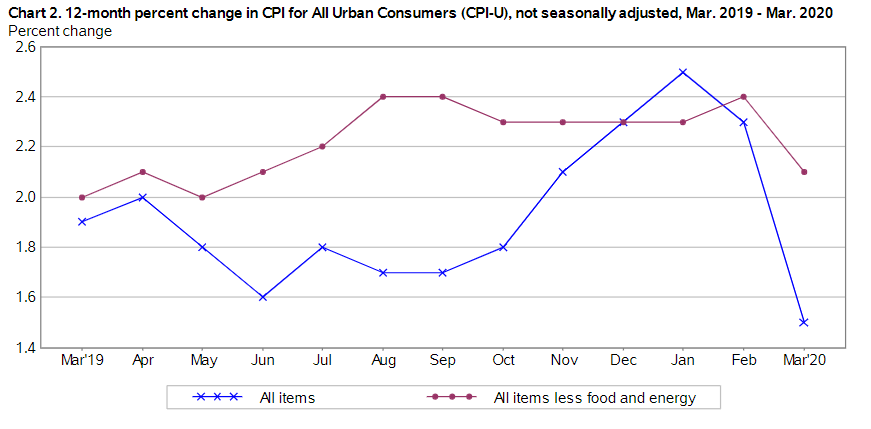
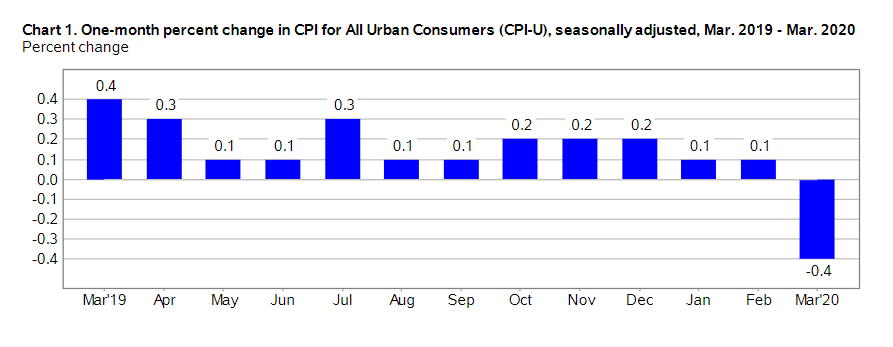
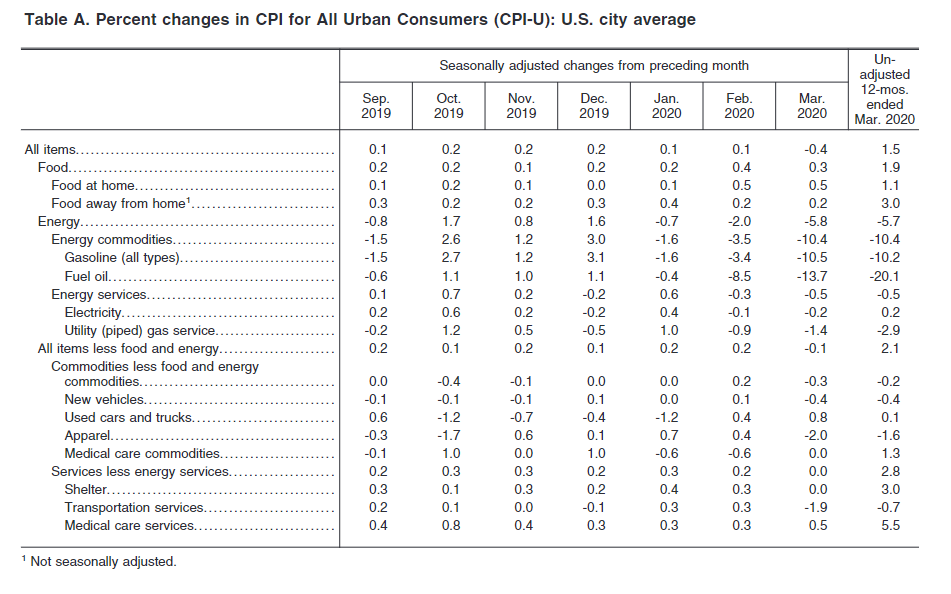
The Consumer Price Index for All Urban Consumers (CPI-U) dropped 0.4% in March according to a new summary report by the U.S. Bureau of Labor Statistics. The 0.4% drop in consumer prices is reported on a seasonally-adjusted basis, and represents the largest single-month decline since January 2015. From March 2019 to March 2020, the CPI-U increased 1.5% before adjustment and consumer prices rose 0.1% in both February and January.
(Source: U.S. Bureau of Labor Statistics)
The drop in U.S. consumer prices in March is led by two principal factors. First, the price of oil reaching 18-year lows due to reduced industrial and consumer demand in tandem with the ongoing Saudi-Russian oil price war. Second, a generally strained U.S. economy due to the Covid-19 pandemic.
(Source: U.S. Bureau of Labor Statistics)
Food Index
Despite a large overall drop in the CPI-U, the food index rose by 0.3% in March. This price movement represents a minor cool-down from February’s 0.4% increase in the food index. The Food at home index shot up 0.5%, which matches its growth in February.
In March, all six grocery store food group indexes increased during the month of March. Consumer prices for non-alcoholic beverages increased by 0.9% and the fruits and vegetables index rose 0.8% following a stagnant month in February.
The food away from home index rose a more modest 0.2% in March, which matches its February increase. The Labor Department reported that the index for food away from home rose 3.0% over the past year, and the food at home index rose by 1.1%.
All Items Less Food and Energy Index
In March, the index for all items less food and energy fell by 0.1%. The indexes for rent and owners’ equivalent rent edged up by a modest 0.3%, although these increases were offset by a 6.8% fall in the index for lodging away from home.
Although the airline fares index fell by only 0.3% in February, March saw a much more pronounced decline of 12.6%. After four consequent months of increases, the apparel index fell by 2.0% in March and the index for new consumer vehicles fell by 0.4% in March despite increasing through February.
The medical care index rose 0.4% in March amid the developing novel coronavirus pandemic. The physicians’ services index rose 0.3% while the hospital services index rose by 0.4% in March. The prescription drug index fell by 0.2%. In the past 12-month period, the index for all items less food and energy rose by 2.1%.
(Source: U.S. Bureau of Labor Statistics)
Energy Index
Notably, the U.S. energy index fell by 5.8% in March, marking its largest drop in over five years. The monthly decrease was led by a sharp drop in gasoline prices, as the gasoline index declined by 10.5% after seasonal adjustment.
Other energy index items also fell in March, including the fuel oil index (-13.7%), the natural gas index (-1.4%), and the electricity index (-0.2%). In the past year, the U.S. energy index dropped by 5.7%, which the Labor Department reports to be the largest 12-month decline since the year ending August 2016.
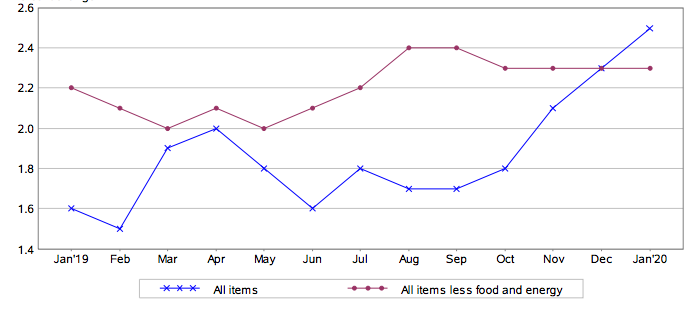
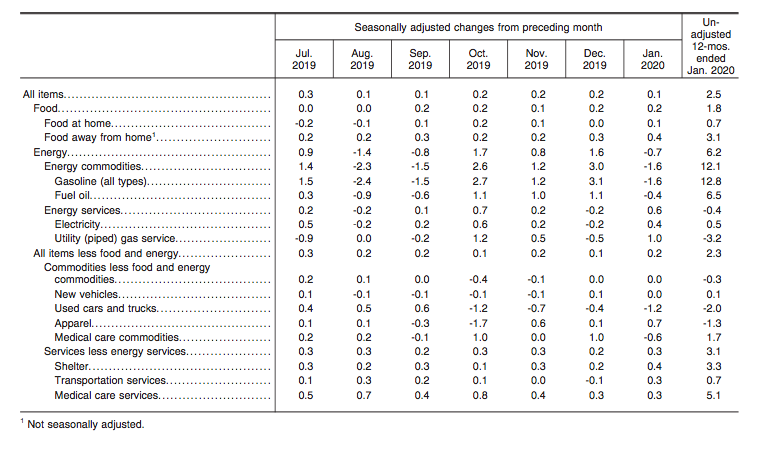
The US Bureau of Labor Statistics (BLS) reported today, that in January, the Consumer Price Index for All Urban Consumers (CPI-U) increased 0.1% on a seasonally adjusted basis. The all items index has risen 2.5% before seasonal adjustment, over the past year.
Based upon the data provided by the BLS, the shelter index was the largest component, which attributed to the rise in the seasonally adjusted all items index. In addition, the medical care and food indexes also increased. Conversely, the energy index dropped in January.
(Source: US Bureau of Labor Statistics)
Energy Index
In January, the index for energy decreased by 0.7%. This is in contrast to December when the energy index edged up 1.6%. The price of gasoline dropped 1.6% in January, compared to the 3.1% rise the previous month. The electricity index edged up 0.4%, as did the natural gas index, with an increase of 1.0%.
Overall, over the past 12-month period, the energy index rose 6.2%. The price of gasoline soared up 12.8% since January 2019. The index for electricity edged up 0.5%, while the natural gas index dropped 3.2%.
Food Index
Similarly to December, the index for food rose 0.2%. The food at home index also increased 0.1% in January. The food away from home index also edged up 0.4%.
Since January 2019, the food at home index rose 0.7%. Likewise, the food away from home index also increased 3.1% over the past 12 months.
(Source: US Bureau of Labor Statistics)
All Items Less Food And Energy Index
In January, the index for all items less food and energy rose 0.2% – December saw an increase of 0.1%. As mentioned, the shelter index increased 0.4%. The owners’ equivalent rent index saw a 0.3% increase, and the index for rent rose 0.4%.
The index for medical care also increased by 0.2%, as did the hospital services index, which rose 0.8%.
Over the last 12 months, the all items less food and energy index increased 2.3%. Since January 2019, the index for shelter edged up 3.3%. The medical care index also saw an increase over this same period, rising 4.5%. Over the past 12 months, there have been few indexes that decreased in this category.