by Sarah Bauder | Mar 11, 2020 | CPI
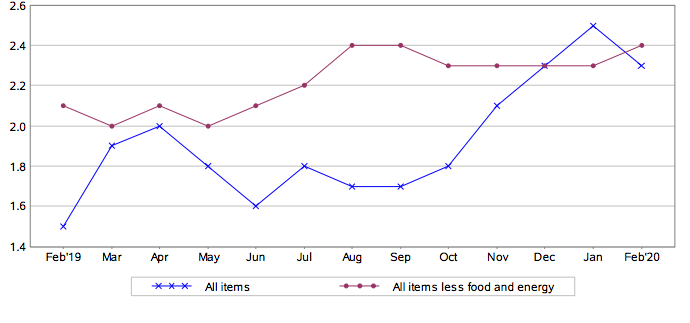
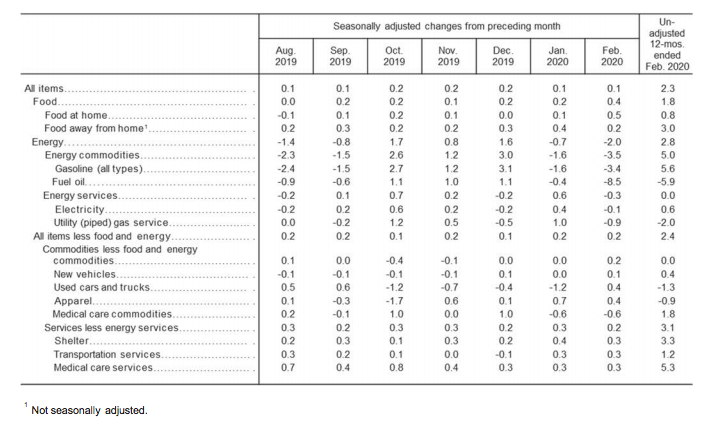
The Consumer Price Index for All Urban Consumers (CPI-U) increased 0.1% in February, the US Bureau of Labor Statistics reported. This is the same percentage rise seen in January, on a seasonally adjusted basis. Increases in food prices and shelter offset the lower price of gasoline. The all items index has risen 2.3 % before seasonal adjustment, over the past year.
(Source: US Bureau of Labor Statistics)
Food Index
Increasing food prices were a contributing factor to the rise in the seasonally adjusted all items index. In February, the index for food edged up 0.4%. The food at home index increased 0.5%, marking its largest jump since May 2014, the bureau reported. Throughout the month, five of the six main grocery indexes saw price increases. The food away from home index also increased by 0.2% in February.
Over the last year, the index for food at home has risen 0.8%, with the dairy and related products index seeing the largest gain with 3.6%. Over the past 12-month period, the food away from home index increased by 3.0%.
All Items Less Food and Energy Index
In February, the all items less food and energy index edged up 0.2%. Both the indexes for shelter and rent rose 0.3%, respectively, with the index for owners’ equivalent rent rising by 0.2%. The index for medical care also saw a 0.1% increase over the month.
Over the last year, the all items less food and energy index increased by 2.4%. The shelter index gained 3.3% and the medical care index leaped 4.6% over the past 12-month period.
(Source: US Bureau of Labor Statistics)
Energy Index
In February the energy index dropped 2.0%, the bureau reported. The price of gasoline decreased by 3.4% over the month. The index for fuel oil declined 8.5%, with the indexes for natural gas and electricity also declining, 0.9% and 0.1%, respectively.
Over the last 12-month period, overall the energy index increased by 2.8%. Gasoline prices rose 5.6%, as did the index for electricity with a 0.6% rise. Yet, over the past year, the fuel oil index decreased by 5.9% and likewise, the natural gas index dropped 2.0%.
Source cited: https://www.bls.gov/news.release/archives/cpi_03112020.htm
by Sarah Bauder | Feb 13, 2020 | CPI, Definitions
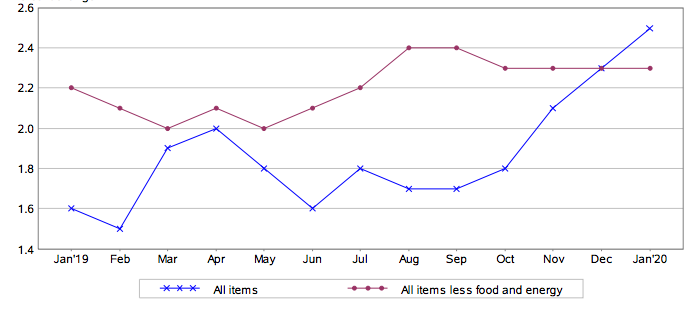
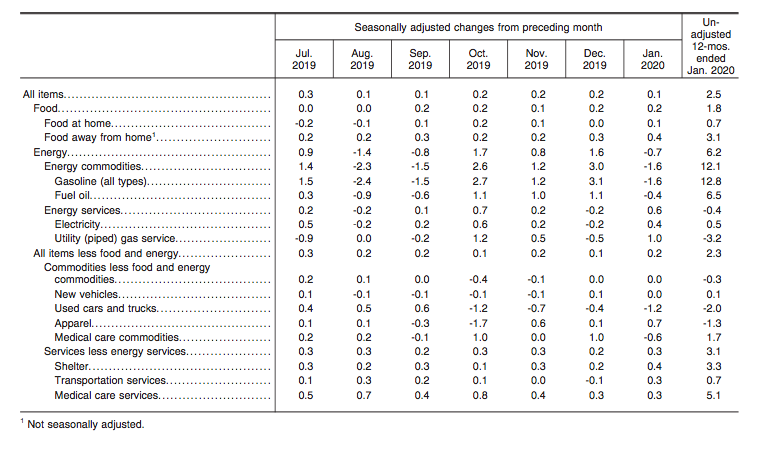
The US Bureau of Labor Statistics (BLS) reported today, that in January, the Consumer Price Index for All Urban Consumers (CPI-U) increased 0.1% on a seasonally adjusted basis. The all items index has risen 2.5% before seasonal adjustment, over the past year.
Based upon the data provided by the BLS, the shelter index was the largest component, which attributed to the rise in the seasonally adjusted all items index. In addition, the medical care and food indexes also increased. Conversely, the energy index dropped in January.
(Source: US Bureau of Labor Statistics)
Energy Index
In January, the index for energy decreased by 0.7%. This is in contrast to December when the energy index edged up 1.6%. The price of gasoline dropped 1.6% in January, compared to the 3.1% rise the previous month. The electricity index edged up 0.4%, as did the natural gas index, with an increase of 1.0%.
Overall, over the past 12-month period, the energy index rose 6.2%. The price of gasoline soared up 12.8% since January 2019. The index for electricity edged up 0.5%, while the natural gas index dropped 3.2%.
Food Index
Similarly to December, the index for food rose 0.2%. The food at home index also increased 0.1% in January. The food away from home index also edged up 0.4%.
Since January 2019, the food at home index rose 0.7%. Likewise, the food away from home index also increased 3.1% over the past 12 months.
(Source: US Bureau of Labor Statistics)
All Items Less Food And Energy Index
In January, the index for all items less food and energy rose 0.2% – December saw an increase of 0.1%. As mentioned, the shelter index increased 0.4%. The owners’ equivalent rent index saw a 0.3% increase, and the index for rent rose 0.4%.
The index for medical care also increased by 0.2%, as did the hospital services index, which rose 0.8%.
Over the last 12 months, the all items less food and energy index increased 2.3%. Since January 2019, the index for shelter edged up 3.3%. The medical care index also saw an increase over this same period, rising 4.5%. Over the past 12 months, there have been few indexes that decreased in this category.
Source cited: https://www.bls.gov/news.release/archives/cpi_02132020.htm
by Sarah Bauder | Jan 14, 2020 | CPI
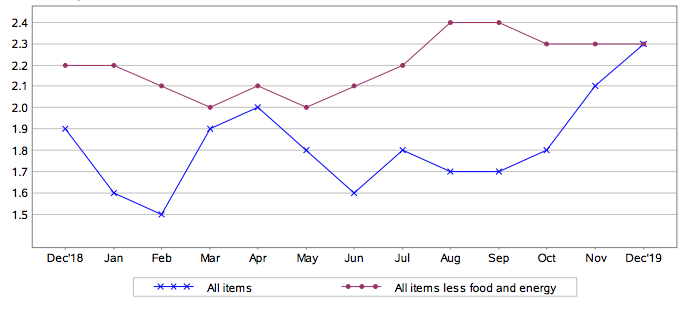
The US Bureau of Labor Statistics released its monthly data for December, indicating that the Consumer Price Index for All Urban Consumers (CPI-U) increased 0.2% in December, on a seasonally adjusted basis, after rising 0.3% in November.
The last 12 months have seen a 2.3% increase in all items indexes before seasonal adjustment. This was larger than the 1.9% rise in 2018, and the largest advance since 2011, which saw a 3% increase.
The price of gasoline, medical care, and shelter all increased in December, which accounted for the rise in the seasonally adjusted all items index.
(Source: US Bureau of Labor Statistics)
The Energy Index
The energy index rose 1.4% in December, marking its third consecutive monthly increase. Gas prices increased 2.8% in December (yet before seasonal adjustment, the price of gasoline fell 1.6%). The natural gas index also increased 0,3% in December, likewise marking it third consecutive monthly rise. Conversely, electricity decreased slipping 0.5% in December.
Over the past 12 months, the energy index saw a 3.4% increase. The price of gasoline rose 7.9% and the fuel oil index also increased 4.6% over the past year. Yet, electricity fell 0.4% and the natural gas index decreased 3.5%.
All Items Less Food And Energy
The index for all items less food and energy edged up 0.1% in December, after rising 0.2% in both the previous months. The shelter index increased 0.2% in December. Both in the indexes for rent and for owners’ equivalent rent rose 0.2%, respectively. The medical care index also increased 0.6% in December.
Overall, the index for all items less food and energy increased 2.3% over the past 12 months. The shelter index increased 3.2% over the past year, and the medical care index likewise increased 4.6%.

(Source: US Bureau of Labor Statistics)
The Food Index
In December, the food index rose 0.2%, after edging up 0.1% in November. The food at home index increased 0.1%, marking the same increase as in November. Additionally, the food away from home index increased to 0.3%.
Over the past 12 months, the food at home index rose 0.7%. Likewise, the food away from home index increased 3.1%.
Overall, the food index rose 1.8%, slightly higher than the 1.6% rise in 2018. Over the past decade, the food index increased at an average annual rate of 1.8%.
Source cited: https://www.bls.gov/news.release/archives/cpi_01142020.htm
by Sarah Bauder | Dec 11, 2019 | CPI
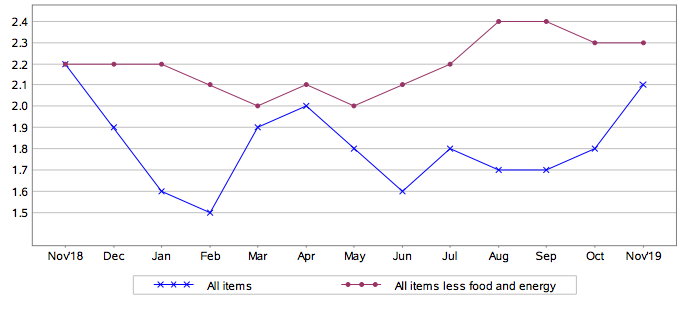
The US Bureau of Labor Statistics released its monthly data, stating that the Consumer Price Index for All Urban Consumers (CPI-U) rose 0.3 % in November on a seasonally adjusted basis, after rising 0.4% in October.
Despite historically low unemployment coupled with tariffs on Chinese imports, this signals that inflation remains in check.
American households paid more for energy, food, rent, and healthcare in November.
Source: US Department of Labor
The Energy Index
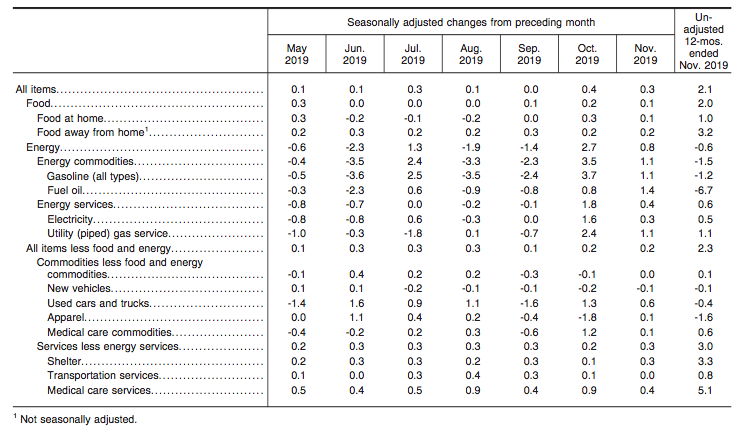
The price of gasoline increased by 1.1%, and the other major energy component indexes also increased 0.8% in November. Other major energy categories also saw an increase, with electricity edging up 0.3% and natural gas increasing 1.1%.
Over the past 12 months, the energy index has decreased 0.6%. Gasoline prices declined 1.2% over the past year, and the fuel oil index fell 6.7% over the past 12 months. Conversely, the natural gas index rose 1.1% and the electricity index increased 0.5% over the year.
The Food Index
Food prices edged up 0.1%, rising for a third straight month, with the categories for both food at home and food away from home both increasing over November.
Food at home increased 0.1%, after seeing a 0.3% increase in October. Likewise, the food away from home index increased 0.2%.
Over the last 12 months, the food at home index increased 1.0%. The food away from home category also increased 3.2% over the past 12 months.
Source: US Department of Labor
All Items Less Food And Energy
The shelter index rose 0.3% in November. The index for rent also rose 0.3%, while the index for owners’ equivalent rent increased 0.2% over the month. Over the past 12 months, the index for shelter has increased 3.3%. The medical care index increased 0.3 percent. Over the past year, the index for medical care rose 4.2%.
Overall, the index for all items less food and energy rose 2.3% over the past 12 months.
by Sarah Bauder | May 21, 2019 | CPI, inflation measure
The Consumer Price Index (CPI) is one of the most oft used techniques for measuring inflation the world over. Specific countries scrutinize different sets of data, but all employ a similar method. In the US, there has been contention surrounding the CPI for many years now. Initially, it was calculated by contrasting a market basket of goods from two periods – effectively operating as a cost of goods index (COGI). Yet, under the auspices of the US Congress, the CPI eventually developed into a cost of living index (COLI). In addition, as time passed methodological changes occurred which often resulted in a lower CPI. In this article, experts weigh in and provide compelling insight into whether the Consumer Price Index is a valid metric for inflation.
A Better Measure Would Be “Chained CPI”
“The Consumer Price Index (CPI) has long served as the foundational inflation measure for economic activity. In fact, it underpins the health of an economy because a stable CPI measure indicates the opportunity for economic prosperity. Absent predictable CPI readings, consumers will not have an accurate signal about price expectations and may change their behavior in detriment to the economy as a whole.
One major limitation to the current CPI measure is its inability to incorporate decisions consumers might actually make when evaluating a fixed basket of goods. For example, when a price increases for one consumer product included in the selection of goods used to measure CPI, many consumers would choose to switch to a substitute. CPI doesn’t account for this reality. Instead, CPI assumes the consumer would simply pay more for the same product. Reality usually shows a different response in the form of choosing a substitute product.
Instead, a better measure which accounts for this substitution effect would be “chained CPI.” This more closely resembles the substitution decisions consumers would make in response to rising prices of certain items as opposed to simply paying more for the same good. This metric will capture the switching dynamic.”
Riley Adams, CPA, Youngandinvested.com
Not An Exact Reflection, But Gives A Good Feel For It
“The CPI isn’t an exact reflection of the inflation rate, but it gives us a good feel for it. For the consumer, it shows them the increase in the price of the most common items that people buy, so if this is what they want to know when it is perfect.
However, for anyone interested in a deeper look at the current inflation rate there are other factors to take into account. For example, the CPI is based on a fixed basket of goods rather than taking into account every single product available. So, it really comes down to the reason for wanting to understand this subject.”
Phillip Konchar, Head Tutor, My Trading Skills

CPI Is Likely The Best Measure
“The CPI is one of a few common economic indicators that attempts to measure the magnitude of price changes (inflation) in the economy. The CPI, as the name indicates focuses on the price changes experienced by consumers. There are better indicators if one is looking at price changes for producers
(Purchaser Price Index – PPI), imports and exports (Import/Export Price Indexes – MXP), or employment costs (Employment Cost Index – ECI).
One drawback of the CPI is the time lag associated with the basket of goods included within the CPI. The basket of goods is determined by surveys the Bureau of Labor Statistics conducts to understand what products consumers are purchasing. There is generally a lag of about three years from the survey to when the basket of goods used in the Index is updated. This can be meaningful as the items consumers are purchasing can change quickly, particularly with rapid change in technology or substituting one good for another.
One other consideration is that the CPI can be volatile as it includes volatile products such as the price of energy (gasoline and natural gas prices can be quite volatile) and food. The Federal Reserve prefers to use a core inflation metric that excludes these volatile goods. The core inflation index the Federal Reserve prefers is the Personal Consumption Expenditures Price Index published by the Bureau of Economic Analysis.
Overall, the CPI is likely the best measure of the change in prices that consumers actually experience within an economy.”
John Linton, Managing Member and Portfolio Manager, Elbert Capital Management
Conclusion
There are both benefits and issues surrounding the use of the CPI as an accurate measure for inflation. For instance, the basket of goods used for the CPI is based upon purchases from a “typical household”, which is not a representative sample of all households. Thus, it is not an exact science, as it were. Likewise, the CPI can overstate inflation if it factors goods and services that consumers are using less of due to price increases. Substitution influences the weighting on the market basket, consequently resulting in a lower CPI. In addition, the basket of goods does not always factor the expenditure of new products that people regularly use. Consumption trends take time to be accounted for.
In essence, we are faced with a decision: accept the official CPI numbers provided by the Bureau of Labor Statistics (BLS), or choose alternate measures of inflation, thereby embracing the argument that official figures are inaccurate. Ultimately, whether or not the Consumer Price Index is a valid metric for inflation remains to be seen.
by Andrew | Jul 17, 2015 | BLS, CPI, Definitions, In the news, Inflation, Monthly CPI Updates
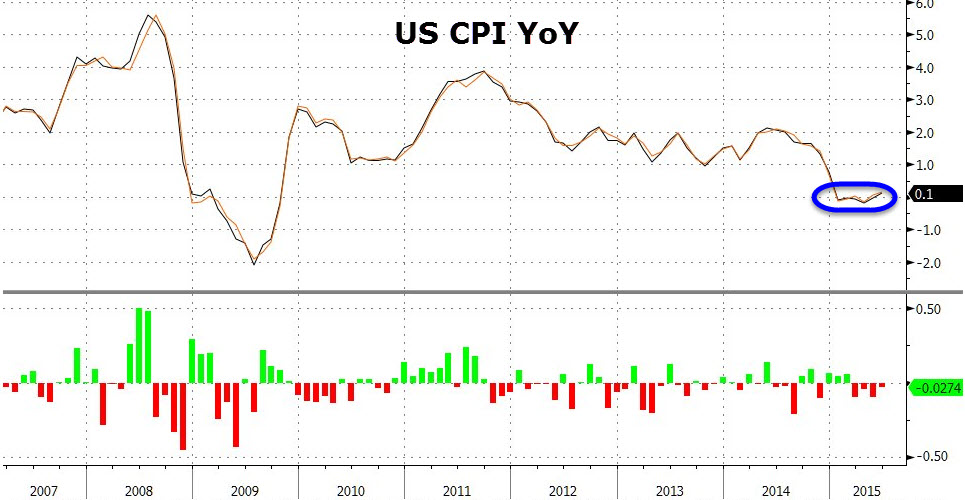
U.S. consumer prices increased for the fifth consecutive month in June, led higher by a rebounding price of gasoline, although there was nothing in the latest release which should pose any immediate alarm for markets or consumers at large. The latest report from the BLS reported an overall increase in headline inflation of 0.3% month on month – an increase that was inline with nearly all economists polled prior to the announcement. Looking at the headline number on an annualized basis, inflation rose 0.1 percent In the 12 months through June, following an unchanged reading for the month of May.
Gasoline prices rose 3.4% month on month, following a 10.4 percent surge in May. Given the recent volatility in crude oil prices and inventory data in July, there could be scope for the influence of rising gas prices to subside in coming months. Oil is currently trading within the $50-60 / bbl range, well below the levels seen in May and June.
Core CPI, which excludes food and energy related costs, increased 0.2 percent month on month following a rise of 0.1% previously. On an annualized basis, core CPI has now risen 1.8 percent.The June reading continues to highlight just how tame the inflationary environment is within the US economy at present. The strong dollar is helping to keep a lid on inflation by reducing the price of imports and wholesale costs. The strong US dollar has been been spurred partly by a flight to safety due to concerns in Europe and China, and partly by the market’s anticipation of a Fed rate hike later this year. We should expect to start hearing comments regarding the damaging effects of the stronger dollar by Fed officials in the weeks and months ahead should this trend continue.
The food index posts largest increase since September 2014
The price of food increased 0.3% in June, largely to an ongoing shortage in wholesale eggs which has caused a sharp jump in retail egg prices across the nation. Egg prices jumped 18.3% in June, the largest monthly gain since August 1973. Elsewhere, the index for meats, poultry, fish, and eggs rose 1.4 percent in June, with the beef index rising 0.9 percent. Food prices are likely to remain elevated in the coming months as the aftermath of the bird flu epidemic works its way through the supply chain. Wholesale food costs have been consistently increasing in PPI surveys, and these costs are likely to make their way down to the consumer in the weeks and months ahead.
Medical Price Inflation starting to cool off
Medical related inflation cooled in June which will be a welcome deviation from the overall trend in 2015. The price for Medical Care Services fell -0.2% in June and the prices for Medical Care Commodities remained unchanged month on month. Health care costs have been one of the largest contributors to inflation over the past 12 months, with both indices rising 2.3 percent and 3.3 percent respectively.
Rent Prices continue to Climb Higher
The shelter index climbed 0.3% in June, and 3% on an annualized basis as the supply of housing continues to shrink in key regions. Rent increases are also amongst the largest contributors to overall inflation in the United States within the past 12 months.
Outlook for Rates
This month’s CPI data contains no surprises, and the relatively tame reading in the core number on the back of the strong US dollar will likely stick in the minds of Fed officials in the weeks ahead. Globally, sentiment continues to wane dramatically given the continued turmoil in Greece, and increasingly China. While Greece appears to be on the verge of some sort of political settlement, the headline risk remains. In China’s case, there is a very real danger of investor sentiment turning, which could spell disaster for emerging markets overall. Latin American and South East Asian markets look at particular risk, especially on the currency front. The fate of these regions would be sealed in no uncertain terms should the Fed raise rates, and it is for this reason that it appears increasingly unlikely that the Fed will raise by year end, despite all of their rhetoric and expressed intention to do so.

