Emily Cross Leon
Emily is a Canadian financial blogger with multiple degrees in economics and extensive professional experience as a financial analyst. She was formerly a Ph.D. candidate at the University of Guelph's School of Agricultural Economics. Before that, she received an MA from the University of San Francisco in International Development Economics. She also has a BA in Math with a minor in Economics.
by Emily Cross Leon | Jan 20, 2016 | Definitions
The Bureau of Labor Statistics released December’s inflation report this morning, rounding out the year with an unexpected monthly decline in price levels. Most analysts had forecast the headline consumer price index (CPI-U) would remain flat in December, instead it fell a seasonally adjusted 0.1%.
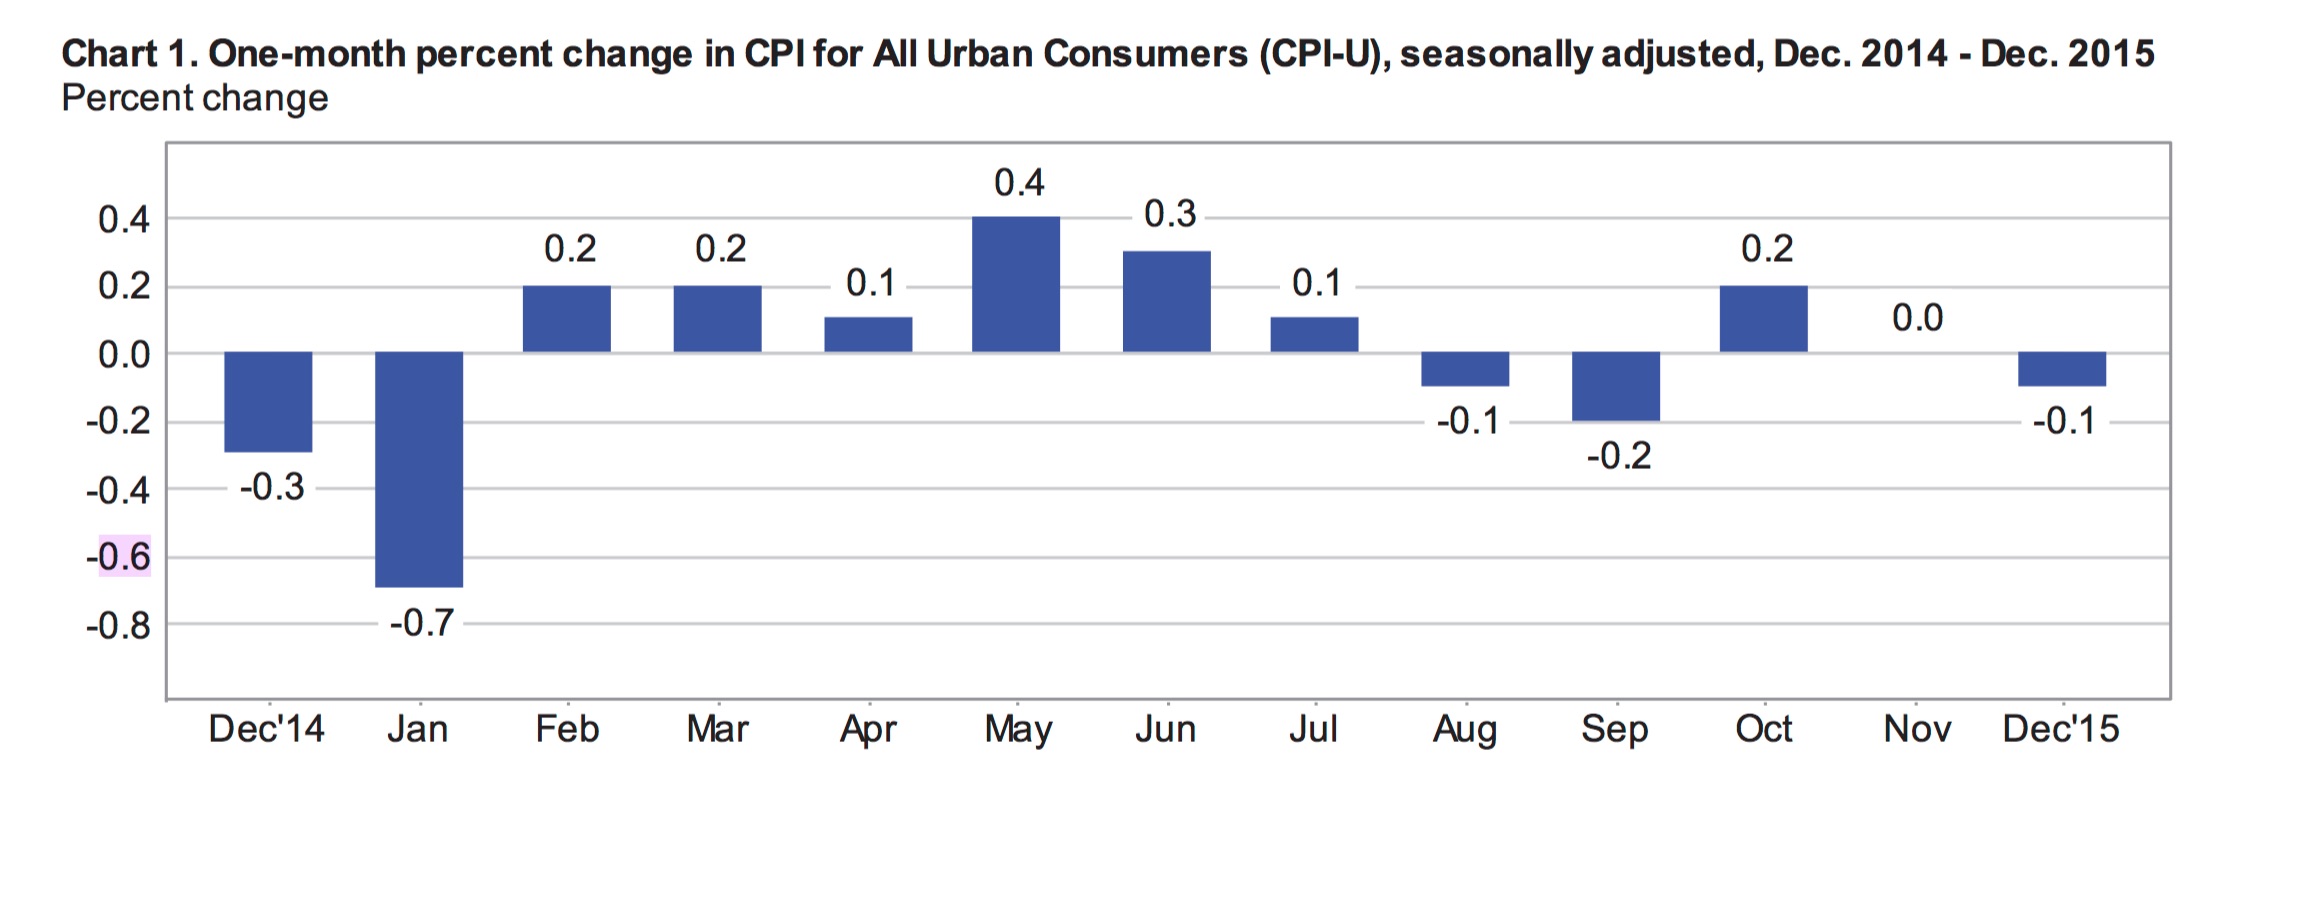 Once again, falling energy prices weighed heavily on overall price levels; the seasonally adjusted energy index fell 2.4% in December. Food prices were also down 0.2% for the month. Core inflation, which excludes volatile food and energy prices, climbed a modest 0.1% in December, following three consecutive months of 0.2% growth. Most analysts had expected another increase of 0.2% in the core reading. Core inflation is considered a good indication of underlying price trends and appears to continue to creep higher. Prices for housing, a significant component of consumer spending (approximately 43%), were up 0.1% in December. Housing was the largest positive driver of inflation for the month.
Rounding out the Year
The CPI-U climbed 0.7% in 2015, following an increase of 0.8% in 2014 and 0.5% for the 12 months ending in November. This is the highest annual number recorded for the year. Prior to 2014, the US economy only recorded inflation below 1% once in over 50 years; headline inflation in 2008 was 0.1%. The federal reserve targets an annual inflation rate of 2% so they are currently well below their target. According to the BLS, the CPI-U has increased at an average annual rate of 1.9% over the last 10 years.
Core prices climbed a healthy 2.1% in 2015 following an increase of 1.6% in 2014. Food prices were up slightly for the year but declining energy costs most impacted overall price levels. This created a large discrepancy between core and overall inflation numbers. The energy index, which accounts for just over 7% of the total CPI-U, fell 12.6% in 2015 and 10.6% in 2014.
The cost of shelter, which is about a third of the overall price index, accelerated throughout the year climbing 3.2% and significantly contributing to higher overall prices. The shelter index includes rental costs. The cost of rent for primary residence increased 3.7% in 2015 and the index measuring owners equivalent of rent climbed 3.1%. In 2015, every component of the shelter index was higher, including a spike in moving, storage and freight costs of 12.9%.
The index for food was up 0.8% for the year ending in December. Within the food industry, prices were volatile and mixed. The price for cakes, cupcakes and cookies rose 2.3% and the price of eggs was 14.8% higher. At the same time, the price of ham fell 10.5% and milk costs were down 7.9% for the year.
Seasonally Adjusted Prices in December
For the month, energy was, again, the main driver of changes in price levels. On a seasonally adjusted basis, the cost of fuel oil fell 7.8% in December while gas prices were down 3.9%. The index for transportation slid a seasonally adjusted 0.8% for the month while the cost for new and used vehicles remained flat.
The index for food fell 0.2% in December following a decline of 0.1% in November. Food at home was 0.5% cheaper for the month, the largest monthly decline since March 2015. The cost of food away from home increased 0.1% in December following an increase of 0.2% in November. The index for meat, poultry, fish and eggs posted its largest monthly decline since 1979, falling 1.4% in December; this includes a 3.4% decline in the price of eggs.
The price of shelter continues to rise, up a seasonally adjusted 0.2% in December matching November’s increase. Medical care costs inched up 0.1% for the month, following more significant gains in October and November, 0.8% and 0.4% respectively. The index for household furnishings and operations rose 0.2% in December. Higher prices were also recorded for motor vehicle insurance, education, used cars and trucks and tobacco. Prices declined in December for apparel, down 0.2% following 3 months of consecutive drops in the apparel index. Airline fares were down 1.1% in December after increasing significantly in October and November.
Economic Outlook
The Fed will be disappointed by today’s CPI report as policymakers are hoping for strong inflation numbers before announcing another rate hike. Following December’s hike, a second move is unlikely at least until the second half of this year.
While the US economy appears to be gaining strength in some areas, the inflation picture remains weak and wage growth is slow despite growing employment. Concerns have been raised about the impact of higher rates with inflation remaining weak. Yesterday, the IMF downgraded its forecast for global growth noting that higher US interest rates could further derail economic growth around the world. Higher rates will also slow the potential for economic growth domestically. Today’s inflation report further weakens the likelihood of any rate hikes in the next year.
“Traders are worried that shifting to higher rates at a time when inflation is stubbornly low can elevate the risk of deflation, or falling consumer prices, which can derail business activity.”
The strong US dollar will also lessen the likelihood of stronger inflation as import prices are very low. Cheap oil is also weighing on the economy both domestically and in the US. Oil prices have dropped significantly and at around $27/barrel are at their lowest level since 2003.
by Emily Cross Leon | Dec 15, 2015 | In the news, Inflation
This morning, the Bureau of Labor Statistics released consumer inflation numbers for November. The Consumer Price Index for all Urban Consumers (CPI-U) was unchanged for the month following seasonal adjustments. This is what most analysts had expected. As the chart below illustrates, net inflation since July remains flat. November saw declines in energy and food costs offset by higher prices for shelter and medical care services. For the 12-months ending in November, the headline index rose an unadjusted 0.5%, the highest annual inflation number since 2014.
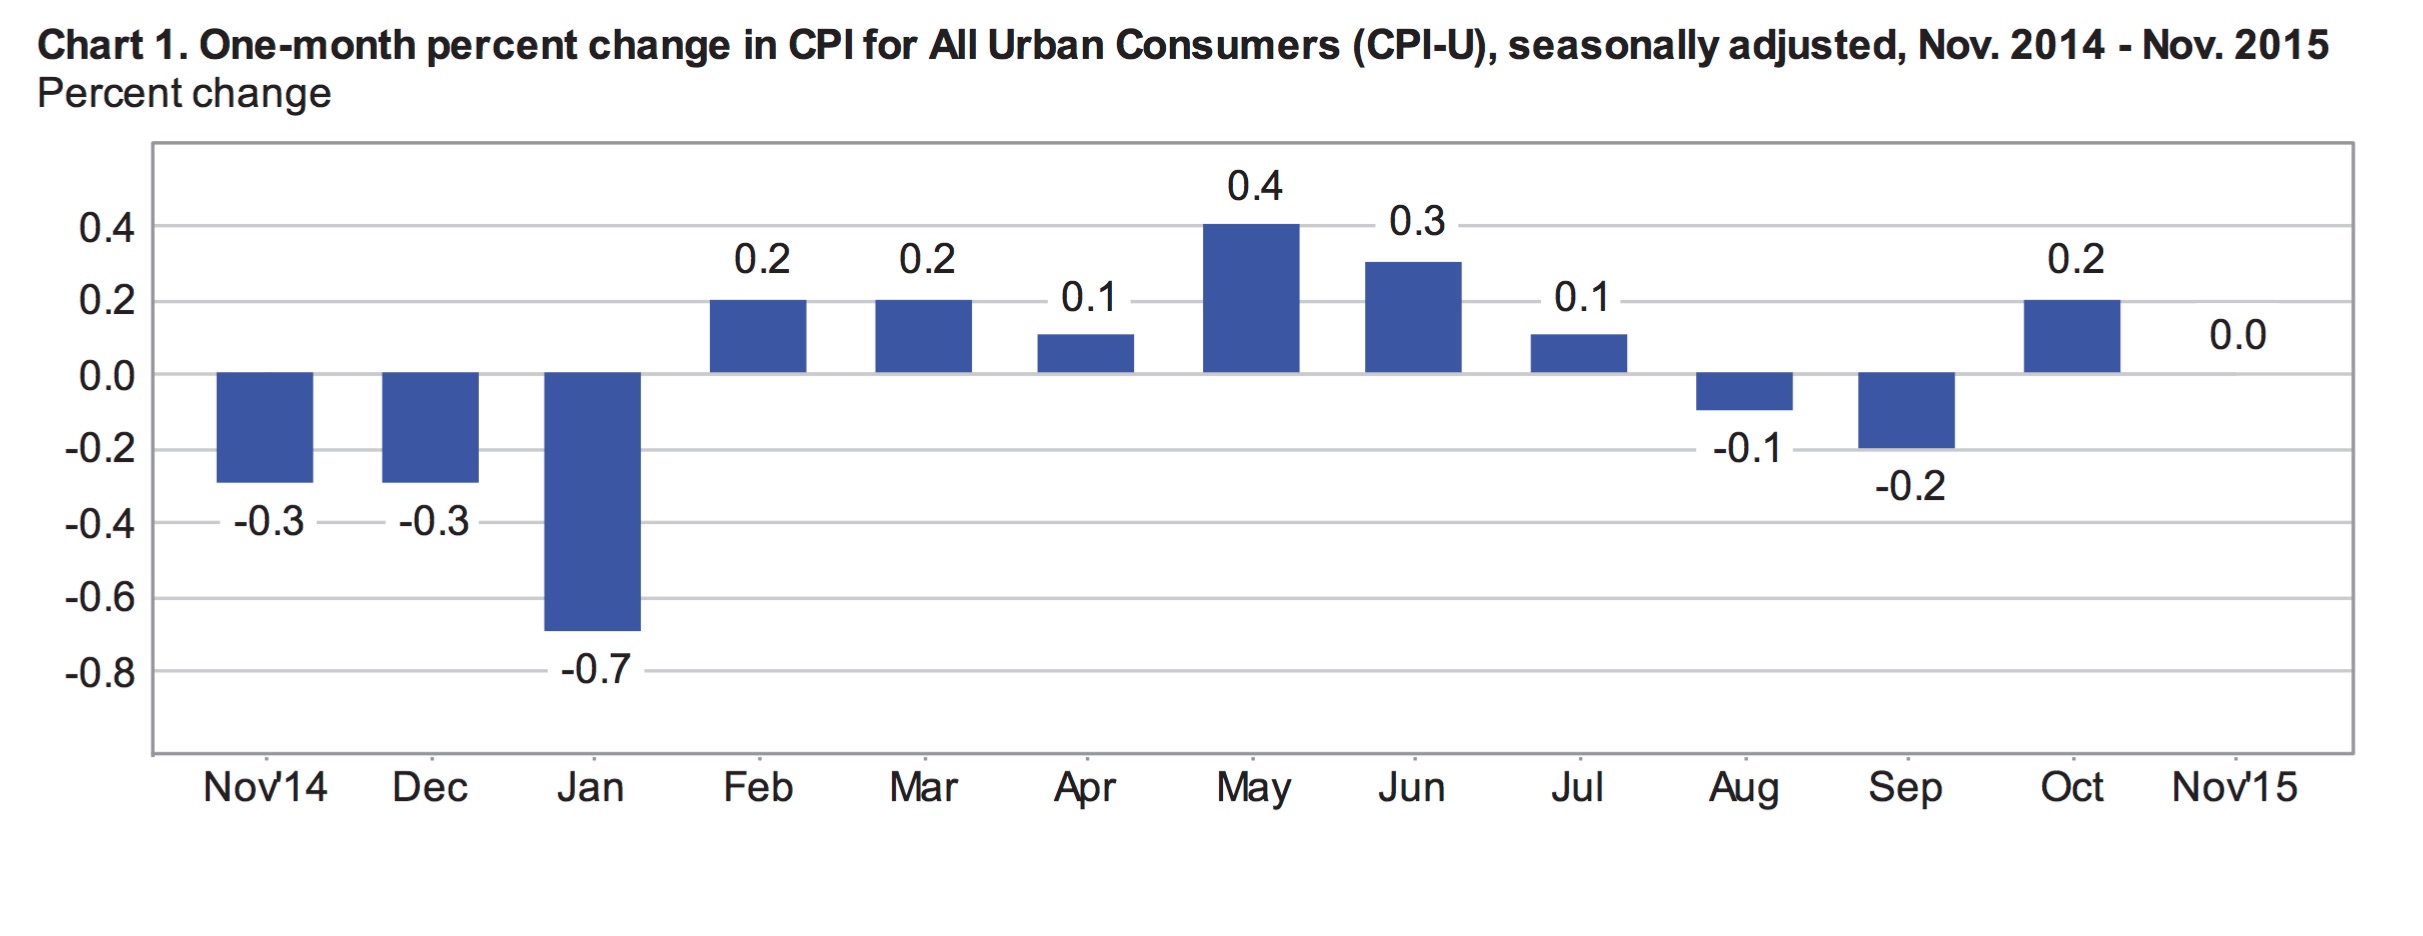
Excluding food and energy, seasonally adjusted core prices rose 0.2% in November, which was also what most analysts had forecast. Adjusted core prices have increased by 0.2% for three months in a row and have stayed between 0.1% and 0.3% throughout 2015. For the year ending in November, core inflation was 2%.

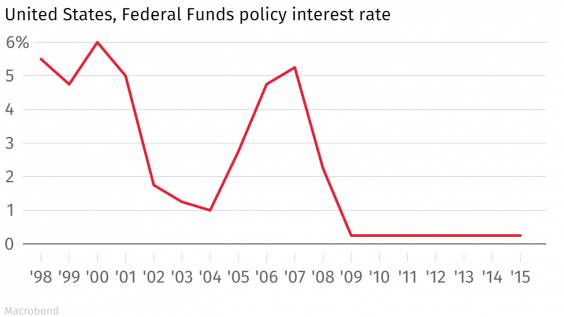
These numbers point to underlying inflationary pressure and support the Federal Reserve’s highly anticipated rate hike, which will likely be announced tomorrow following their meeting. The Fed has kept interest rates at 0.25% since 2009.
November’s Inflation
Overall, seasonally adjusted prices were flat in November as declines in the indexes for food and energy were offset by higher prices for shelter, transportation services and medical services. The index for all items less food and energy climbed a seasonally adjusted 0.2% in November, in line with expectations. The more volatile food and energy indexes were down 0.1% and 1.3% respectively, after seasonal adjustments.
Seasonally Adjusted Monthly % Change in CPI-U by Category (2016)
| January | February | March | April | May | June | July |
| All Items | 0 | -0.2 | 0.1 | 0.4 | 0.2 | 0.2 | 0.0 |
| Food | 0 | 0.2 | -0.2 | 0.2 | -0.2 | -0.1 | 0.0 |
| Energy | -2.8 | -6.0 | 0.9 | 3.4 | 1.2 | 1.3 | -1.6 |
| Gasoline | -4.8 | -12.5 | 2.2 | 8.1 | 2.3 | 3.3 | -4.7 |
| Fuel Oil (non seasonally adjusted) | -6.5 | -2.9 | 1.7 | 1.9 | 6.2 | 3.7 | -1.5 |
| Electricity | -0.7 | -0.2 | 0.4 | -0.3 | -0.2 | -0.5 | 0.5 |
| Utilities (piped gas service) | -0.6 | 1.0 | -0.7 | 0.6 | 1.7 | -0.4 | 3.1 |
| Energy Services | -0.7 | 0.1 | 0.2 | -0.1 | 0.2 | -0.5 | 1.0 |
| All Items Less Food and Energy | 0.3 | 0.3 | 0.1 | 0.2 | 0.2 | 0.2 | 0.1 |
| Services Less Energy Services | 0.3 | 0.3 | 0.2 | 0.3 | 0.4 | 0.3 | 0.2 |
| Shelter | 0.3 | 0.3 | 0.2 | 0.3 | 0.4 | 0.3 | 0.2 |
| Transportation Services | 0.4 | 0.2 | 0.2 | 0.7 | 0.3 | 0.3 | -0.2 |
| Medical Care Services | 0.5 | 0.5 | 0.1 | 0.3 | 0.5 | 0.2 | 0.5 |
The monthly decline in the food index is its first drop in 8 months. The index for food at home fell 0.3% in November. Aside from fruits and vegetables, which were 0.6% higher for the month, every other component of the index for food at home fell. Prices for meat, fish, poultry and dairy products continue to decline. However, the adjusted index for food away from home climbed 0.2% in November.
The decline in the energy index resulted from lower gas prices, down a seasonally adjusted 2.4% in November. Gas prices have been very volatile in 2015, falling over 18% in January and climbing over 10% in May. Shelter costs continue to rise steadily, up 0.2% in November following increases of 0.3% in September and October. Prices are also rising steadily in the service sectors, up 0.3% for the third month in a row. Transportation and medical care services were up 0.6% and 0.4% respectively.
Annual Inflation
For the 12-months ending in November, unadjusted prices were up 0.5% overall. The increase in overall price levels was largely driven by higher shelter costs, which account for 33.2% of the overall index. Unadjusted shelter costs were 3.2% higher over the 12-month period. The index for rental costs (primary residence) climbed 3.6% during the year, while moving expenses were 7.1% higher.
Food prices, which account for about 14% of the overall index, were up 1.3% for the year ending in November. The index for food at home, which is about 60% of the overall food index was only up 0.3% year over year. This marks its smallest annual increase in over 5 years. The prices for meat, fish, poultry and eggs are all down year over year while the prices for bread, fruits and vegetables are higher. The index for food away from home climbed 2.7%. A significant hike (4.9%) in the index for food at employee sites and schools was the primary reason for higher costs for food away from home.
The energy index makes up approximately 7.4% of the CPI-U and about half of the energy index is energy commodities and the other half energy services. For the year ending in November, the overall energy index fell 14.7% including a 24.2% decline in energy commodities and a 2.8% decline in energy services. Among the energy commodities, the index for fuel oil had the largest decline, down 31.4% for the year. Over the same 12-months, the index for gasoline (all types) fell 24.1%.
Outlook
It is highly expected that the Federal Reserve will raise interest rates by a quarter of a percentage point on Wednesday. According to the Wall Street Journal, 97% of economists surveyed expect the fed to raise rates this week. This would be the first rate hike in nearly a decade as the economy and employment appear to finally be returning to solid ground.
What remains largely an unknown at this point is the pace of future rate hikes. This will largely be a function of inflation expectations. With overall inflation continuing to lag well below the Fed’s target, the pace of future rate hikes may likely be slow. According to David Jones, chief economist at DMJ Advisors:
“The stronger dollar and falling oil prices [may] have masked some underlying inflation[ary] pressures which could surface quickly as we move closer to full employment.”
by Emily Cross Leon | Nov 17, 2015 | In the news, Inflation, Monthly CPI Updates
The BLS released October’s inflation data this morning and there were no major surprises. The Consumer Price Index for All Urban Consumers (CPI-U) climbed a seasonally adjusted 0.2% in October following a decline of 0.2% in September. This is in line with consensus expectations. Year over year, the CPI-U was up 0.2% at the end of October, which is well below the Fed’s annual inflation target rate of 2%. According to a recent Federal Reserve press release:
“Inflation has continued to run below the Committee’s longer-run objective, partly reflecting declines in energy prices and in prices of non-energy imports.”
Core inflation, which excludes food and energy, increased 0.2% in October, following a 0.2% increase in September. For the year ending in October, core inflation was 1.9%. Outside of the volatile energy index, which was down over 17% for the 12-months ending in October, consumer prices appear to be climbing at a steady pace only marginally below the Fed’s target.

October’s Seasonally Adjusted Inflation
October’s 0.2% climb in consumer prices was largely driven by modest increases in the energy index, which rose 0.3% following a decline of 4.7% in September. Gas prices were up 0.4% in October compared to a 9% decline in September (this still leaves gas prices down 27.8% year over year).
A 0.8% spike in the index for medical care services also helped drive October’s inflation. This includes a significant jump in the hospital services index, up 2% in October. Overall, medical care costs posted a 0.7% gain in October including a 2.3% jump in the costs of inpatient services and a 1.7% rise in the costs of outpatient services.
Four of the six major grocery store food groups saw prices rise in October. The overall food index rose a modest 0.1%, following a 0.4% rise in September. The price of fruits and vegetables climbed 0.5% in October, while the index for meat, poultry, fish and eggs fell by the same amount, despite a 3.4% increase in the cost of bacon and bacon related products. A fall of 4.8% in the price of eggs was particularly notable for the month. Breakfast cereal and butter posted strong price gains, rising 2.4% and 5.3% in October.
Shelter costs continued to climb steadily, up 0.3% in October, matching Septembers change. Shelter costs have risen between 0.2% and 0.4% every month this year. The index for lodging away from home, up 0.8% in October, contributed significantly to higher shelter costs, .
The apparel index was down 0.8% in October. There was a large amount of variation within the index. The index for boys apparel climbed 2.9% while the index for girls apparel fell by 2.9%. Delivery services also fell in October, down 2%.
Seasonally Adjusted Monthly % Change in CPI-U by Category (2016)
| January | February | March | April | May | June | July |
| All Items | 0 | -0.2 | 0.1 | 0.4 | 0.2 | 0.2 | 0.0 |
| Food | 0 | 0.2 | -0.2 | 0.2 | -0.2 | -0.1 | 0.0 |
| Energy | -2.8 | -6.0 | 0.9 | 3.4 | 1.2 | 1.3 | -1.6 |
| Gasoline | -4.8 | -12.5 | 2.2 | 8.1 | 2.3 | 3.3 | -4.7 |
| Fuel Oil (non seasonally adjusted) | -6.5 | -2.9 | 1.7 | 1.9 | 6.2 | 3.7 | -1.5 |
| Electricity | -0.7 | -0.2 | 0.4 | -0.3 | -0.2 | -0.5 | 0.5 |
| Utilities (piped gas service) | -0.6 | 1.0 | -0.7 | 0.6 | 1.7 | -0.4 | 3.1 |
| Energy Services | -0.7 | 0.1 | 0.2 | -0.1 | 0.2 | -0.5 | 1.0 |
| All Items Less Food and Energy | 0.3 | 0.3 | 0.1 | 0.2 | 0.2 | 0.2 | 0.1 |
| Services Less Energy Services | 0.3 | 0.3 | 0.2 | 0.3 | 0.4 | 0.3 | 0.2 |
| Shelter | 0.3 | 0.3 | 0.2 | 0.3 | 0.4 | 0.3 | 0.2 |
| Transportation Services | 0.4 | 0.2 | 0.2 | 0.7 | 0.3 | 0.3 | -0.2 |
| Medical Care Services | 0.5 | 0.5 | 0.1 | 0.3 | 0.5 | 0.2 | 0.5 |
12-Month Inflation
For the 12-months ending in October, unadjusted inflation was 0.2%. This includes a 27.8% decline in the index for energy commodities, which accounts for roughly 3.8% of the total CPI-U. The overall energy index fell 17.1% for the year. Despite the strong negative impact of energy prices, the CPI-U is marginally higher for the year.
Food prices, which account for over 14% of the overall price index, were up 1.6% year over year. Annual changes in food prices were mixed. Eggs were 30% more expensive than they were one year earlier. Over the same period, milk became 7.5% cheaper and the index for salt and seasoning rose 7.0%. Food at employee sites and schools was 5% higher for the year.
The prices of many consumer goods became cheaper over the year. The indexes for apparel and for appliances posted 1.9% and 4% declines respectively. The price of a television set has fallen 13.3% year over year, while the index for toys was down 6%. On the other hand, the cost of shelter rose 3.2% for the year with moving costs up 6.4%.
Outlook for the Fed
Most economists expect the Fed to raise interest rates in December, which would be the first rate hike in over 9 years. Today’s inflation release should not have a significant impact on these expectations. Fed fund futures are pricing in a 73.6% likelihood of a 0.25% rate hike on December 16th, which would bring the Fed Funds rate to 0.5%. The level of uncertainty around this highly anticipated hike and the pace of tightening over the coming years is unprecedented.
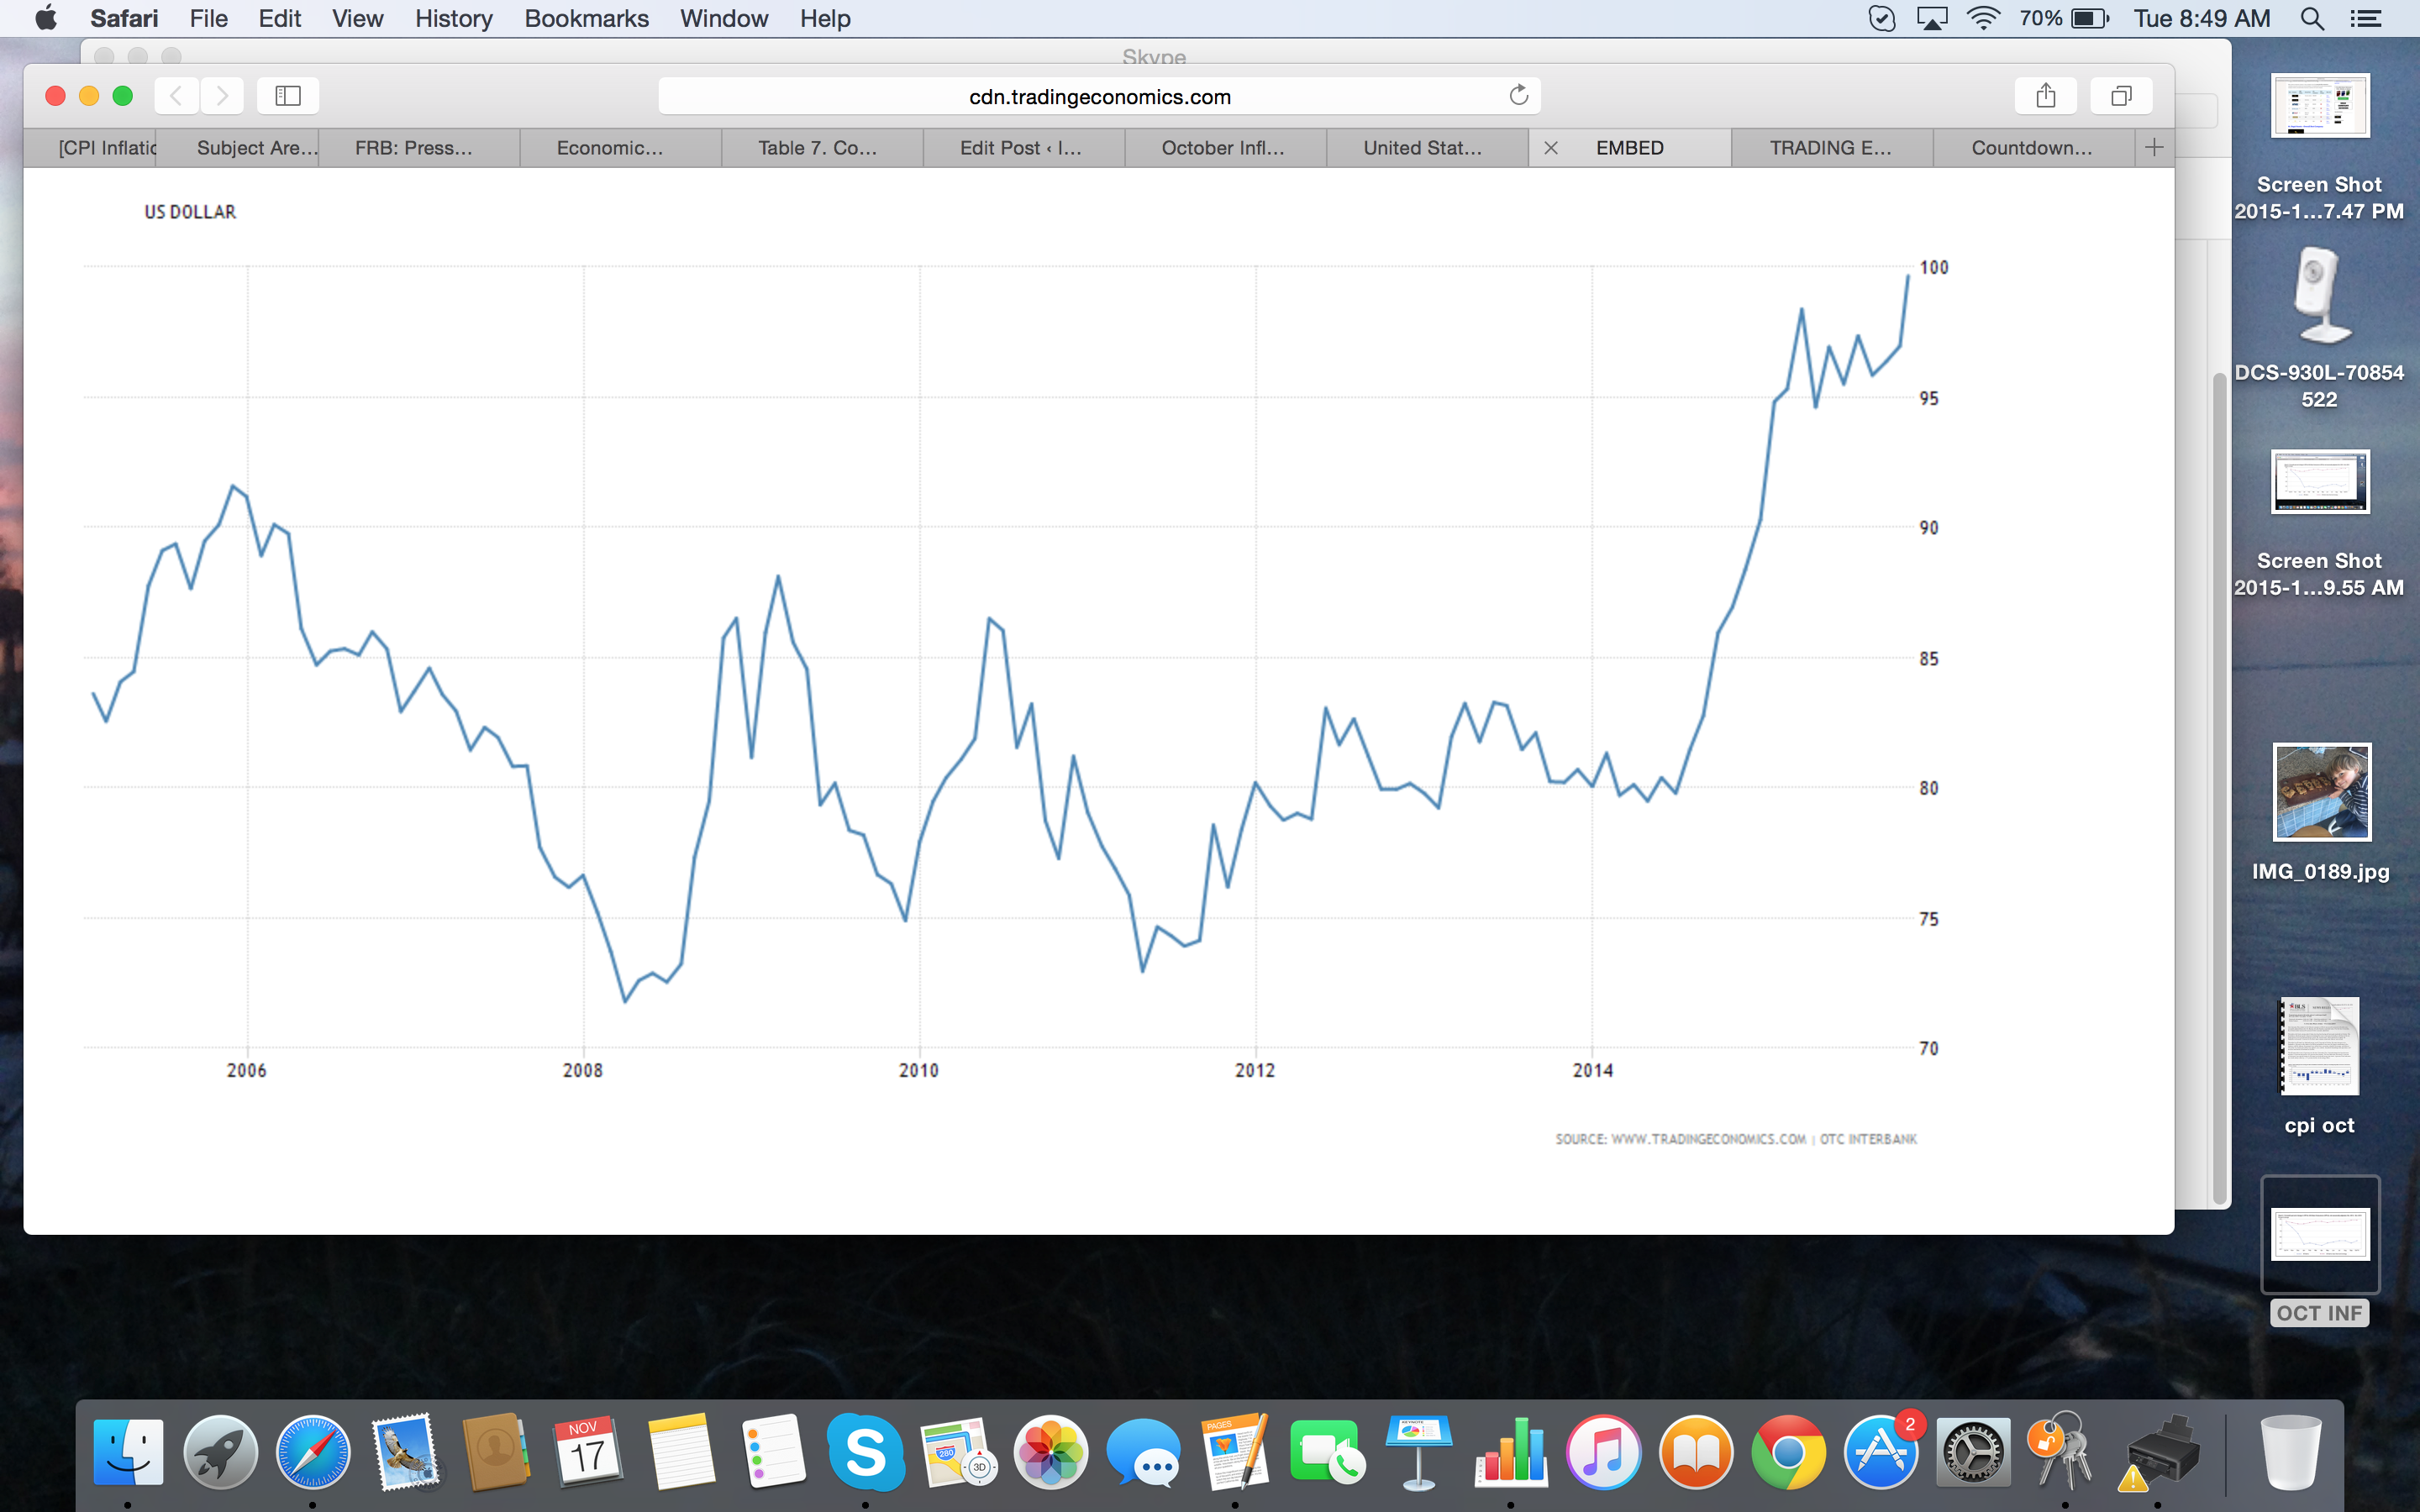
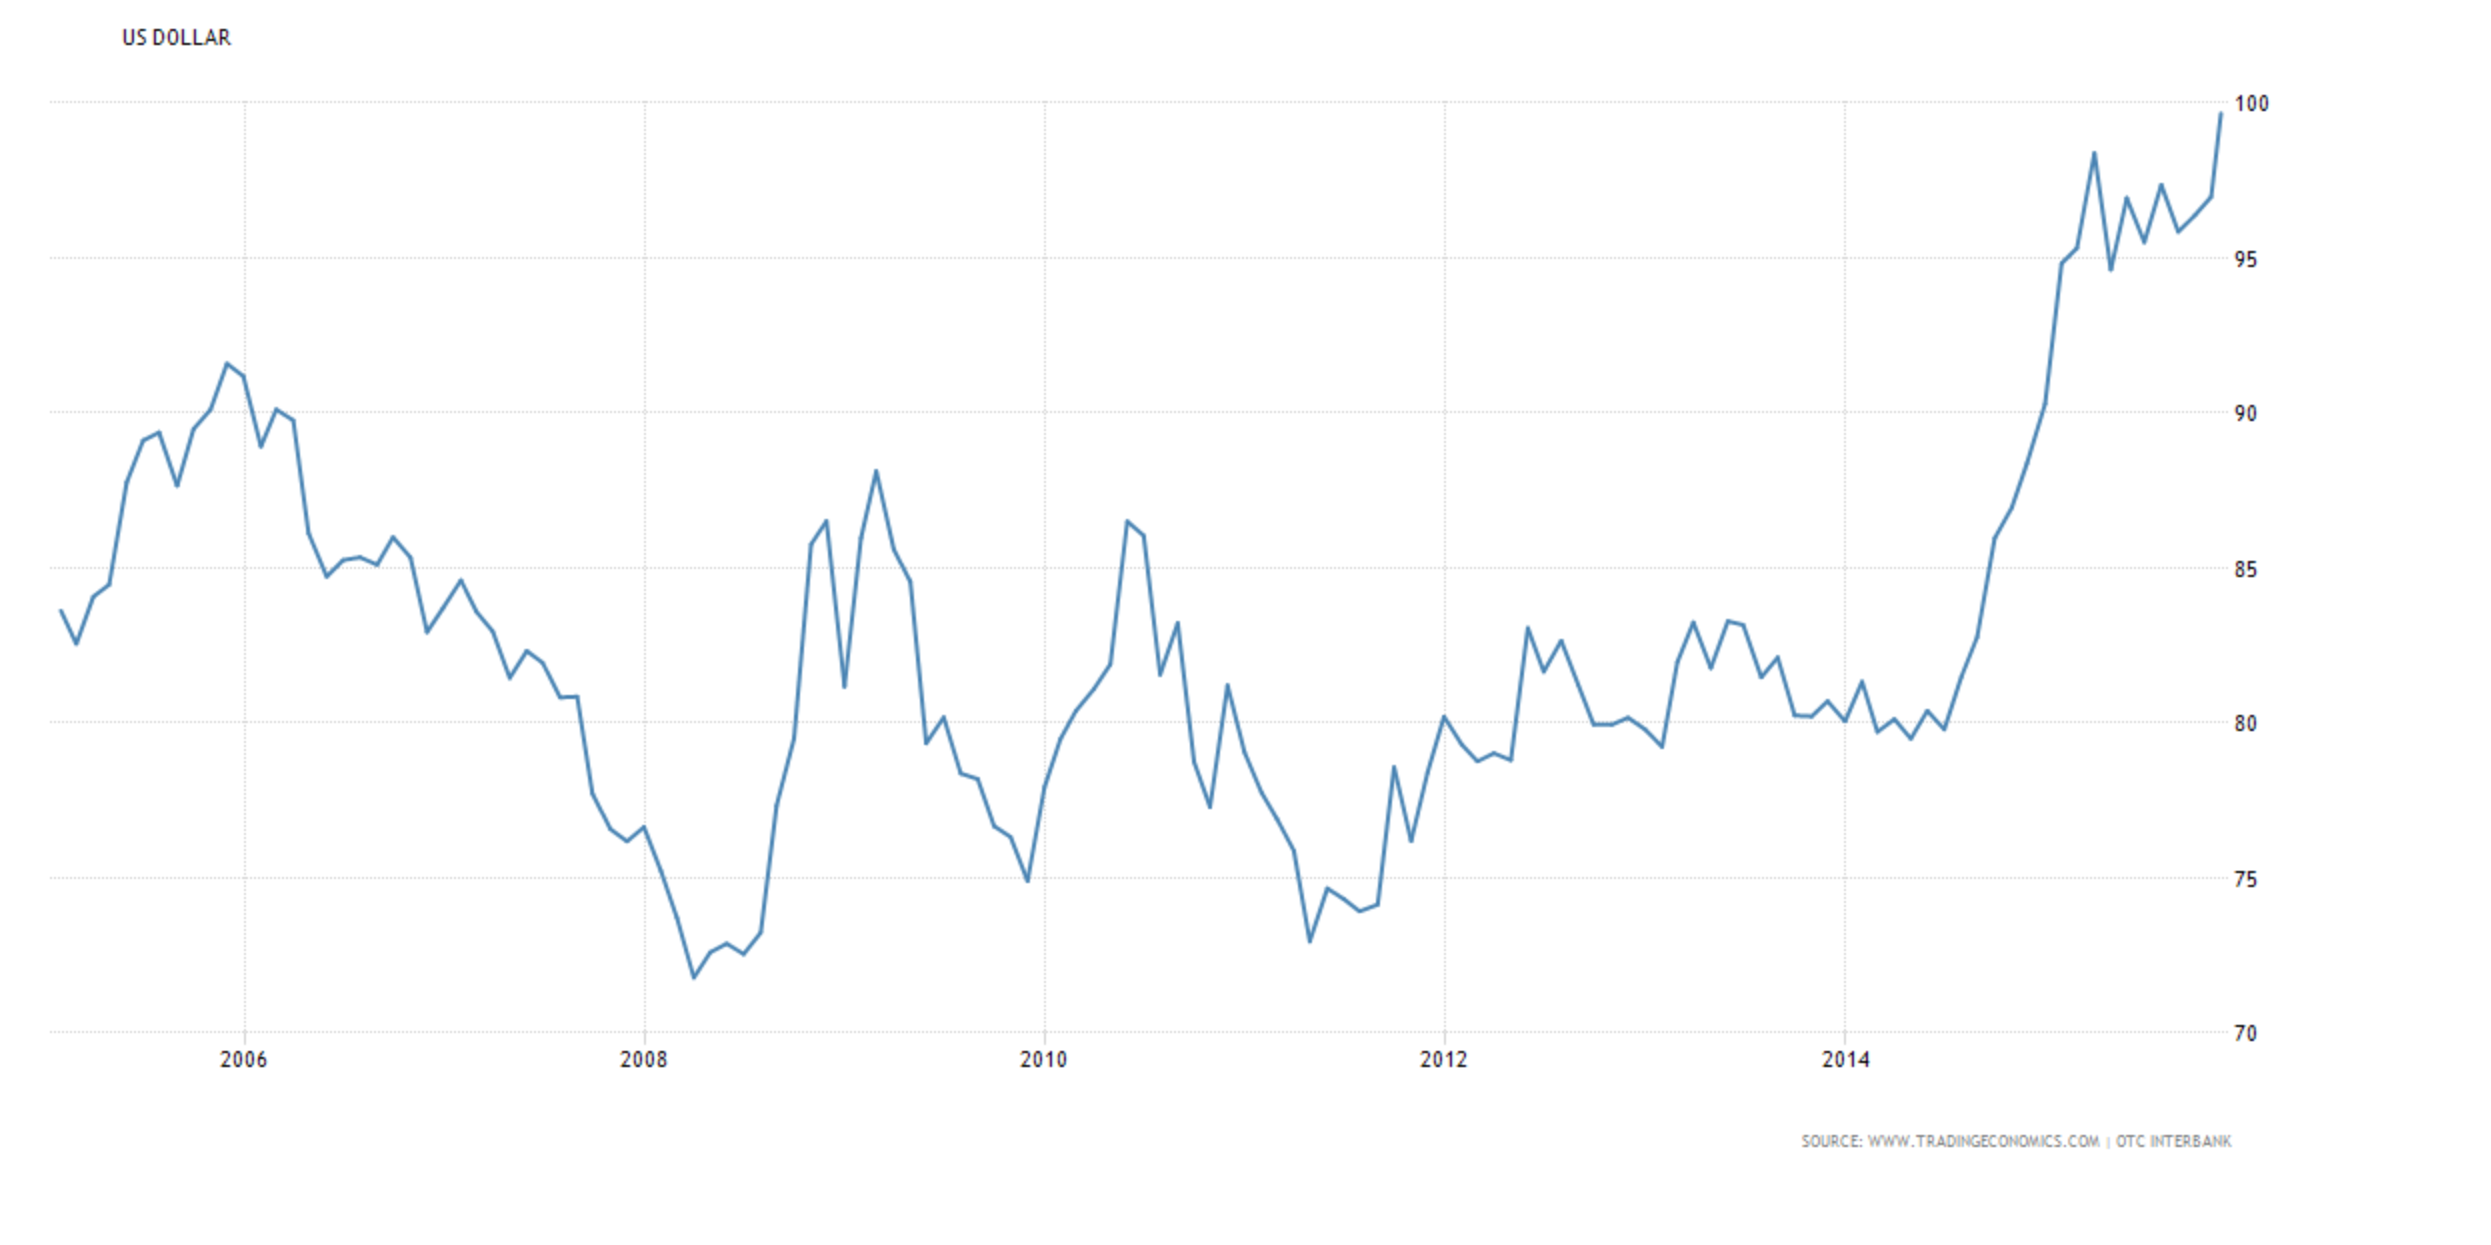
The modest but steady growth in the U.S. economy is in stark contrast to slowdowns in much of the world. With the EU considering quantitative easing and Japan dipping into recession, international money is flowing into the U.S. economy, driving the dollar higher. A rate hike would put further upward pressure on the U.S. dollar, which would create a slowdown in domestic manufacturing. It would also make imports cheaper, potentially keeping inflation from moving towards the target rate. The graph below shows the U.S. dollar reaching its highest level in 10 years versus a basket of international currencies. This should be a major concern at the next FOMC meeting on December 15th and 16th.
by Emily Cross Leon | Oct 15, 2015 | In the news, Inflation, Monthly CPI Updates
Falling gas prices kept inflation below zero for the month of August. The BLS announced this morning that the Consumer Price Index for All Urban Consumers (CPI-U) fell 0.2% in September on a seasonally adjusted basis; this is in line with expectations. In August, the CPI-U fell 0.1% following 6 straight months of growth. Gas prices also drove the decline in August’s CPI-U number. September’s decline wiped out the annual gains of 0.2% that were posted at the end of August, leaving the CPI-U flat for the year ending in September.
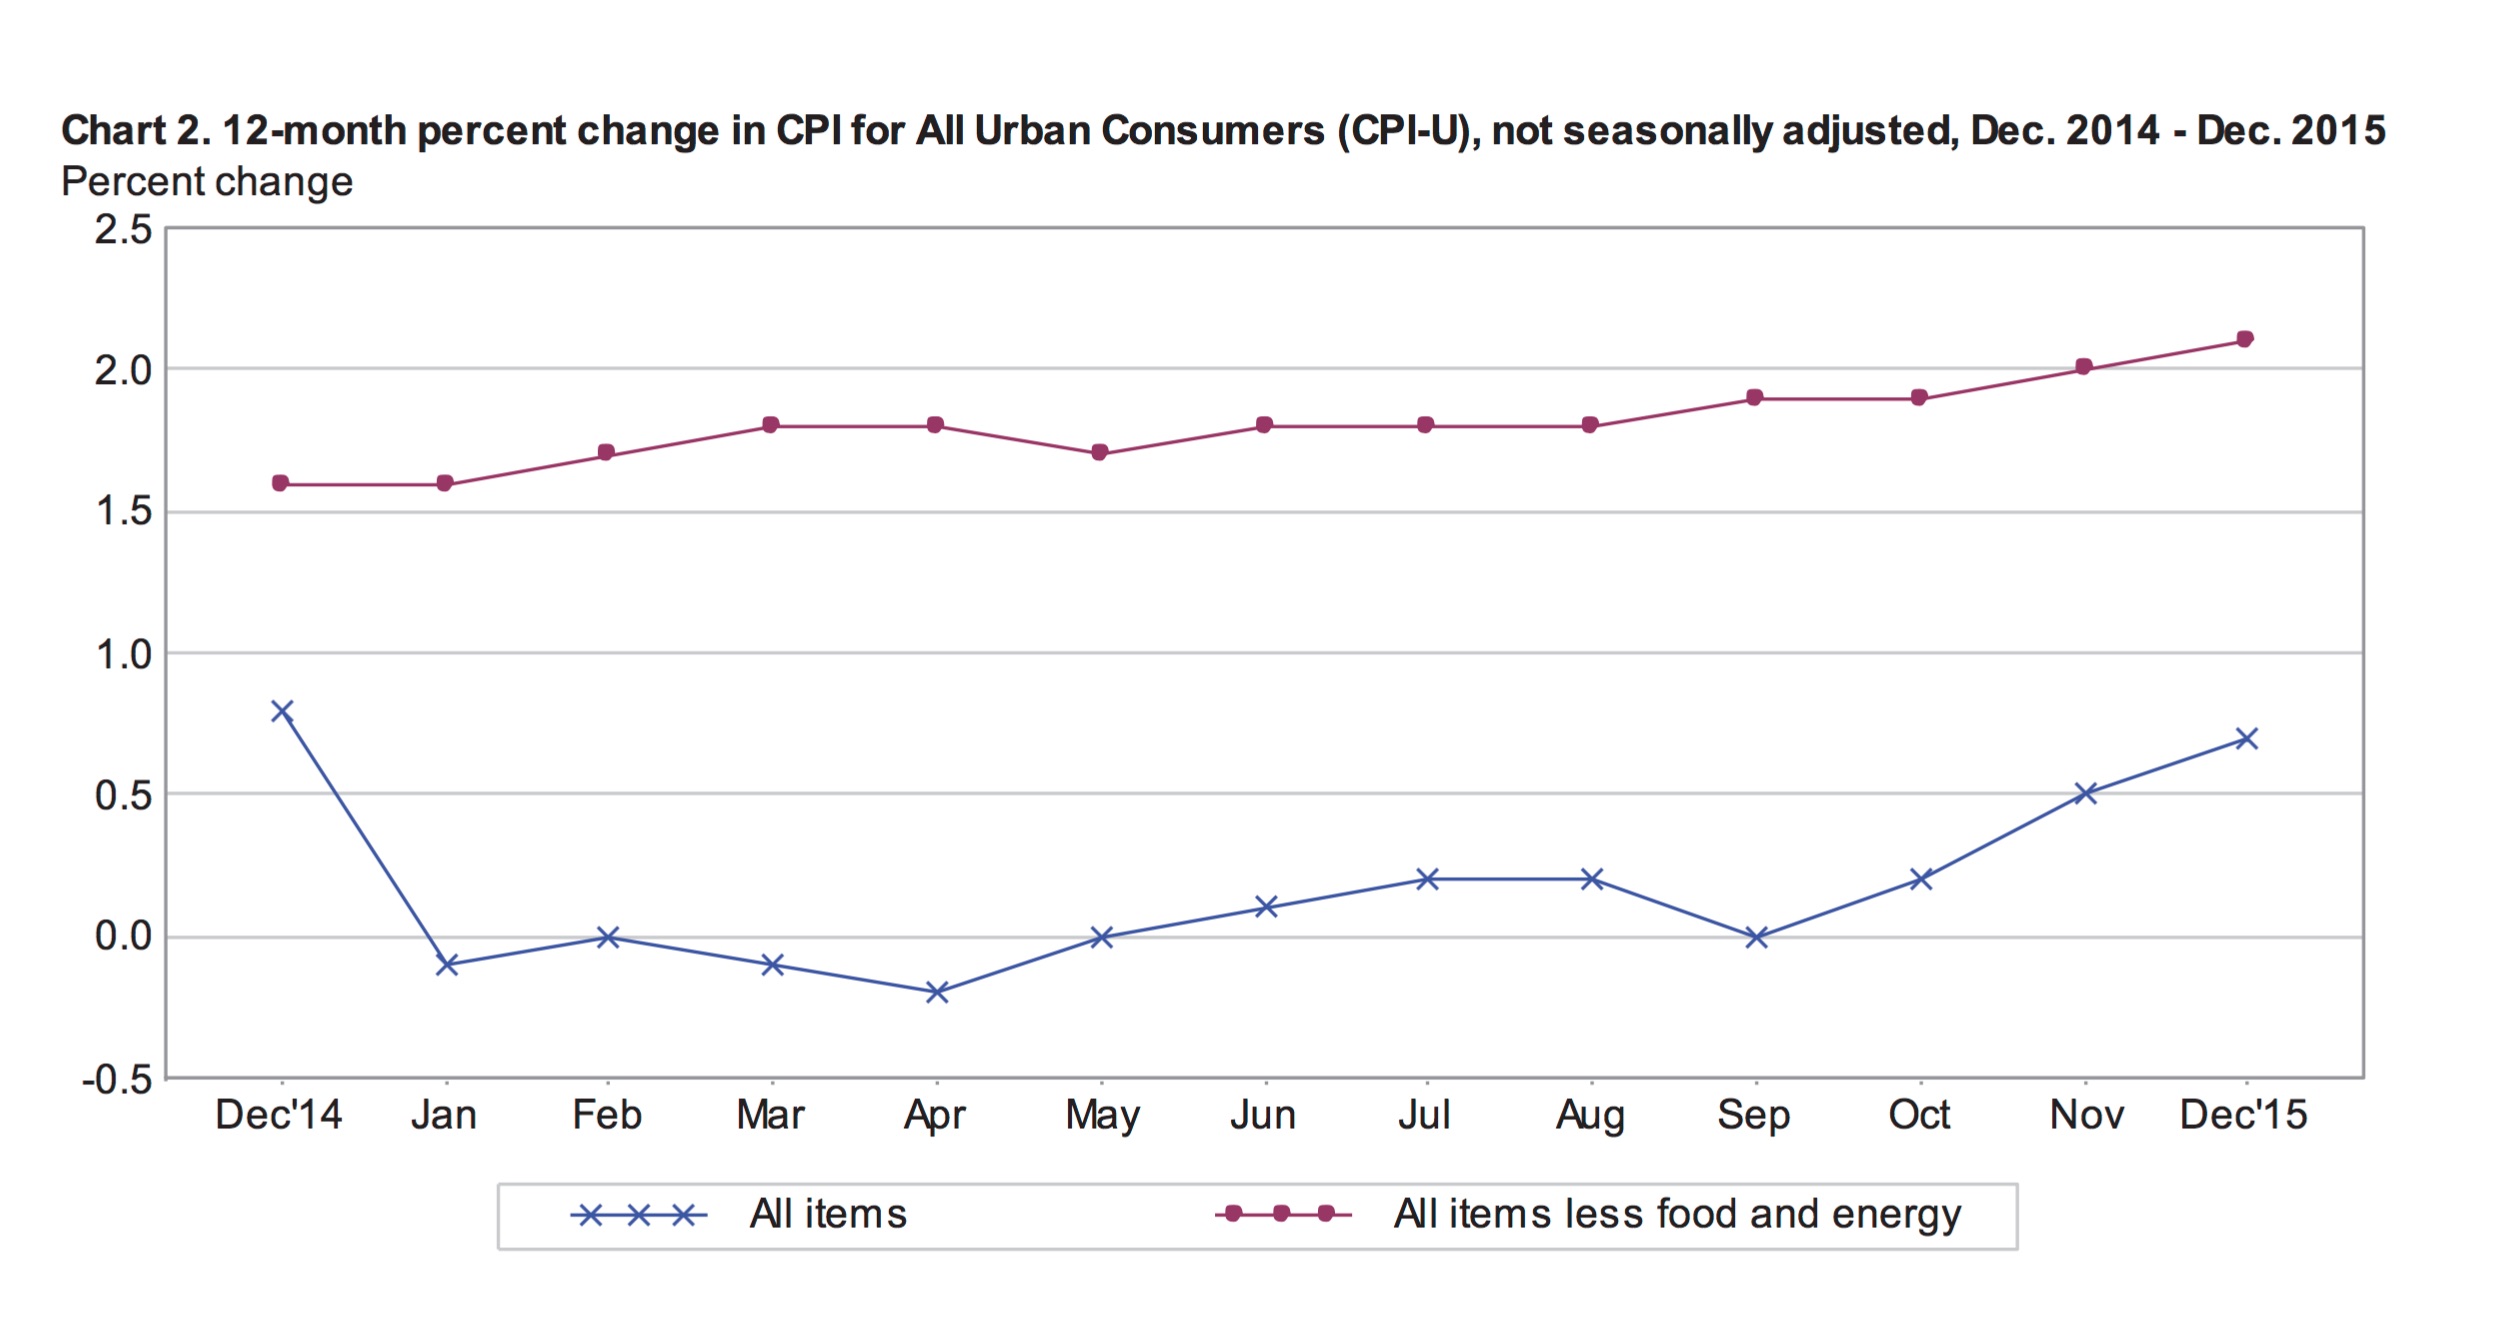
The index for all items less food and energy was up 0.2% in September, following increases of 0.1% in both July and August. For the 12-months ending in September, this core index increased 1.9%, pointing to more robust underlying growth for the U.S. economy. This is the highest annual core inflation number since July 2014. As the graph above shows, the disparity between overall consumer prices and consumer prices less food and energy continues to grow.
Energy Prices
The decline in overall consumer prices in September was largely driven by falling gasoline prices, which were down a seasonally adjusted 9% in the month alone. Over the same period, the energy index fell 4.7%, adding to August’s 2% decline. The energy index accounts for about 8% of the CPI-U and gasoline about 4%.
Volatile gasoline and energy prices have driven overall price levels and kept inflation very low over the past year. The energy index is down 9.7% for the year ending in September. Over this period, the biggest price declines were seen in the price of gasoline and fuel oil, down 18% and 18.6% respectively.
Seasonally Adjusted Monthly Numbers
On a seasonally adjusted basis, the CPI fell 0.2% in September following a decline of 0.1% in August.
Seasonally Adjusted Monthly % Change in CPI-U by Category (2016)
| January | February | March | April | May | June | July |
| All Items | 0 | -0.2 | 0.1 | 0.4 | 0.2 | 0.2 | 0.0 |
| Food | 0 | 0.2 | -0.2 | 0.2 | -0.2 | -0.1 | 0.0 |
| Energy | -2.8 | -6.0 | 0.9 | 3.4 | 1.2 | 1.3 | -1.6 |
| Gasoline | -4.8 | -12.5 | 2.2 | 8.1 | 2.3 | 3.3 | -4.7 |
| Fuel Oil (non seasonally adjusted) | -6.5 | -2.9 | 1.7 | 1.9 | 6.2 | 3.7 | -1.5 |
| Electricity | -0.7 | -0.2 | 0.4 | -0.3 | -0.2 | -0.5 | 0.5 |
| Utilities (piped gas service) | -0.6 | 1.0 | -0.7 | 0.6 | 1.7 | -0.4 | 3.1 |
| Energy Services | -0.7 | 0.1 | 0.2 | -0.1 | 0.2 | -0.5 | 1.0 |
| All Items Less Food and Energy | 0.3 | 0.3 | 0.1 | 0.2 | 0.2 | 0.2 | 0.1 |
| Services Less Energy Services | 0.3 | 0.3 | 0.2 | 0.3 | 0.4 | 0.3 | 0.2 |
| Shelter | 0.3 | 0.3 | 0.2 | 0.3 | 0.4 | 0.3 | 0.2 |
| Transportation Services | 0.4 | 0.2 | 0.2 | 0.7 | 0.3 | 0.3 | -0.2 |
| Medical Care Services | 0.5 | 0.5 | 0.1 | 0.3 | 0.5 | 0.2 | 0.5 |
The price of food climbed 0.4% in September, adding to August’s 0.2% increase in the food index. Higher prices for dairy and fruits and vegetables, including a 4.7% spike in the price of lettuce, were somewhat offset by declines in the prices for fish and poultry. The index that measures the price of food in primary and secondary schools was 7.2% higher in September alone.
The shelter index continues to climb, up 0.3% in September, following increases of between 0.2% and 0.4% per month since the beginning of the year. In September, higher shelter costs were the result of higher prices for hotels and lodging away from home. The rent index, which is part of the shelter index, climbed 0.4% in September. Shelter costs account for about one third of the CPI-U.
The medical care index was up 0.2% in September, including increases of 0.3% for medical care services and 0.6% for health insurance. At the same time, the costs for both prescription drugs and medical equipment and supplies were down 0.2%.
Following four months of declines, the index for household furnishings and operations increased 0.4% in September despite a fall of 0.7% in the price of floor coverings. Indoor plants and flowers were significantly more expensive, gaining 2.4% in September.
The index for apparel fell 0.3% in September, following two months of gains. September’s apparel number masks volatility within the index. On a seasonally adjusted basis, the prices for men’s outerwear fell 3.9% and girl’s apparel was down 3.7%. At the same time, the price of men’s sweaters climbed 8.7%.
Annual Inflation
September’s declining CPI-U wiped out any 12-month gains, leaving overall price levels flat for the year. Higher prices for most components of the index were just able to balance the 12-month 18.4% decline in energy prices. The food index was 1.6% higher for the 12-month period and Shelter costs climbed 3.7%. Transportation services were 2.2% higher, including increases of over 5% for both car and truck rentals and vehicle insurance. Significant 12-month price hikes were also posted for animal services including veterinary services (up 4.3%), admission to sporting events (up 7.8%) and childcare and nursery school fees (up 4.2%). In general, higher prices were recorded for most services. Financial service costs were nearly 4% higher for the year, including an increase of 5.1% for tax and accounting services.
Price declines over the past year include the cost of cell phone services (down 3.8%) and the index for cell phone hardware, calculators and consumer information items, which tumbled 15.8%. Airline fares were down 6% for the year as was the price of toys. Television sets became over 13% less expensive compared to a year earlier and the price of appliances in general fell 3.5%.
Economic Outlook
Today’s inflation numbers will be watched closely as the Federal Reserve appears divided over the possibility of an interest rate hike later in the year. Stronger inflation numbers would have suggested that the economy was more robust and ready for higher interest rates. However, today’s weak inflation data, although expected, add to a series of disappointing indicators.
The Producer Price Index, a principal gauge of inflation in the manufacturing sector, declined by 0.5% in September, its weakest number in 7 months. September retails sales were also a disappointment, missing expectations at 0.1% versus the expected 0.2%. Core retail sales slipped 0.3% below the expected decline of 0.1%. The U.S. dollar has also been falling due to a disappointing .
The next Federal Open Market Committee meeting is October 27-28. The markets have been pricing in approximately a 39% chance of a rate hike in December. However, this number has been declining following downturns in global and emerging markets. Today’s CPI-U numbers will not reverse the trend. Rates are likely to remain unchanged until at least March of next year.
by Emily Cross Leon | Sep 16, 2015 | In the news, Inflation
 Just ahead of the the FOMC’s two day deliberation over a potential interest rate hike, the BLS released August’s inflation data this morning. Headline inflation or the Consumer Price Index for Urban Consumers (CPI-U) fell a seasonally adjusted 0.1% for the month of August, in line with economists’ expectations. This follows July’s lacklustre 0.1% CPI-U growth which was below expectations. For the year ending in August, non-seasonally adjusted overall inflation was 0.2% for the second month in row.
Core Inflation, which excludes food and energy was up a seasonally adjusted 0.1% in the month of August. This follows an increase of 0.1% in July, which was driven by a spike in the cost of shelter. We continue to see a large disparity between core and overall CPI as food and energy prices remain very volitile. 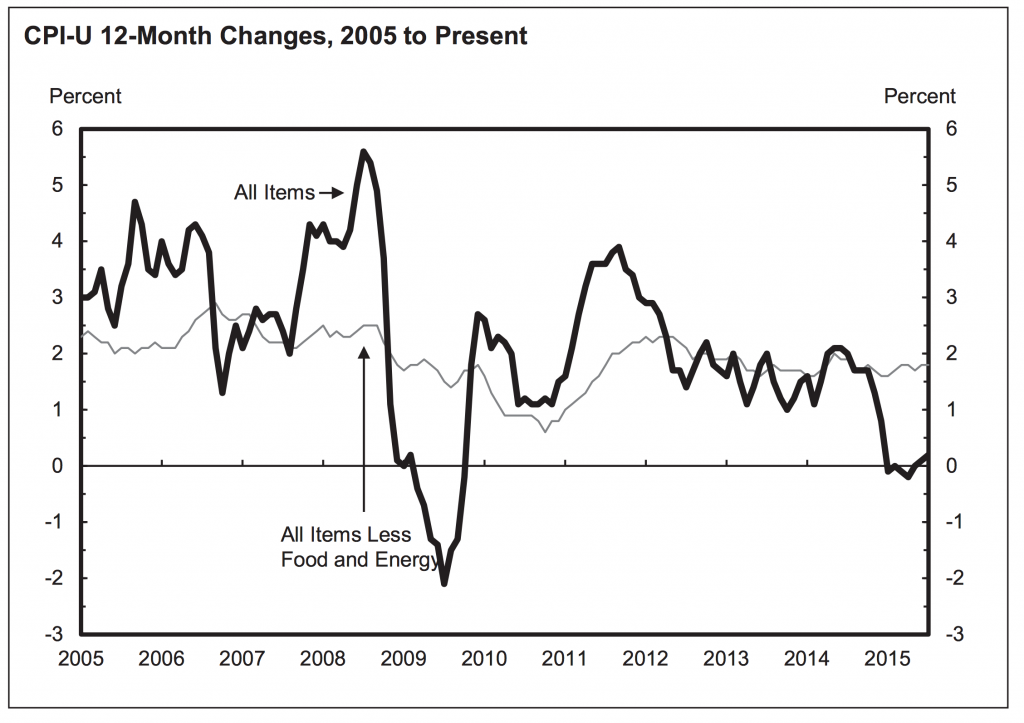
Seasonally Adjusted Monthly Numbers
In August, lower energy prices were not quite offset by higher prices for food, apparel and energy services, sending seasonally adjusted inflation below zero for the month.
Seasonally Adjusted Monthly % Change in CPI-U by Category (2016)
| January | February | March | April | May | June | July |
| All Items | 0 | -0.2 | 0.1 | 0.4 | 0.2 | 0.2 | 0.0 |
| Food | 0 | 0.2 | -0.2 | 0.2 | -0.2 | -0.1 | 0.0 |
| Energy | -2.8 | -6.0 | 0.9 | 3.4 | 1.2 | 1.3 | -1.6 |
| Gasoline | -4.8 | -12.5 | 2.2 | 8.1 | 2.3 | 3.3 | -4.7 |
| Fuel Oil (non seasonally adjusted) | -6.5 | -2.9 | 1.7 | 1.9 | 6.2 | 3.7 | -1.5 |
| Electricity | -0.7 | -0.2 | 0.4 | -0.3 | -0.2 | -0.5 | 0.5 |
| Utilities (piped gas service) | -0.6 | 1.0 | -0.7 | 0.6 | 1.7 | -0.4 | 3.1 |
| Energy Services | -0.7 | 0.1 | 0.2 | -0.1 | 0.2 | -0.5 | 1.0 |
| All Items Less Food and Energy | 0.3 | 0.3 | 0.1 | 0.2 | 0.2 | 0.2 | 0.1 |
| Services Less Energy Services | 0.3 | 0.3 | 0.2 | 0.3 | 0.4 | 0.3 | 0.2 |
| Shelter | 0.3 | 0.3 | 0.2 | 0.3 | 0.4 | 0.3 | 0.2 |
| Transportation Services | 0.4 | 0.2 | 0.2 | 0.7 | 0.3 | 0.3 | -0.2 |
| Medical Care Services | 0.5 | 0.5 | 0.1 | 0.3 | 0.5 | 0.2 | 0.5 |
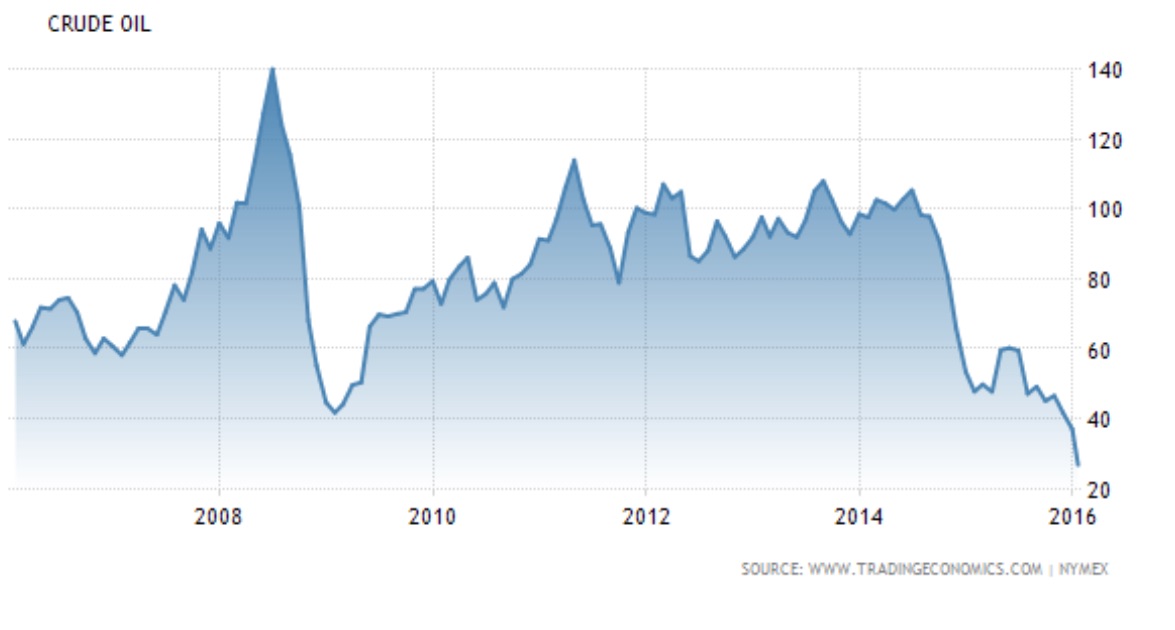
The energy index was down 2.0% for the month for August due to a drop in gas prices. On a seasonally adjusted basis, the gasoline index fell 4.1% in August following 3 consecutive months of growth including a 10.4% spike in May. Before seasonal adjustments, gas prices were 5.4% lower in August (see graph below). The price of fuel oil also fell a drastic 8.1% in August adding to declines in June and July. At the same time, energy services including electricity and piped gas were more expensive in August, climbing a seasonally adjusted 0.3% and 1.2% respectively.
 The index for food climbed 0.2% in August, driven by significant growth in the price of fruits, vegetables and eggs. The fruits and vegetable index was 1.5% higher for the month. The price of eggs also spiked 7.7% while the indexes for meat, fish and poultry were generally lower.
Without food and energy, which are very volatile, the index for all items or core index increased 0.1% for the second consecutive month. This includes the shelter index which continues to climb, increasing 0.2% in August following larger increases in June (+0.3%) and July (+0.4%). Growth in shelter costs continues to be a major driver of core inflation. Price increases were also seen in apparel, tobacco, alcohol, medical care commodities and non-energy services.
After falling 5.6% in July, the price of airline tickets continued to decline in August, down 3.1% for the month. Other factors keeping seasonally adjusted inflation below zero in August include declines in the prices of used cars and trucks (-0.4%), household furnishings (-0.3%) and recreation (-0.1%).
Annual Inflation
Year over year, the all items index increased 0.2% in August. The number, which has been rising since April, was also 0.2% in July. Food and shelter costs were significantly higher over both annual periods. Prior to seasonal adjustment, the price of food was up 1.6% for the year ending in August, the same as the year ending in July. Shelter costs were 3.1% higher for the 12-month period. The indexes for transportation, medical care services and non-energy services were all higher, up 2.1%, 2.2% and 2.6% respectively.
Despite higher prices in many parts of the economy, sever declines in energy prices for the year ending in August kept inflation tame. The energy index fell 15% for the year ending in August including declines in all major components. The most drastic fall was in the price of fuel oil, down 34.6% for the year. The gas index was down 23.3% and piped gas services were 11.5% cheaper for the year.
The index for all items less food and energy was in line with July, rising 1.8% over both 12-month periods. August marks the fifth time in 6 months that the 12-month change in core inflation was 1.8 percent. Annual core inflation was driven by higher prices for shelter, health care, new vehicles and recreation. While apparel, used vehicles, household goods and air travel have all posted 12-month price declines.
Outlook for the Fed
A high inflation number would have been welcome news for the Federal Reserve as it would have been a missing piece pointing to a strengthening economy and giving them the opportunity to raise interest rates for the first time since 2006. Most other U.S. economic data is more positive. Unemployment was down in August for the third consecutive month and hovering around what the Fed considers ‘full employment‘ at 5.1%. However, with inflation quite stagnant, a rate hike is unlikely this month
Emerging markets, struggling since the recent downturn in China, would be vulnerable to a U.S. rate hike. Higher rates would strengthen the U.S. dollar. Emerging markets, with U.S. dollar denominated debt would struggle to repay loans. Markets are currently pricing in a U.S. rate hike in December. Today’s inflation data was inline with expectations and will not change the market’s expectations regarding the timing of rate increases.