
Alex Demolitor
Alex Demolitor is a financial writer and cross-asset analyst who completed the CFA Program, passing all three levels of the CFA exams. He has a Bachelors degree from King's College in Ontario and specializes in the fundamental analysis of stocks, bonds, commodities, and FX, with a focus on U.S. and Canadian economic indicators like CPI and inflation. His market analysis has appeared on major publications such as FXEmpire, Investing.com, and AdvisorPedia.
by Alex Demolitor | Jan 13, 2026 | Definitions
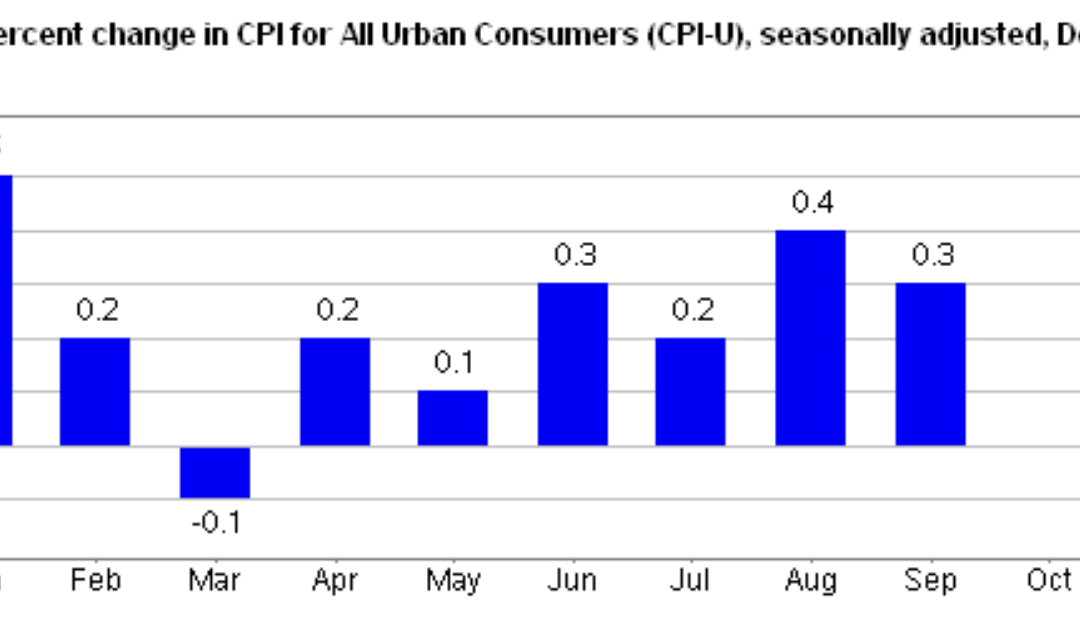
The December 2025 Consumer Price Index of All Urban Consumers (CPI-U) report indicates that inflation increased by 0.3% this month, up from the 0.2% average over the last two months. These data were released at 8:30 am EST on January 13, 2026, by the Bureau of Labor Statistics (BLS). Before seasonal adjustment, the year-over-year (Y-o-Y) inflation rate in the all-items index grew by 2.7%, matching the recent two-month average.
Today’s core results also missed economists’ consensus estimates. The table below is courtesy of Investing.com. The left column represents December’s figures, while the right column represents forecasters’ expectations. As you can see, the red metrics highlight how core inflation was weaker than anticipated.

With Fed Chairman Jerome Powell still leading the FOMC until his term ends later this year, he reiterated in December that he’s in no hurry to cut rates. And with investors pricing in little to no chance of a rate cut in January, Bloomberg reported on Jan. 9 that “Bond traders maintained an outlook for two rate cuts overall in 2026, with the first seen by mid-year.”
As a result, disappointing economic data will likely be required for accelerated easing over the next few months.

Food Prices
The food index rose by 0.7% MoM in December, and five of the six major grocery indices increased this month.
- Cereals and bakery products (+0.6%)
- Meats, poultry, fish, and eggs (-0.2%)
- Dairy and related products (+0.9%)
- Fruits and vegetables (+0.5%)
- Nonalcoholic beverages (+0.4%)
- Other food at home (+1.6%)
The food away from home index also jumped by 0.7%, as restaurant inflation kept pace with grocery prices in December.
Energy Prices
The energy index increased by 0.3% MoM in December, with gasoline prices down by 0.5%, electricity down by 0.1%, and natural gas rising by 4.4%.
Core CPI
The December core CPI rose by 2.6% Y-o-Y, matching the average figure from the previous two months. As a reminder, the October CPI report was cancelled due to the government shutdown, so the metrics don’t have comparable MoM data from November.
- Shelter index: (+0.4%)
- Rent index: (+0.3%)
- Owners’ equivalent rent: (+0.3%)
- Motor vehicle insurance: (NA)
- Medical care services: (+0.4%)
- Physician services: (+0.3%)
- Hospital services: (+1.0%)
- Airline fares: (5.2%)

Seasonally Unadjusted CPI
Before seasonal adjustments, the CPI-U for December 2025 increased by 2.7% Y-o-Y to an index level of 324.054. Since these figures are unadjusted, they include regular seasonal price fluctuations that can create volatility in the results.
Let the Good Times Roll
With solid economic data pointing to steady economic activity, the FOMC can continue its wait-and-see approach and not rush further rate cuts.
For example, the BLS released its Employment Situation report on Jan. 9. The U.S. economy added 50,000 net new jobs, and the unemployment rate declined to 4.4%. Furthermore, average hourly earnings (a proxy for wage inflation) increased from 3.6% Y-o-Y in November to 3.8% Y-o-Y in December. Consequently, the labor market remains on solid footing for the time being.

As further evidence, the BLS released its Job Openings and Labor Turnover Summary (JOLTS) on Jan. 7. And with more than seven million job openings still available, the metric (the blue line below) has stabilized near its pre-pandemic baseline. Likewise, layoffs and discharges (the green line below) also remain in a healthy range and highlight how most employers continue to retain staff.

Finally, the Atlanta Fed updated its Q4 GDPNow model on Jan. 9. And while the results can be skewed by fluctuating imports and exports, and the data is lagged, the latest reading pegs growth at 5.1% (the green line below). If realized, the results would be well above 2% trend growth and economists’ consensus estimates (the blue line below).

Add it all up, and the recent data is strong enough to suppress any rate-cut calls, and the FOMC should continue to preach the same message until weaker data forces its hand.
Turning to the financial markets, gold had a tremendous 2025, and the fundamentals support more strength in 2026.

To explain, the orange line above tracks the 5-year rolling percentage change in the gold price, while the blue line above tracks the 5-year rolling percentage change in global military spending. As you can see, the yellow metal lives up to its safe-haven reputation when the geopolitical outlook becomes more treacherous.
To that point, U.S. President Donald Trump has advocated for a 50% increase in the U.S. military budget, in what he called “very troubled and dangerous times.” As a result, the spending trend should continue, and the developments are bullish for gold.
Are you thinking about diversifying into precious metals? Talk to your financial advisor about initiating a gold IRA account today, allowing you to invest in this red-hot asset on a tax-advantaged basis. Additionally, our complimentary CPI inflation calculator remains at your disposal, enabling you to assess inflation’s impact on your finances. Please seek the guidance of a financial advisor before making any investment decision.
Furthermore, if you’re looking to diversify your portfolio or strategically exit a business, there are several strategies to help realize the best valuation. Our extensive guides for company owners in Illinois, Michigan, and Ohio provide insights into compliance issues, tax plans, demand assessments, and much more.
In addition, please consult our list of debt management firms for other financial services in your area.
by Alex Demolitor | Dec 18, 2025 | Definitions
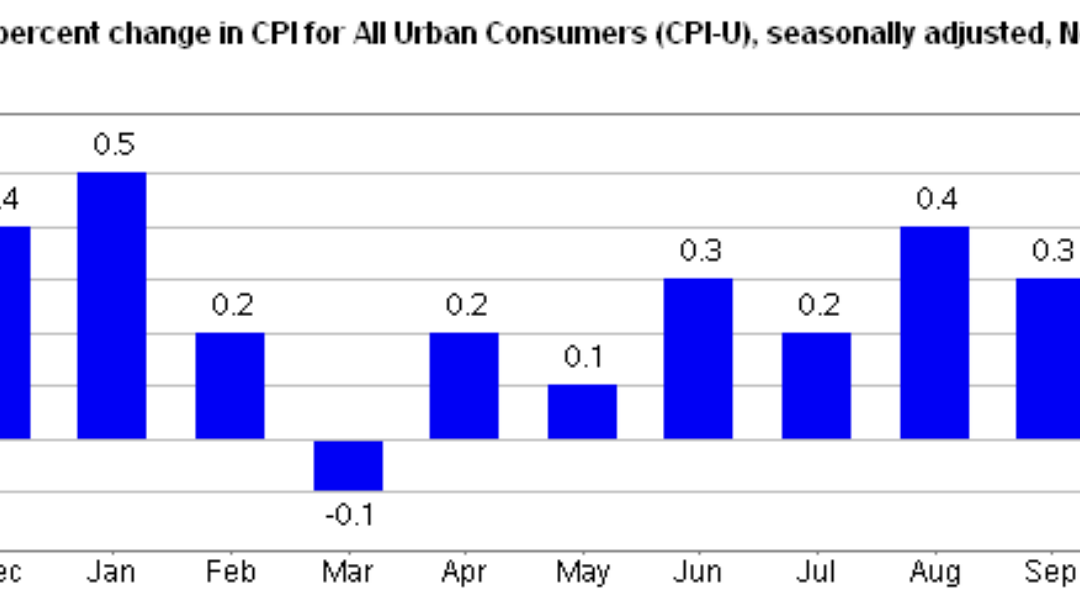
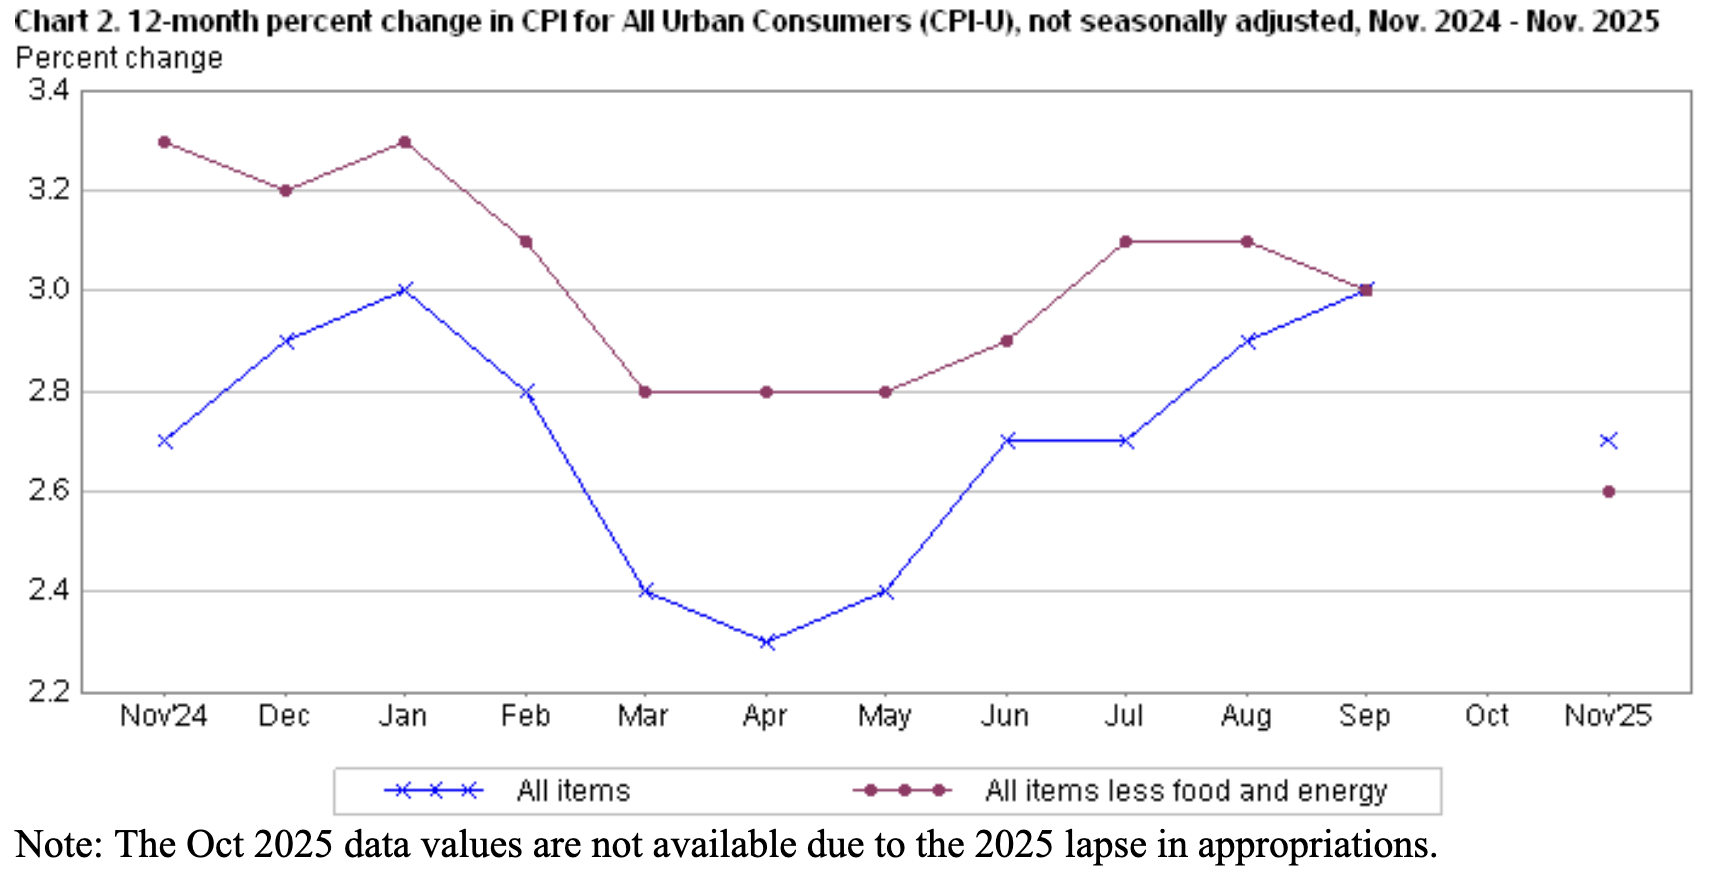
The November 2025 Consumer Price Index of All Urban Consumers (CPI-U) report indicates that inflation increased by 0.2% over the last two months, down from 0.3% in September. These data were released at 8:30 am EST on December 18, 2025, by the Bureau of Labor Statistics (BLS). Before seasonal adjustment, the year-over-year (Y-o-Y) inflation rate in the all-items index grew by 2.7%, down from 3.0% in September. As a reminder, the October CPI report was cancelled due to the government shutdown, so there are no comparable figures on a MoM basis.
Today’s results also missed economists’ consensus estimates. The table below is courtesy of Investing.com. The left column represents November’s figures, while the right column represents forecasters’ expectations. As you can see, the red metrics highlight how inflation was subdued relative to forecasts.

After cutting interest rates for the second consecutive meeting, Fed Chairman Jerome Powell emphasized on Dec. 10 that “Monetary policy is not on a preset course, and we will make our decisions on a meeting-by-meeting basis.”
“Everyone around the table at the FOMC agrees that inflation is too high and we want it to come down, and agrees that the labor market has softened and that there is further risk…. I’ve said before a couple times, we’re well positioned to wait to see how the economy evolves. We’ll just have to see.”
As such, with the FOMC confronting uncertainty on both sides of its dual mandate, further labor market weakness is likely necessary for more easing in the months ahead.
Food Prices
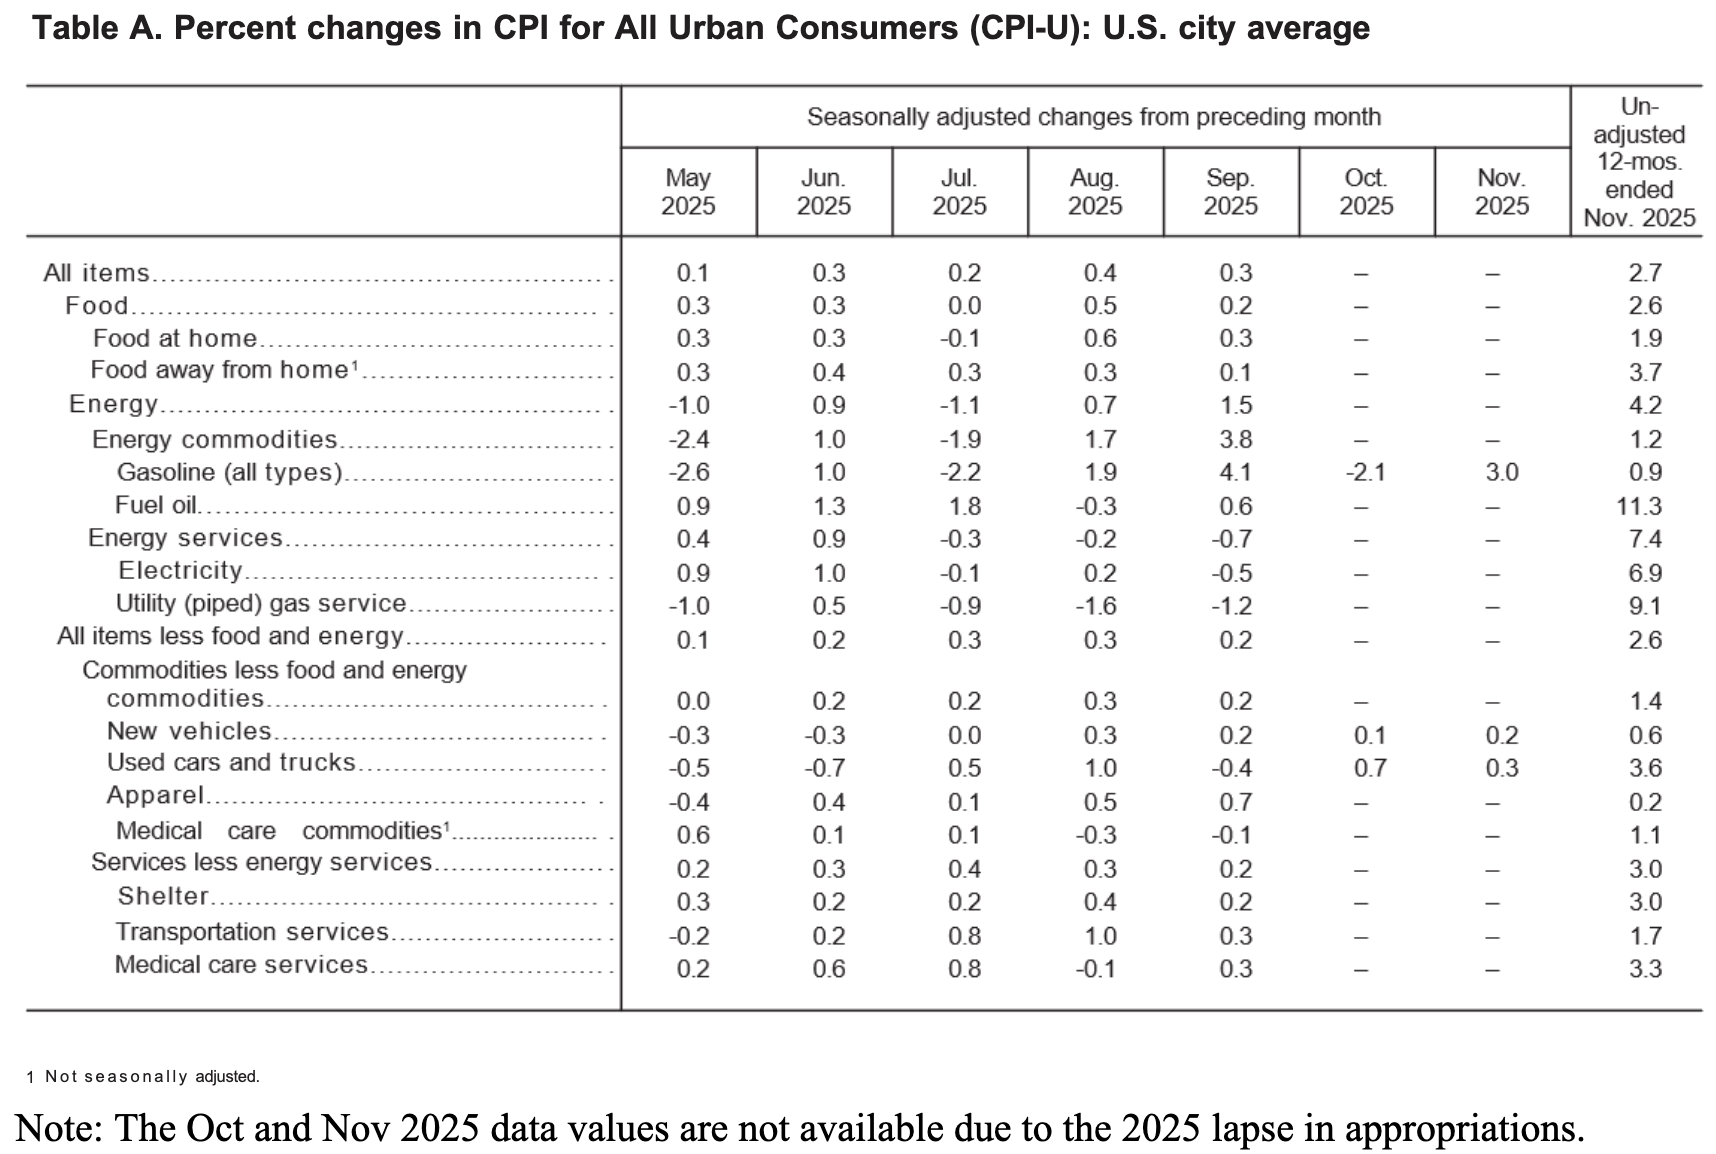
The food index rose by 2.6% Y-o-Y in November. Again, the monthly changes are neglected due to the missing October report, so the figures below are relative to November 2024.
- Cereals and bakery products (+1.9%)
- Meats, poultry, fish, and eggs (+4.7%)
- Dairy and related products (-1.6%)
- Fruits and vegetables (+0.1%)
- Nonalcoholic beverages (+4.3%)
- Other food at home (+1.3%)
The food away from home index was up by 3.7%, as restaurant inflation continues to outpace grocery prices.
Energy Prices
The energy index rose by 4.2% Y-o-Y in November, with gasoline prices up by 0.9%, electricity by 6.9%, and natural gas by 9.1%.
Core CPI
The November core CPI rose by 2.6% Y-o-Y, down from 3.0% in September. Below is an itemized breakdown of the main Y-o-Y price fluctuations seen in the core CPI reading:
- Shelter index: (+3.0%)
- Rent index: (+3.0%)
- Owners’ equivalent rent: (+3.4%)
- Motor vehicle insurance: (NA)
- Medical care services: (+3.3%)
- Physician services: (+1.7%)
- Hospital services: (+5.7%)
- Airline fares: (-5.4%)
Seasonally Unadjusted CPI
Before seasonal adjustments, the CPI-U for November 2025 increased by 2.7% Y-o-Y to an index level of 324.122. Since these figures are unadjusted, they include regular seasonal price fluctuations that can create volatility in the results.
Not Bad Enough
With mixed economic data hitting the wire in recent days, there isn’t any concrete evidence that supports the Fed altering its meeting-by-meeting approach.
For example, S&P Global released its U.S. Composite PMI on Dec. 16. And while growth momentum has slowed, the current reading of 53 signals a healthy expansion. An excerpt read:
“The headline S&P Global US PMI ® Composite Output Index fell to 53.0 in December from 54.2 in November, according to the ‘flash’ reading (based on about 85% of usual survey responses). The latest reading was the lowest since June, though continues to indicate robust economic growth….
“Input cost inflation accelerated markedly in December, hitting the fastest since November 2022,” while “increased costs again fed through to higher selling prices, with the overall rate of inflation rising to the steepest since July and therefore amongst the greatest since the pandemic-related price-surge of 2022.”
So, while business activity has softened over the last few months, the modest momentum deceleration is unlikely to induce rate cuts with alternative inflation metrics trending up.

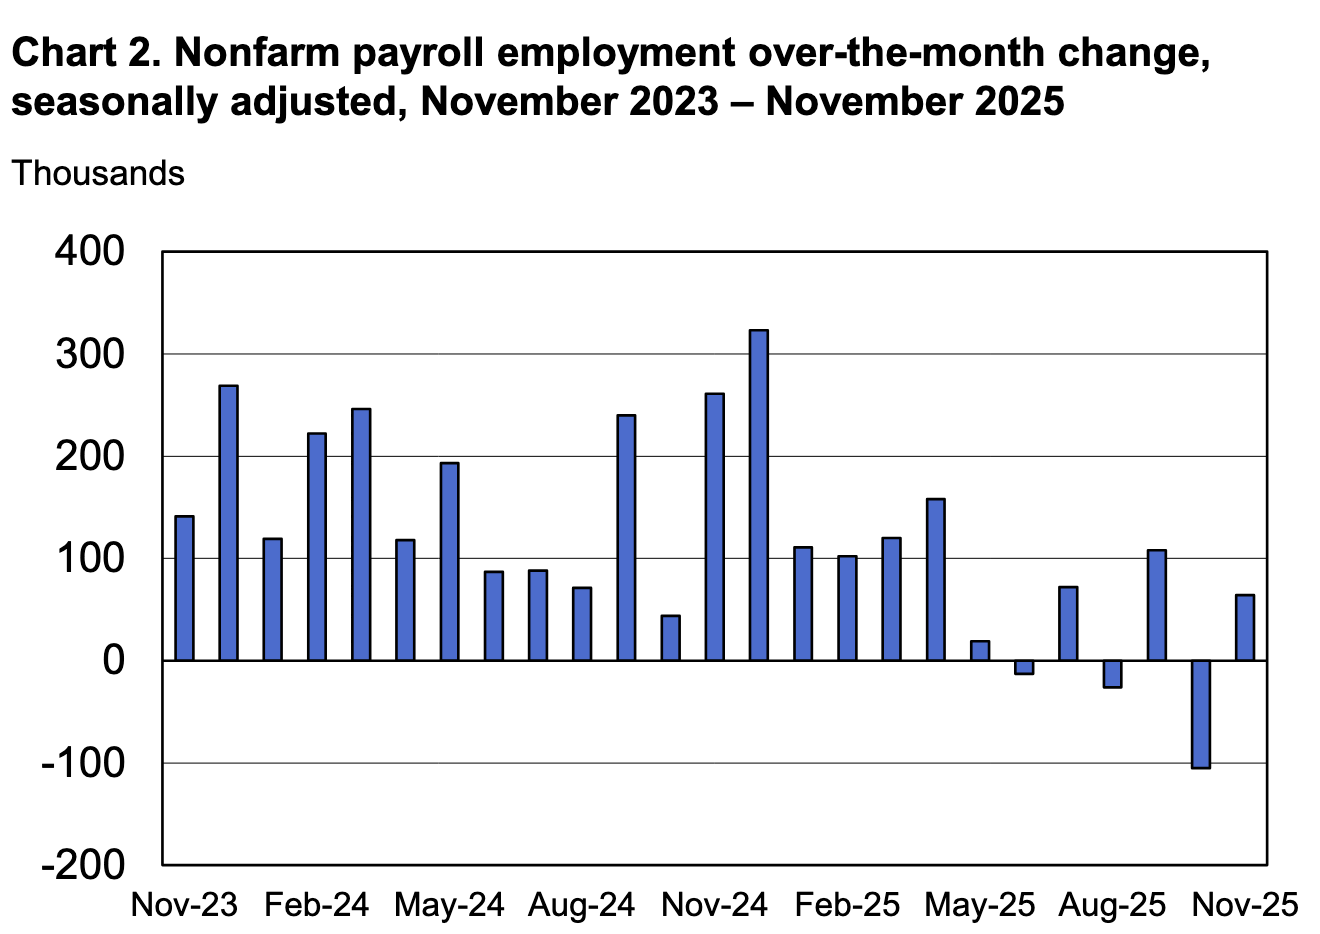
Furthermore, the U.S. Bureau of Labor Statistics revealed on Dec. 16 that the U.S. economy added 64,000 net new jobs in November — a solid increase given the paltry figures realized over the last few months. The report also noted how “Construction employment grew by 28,000 in November, as nonresidential specialty trade contractors added 19,000 jobs,” which highlights decent strength in the interest-rate sensitive sector.
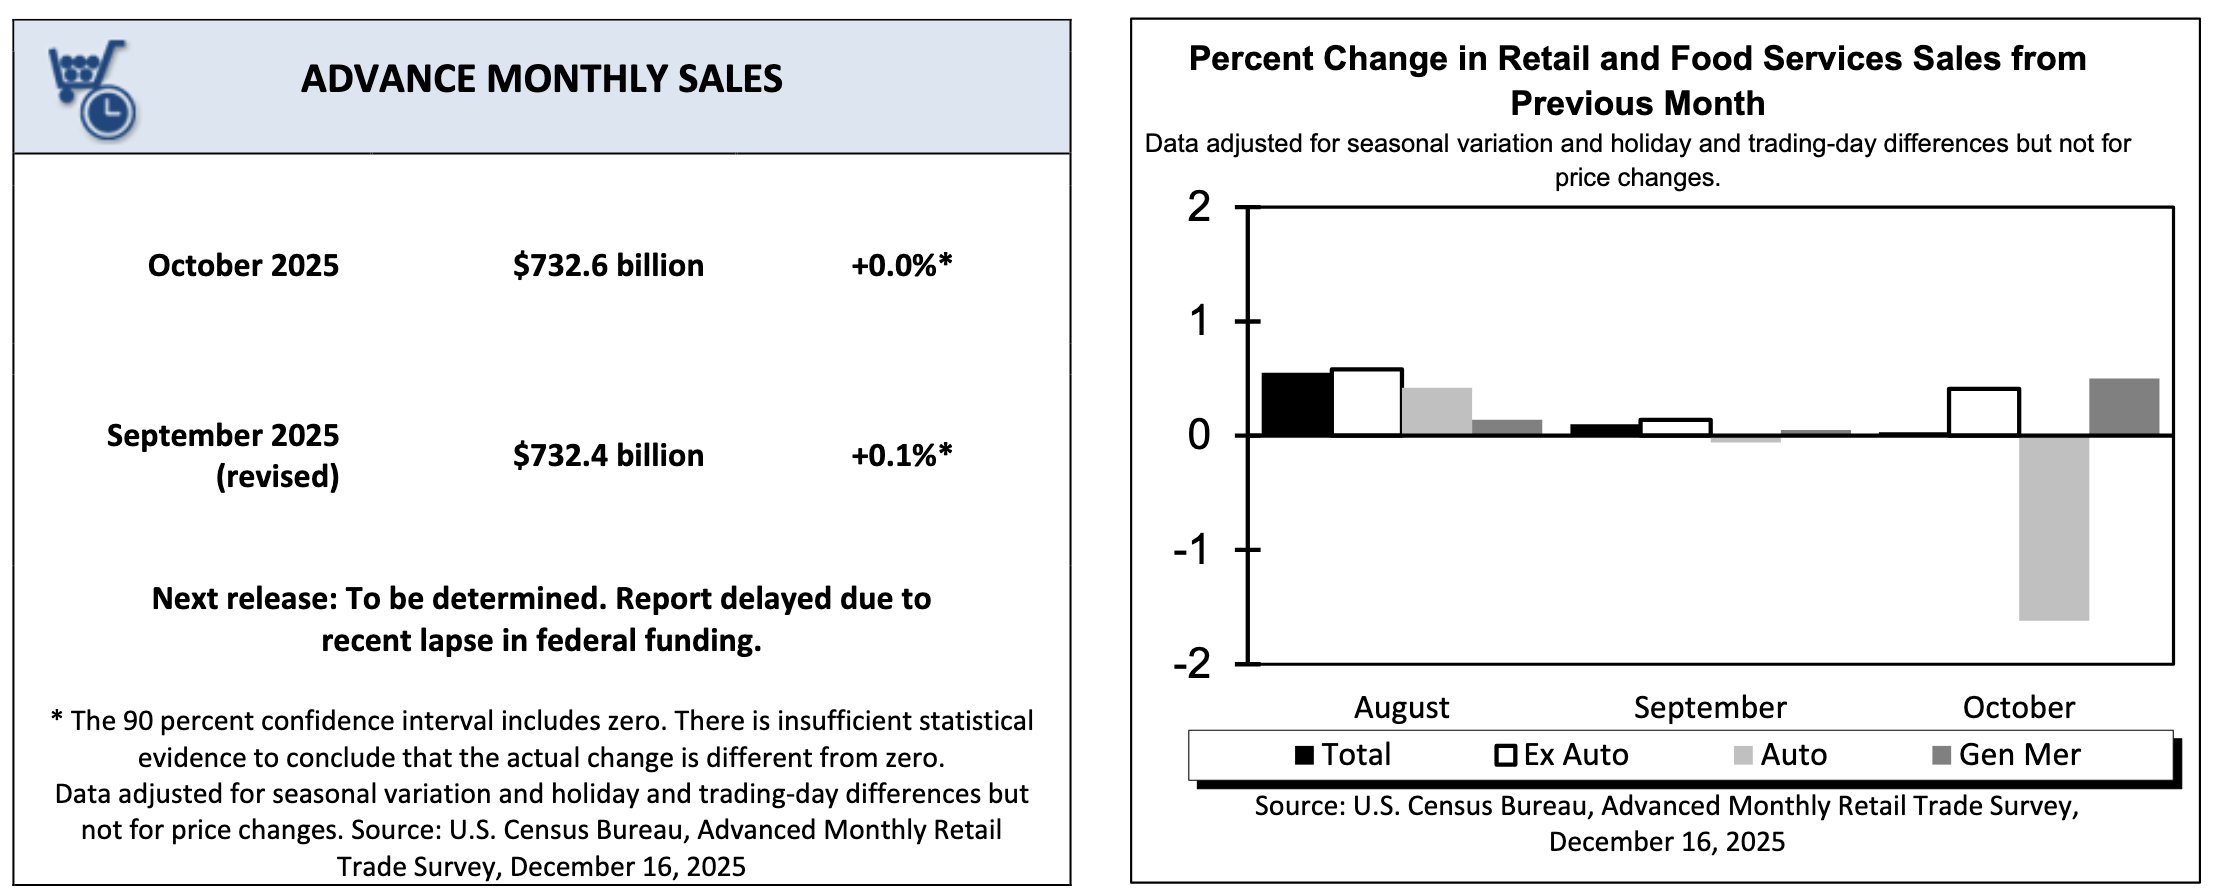
Finally, the U.S. Census Bureau added on Dec. 16 that retail sales remained solid on an annual basis, as consumers continued to spend ahead of the holiday season. An excerpt read:
“Retail trade sales were up 0.1 percent (±0.5 percent)* from September 2025, and up 3.4 percent (±0.5 percent) from last year. Nonstore retailers were up 9.0 percent (±1.2 percent) from last year, while food service and drinking places were up 4.1 percent (±1.8 percent) from October 2024.”
Add it all up, and the recent data is likely good enough to keep the FOMC in wait-and-see mode.
Turning to the financial markets, gold has had an impressive 2025, and further gains could be in store in the months and years ahead.
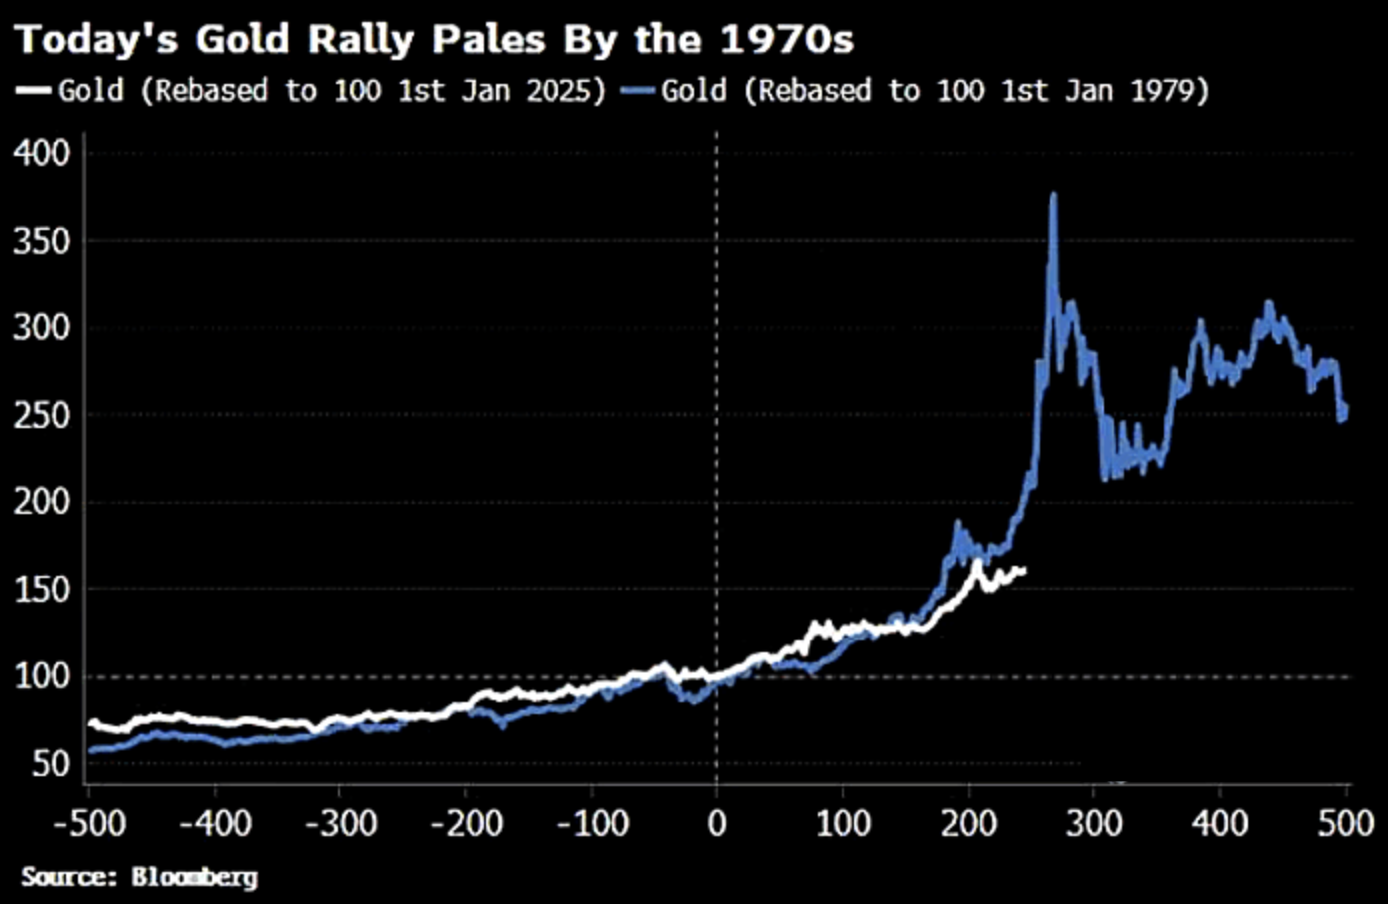
To explain, the white line above tracks gold’s indexed performance since Jan. 1, 2025, while the blue line above tracks its indexed performance from Jan. 1, 1979. As you can see, the yellow metal had a lot of runway during the historical surge; and given the similar fundamental developments occurring today, gold’s bull market may have plenty of room to run.
Are you thinking about diversifying into precious metals? Talk to your financial advisor about initiating a gold IRA account today, allowing you to invest in this red-hot asset on a tax-advantaged basis. Additionally, our complimentary CPI inflation calculator remains at your disposal, enabling you to assess inflation’s impact on your finances. Please seek the guidance of a financial advisor before making any investment decision.
Furthermore, if credit concerns have increased alongside the economic uncertainty, residents in Georgia have options at their disposal. Our extensive guide outlines how to approach credit counseling, debt management plans, the different types of loans and financing products, as well as the best companies to help guide you along the way. Similarly, Ohio residents have access to professional solutions, with free and nonprofit assistance also available in the region. Finally, Illinois has several local and nationwide firms that can negotiate with creditors on your behalf, create repayment plans, and help determine if declaring bankruptcy is an appropriate solution.
Remember, speaking with a professional ensures the right products are matched with your needs. For more options across other cities and states, please consult our list of debt management firms that can help keep you on track.
by Alex Demolitor | Oct 24, 2025 | Definitions
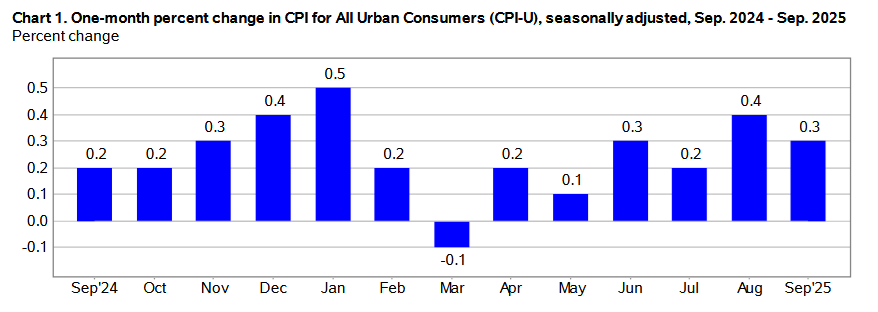
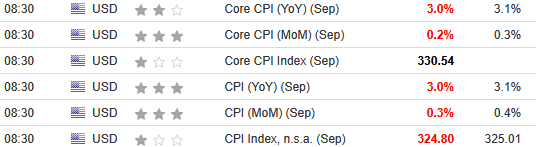
The September 2025 Consumer Price Index of All Urban Consumers (CPI-U) report indicates that inflation increased by 0.3% for the month, down from 0.4% in August. These data were released at 8:30 am EST on October 24, 2025, by the Bureau of Labor Statistics (BLS). Before seasonal adjustment, the year-over-year (Y-o-Y) inflation rate in the all-items index grew by 3.0%, up from 2.9% in August.
The results missed economists’ consensus estimates. The table below is courtesy of Investing.com. The left column represents September’s figures, while the right column represents forecasters’ expectations. As you can see, the red metrics highlight how inflation was cooler than anticipated.
After cutting interest rates in September, Fed Chairman Jerome Powell noted on Oct. 14 that “Some signs have begun to emerge that liquidity conditions are gradually tightening, including a general firming of repo rates along with more noticeable but temporary pressures on selected dates. The Committee’s plans lay out a deliberately cautious approach to avoid the kind of money market strains experienced in September 2019.”
In other words, with the Fed still selling bonds and liquidity declining in money markets, commercial banks have tapped their reserves to help with short-term funding. The issues could result in the Fed ending quantitative tightening on Oct. 29, which would be another dovish development.
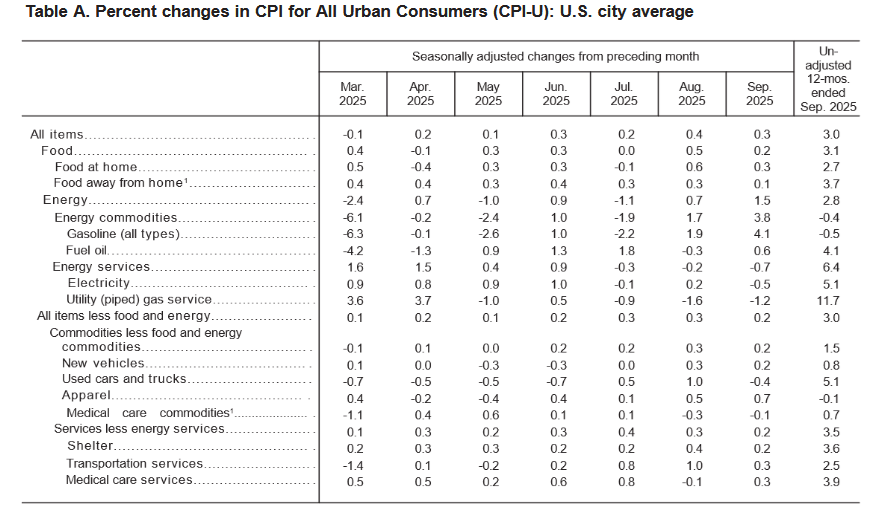
Apparel was the primary outlier in September, rising by 0.7% MoM. Gasoline prices also rose by 4.1% MoM after increasing by 1.9% in August. Core inflation (which excludes the impacts of food and energy), rose by 0.2% in September, slipping from the 0.3% jumps in July and August.
Food Prices
The food index rose by 0.2% MoM in September following a 0.5% rise in August. Four of the six major grocery store food indexes increased, while one was flat, and the other decreased:
- Cereals and bakery products (+0.7%)
- Meats, poultry, fish, and eggs (+0.3%)
- Dairy and related products (-0.5%)
- Fruits and vegetables (+0.0%)
- Nonalcoholic beverages (+0.7%)
- Other food at home (+0.5%)
Surprisingly, the food away from home index rose by 0.1%, which was its lowest reading in several months and signals a slowdown in restaurant inflation.
Energy Prices
The energy index jumped by 1.5% in September following a 0.7% rise in August. Gasoline prices increased by 4.1%, while electricity and natural gas prices fell by 0.5% and 1.2%, respectively.
Core CPI
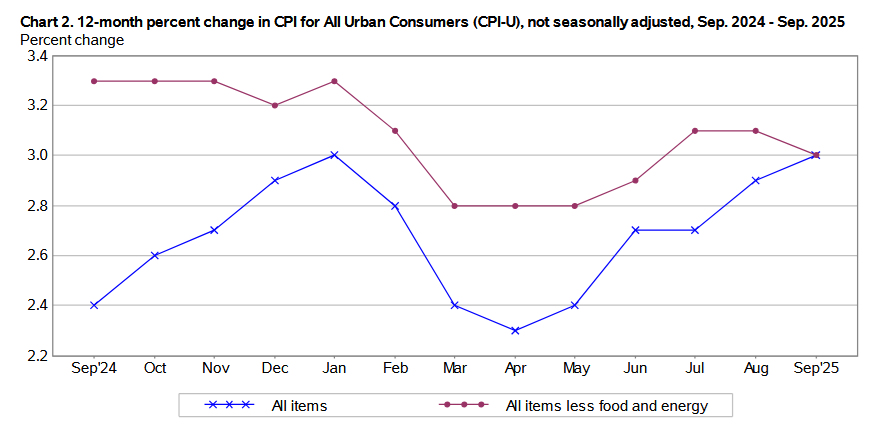
The September core CPI rose by 0.2% month-over-month and 3.0% Y-o-Y. Below is an itemized breakdown of the main price fluctuations seen in the core CPI reading:
- Shelter index: (+0.2%) [August: +0.4%]
- Rent index: (+0.2%) [August: +0.3%]
- Owners’ equivalent rent: (+0.1%) [August: +0.4%]
- Motor vehicle insurance: (-0.4%) [August: +0.0%]
- Medical care services: (+0.3%) [August: -0.1%]
- Physician services: (-0.1%) [August: +0.3%]
- Hospital services: (+0.3%) [August: +0.0%]
- Airline fares: (+2.7%) [August: +5.9%]
Seasonally Unadjusted CPI
Before seasonal adjustments, the CPI-U for September 2025 increased by 3.0% Y-o-Y to an index level of 324.800. Since these figures are unadjusted, they include regular seasonal price fluctuations that can create volatility in the results.
Economic Challenges
While the U.S. government shutdown has paused the release of most public economic data, private sources still indicate a deteriorating outlook.
For example, there has been a recent string of bankruptcies among large subprime auto lenders, as consumers fail to make their loan payments. An Oct. 17 article from The Guardian noted:
“Car owners were found to be missing payments at the highest rate in more than 30 years in January, when a Fitch Ratings index monitoring the share of subprime auto borrowers at least 60 days past due on their loans hit 6.5%.” In addition: “Car repossessions surged to their highest level since 2009 last year, according to Cox, with 1.73m vehicles seized, up 16% from the year prior and 43% from 2022.”
Moreover, the situation is even worse now. And with interest rates still relatively elevated and stress beginning to show in riskier areas of consumer credit, problems in the auto loan market could spread if the economy continues to weaken.
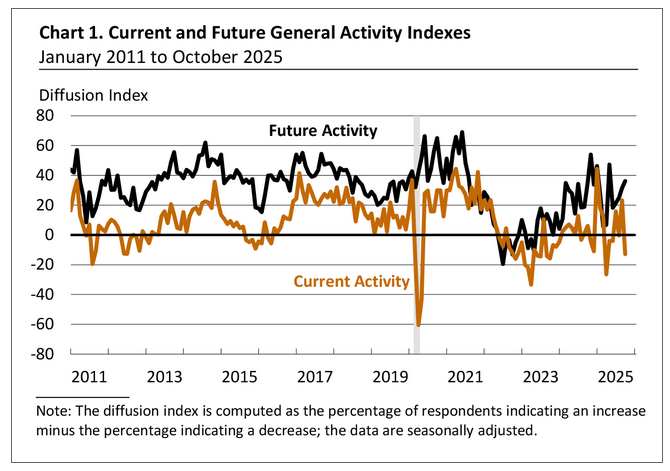
To that point, the Philadelphia Fed released its Manufacturing Business Outlook Survey on Oct. 16. And while sentiment regarding future activity remained positive, “The survey’s index for current general activity fell significantly and turned negative, more than offsetting last month’s increase.”
“The diffusion index for current general activity dropped 36 points to -12.8 in October, its lowest reading since April. Twenty-five percent of the firms reported decreases in general activity this month (up from 17 percent last month), while 12 percent reported increases (down from 40 percent).”
Finally, The Conference Board released its latest Consumer Confidence report on Sep. 30. Stephanie Guichard, Senior Economist, Global Indicators at The Conference Board, said:
“Consumer confidence weakened in September, declining to the lowest level since April 2025. The present situation component registered its largest drop in a year. Consumers’ assessment of business conditions was much less positive than in recent months, while their appraisal of current job availability fell for the ninth straight month to reach a new multiyear low.”
Likewise, “there was a rise in mentions of jobs and employment to a level unseen since August 2024. The comments were mostly negative, especially when referring to the current situation; there were a few positive comments which mostly conveyed hopes that things would get better.”
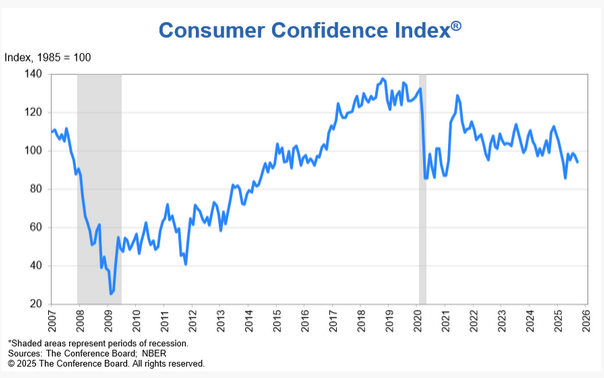
So, while inflation uncertainty has declined somewhat, the second half of the FOMC’s dual mandate — maximum employment — remains challenged, and could dominate if the recent trends persist. Consequently, lower interest rates may be the path of least resistance until the labor market shows more signs of life.
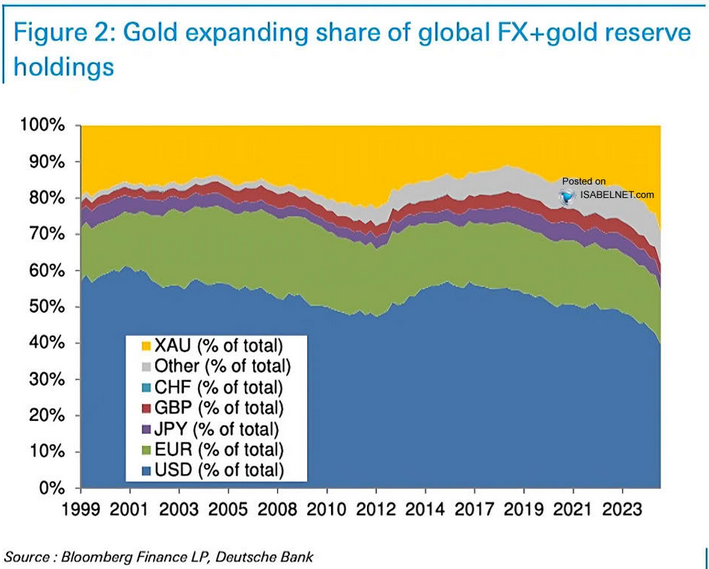
Turning to the financial markets, gold has been on a tear and surpassed $4,000 an ounce. And while volatility has increased, the long-term fundamentals of higher fiscal deficits, inflation, and a weaker U.S. dollar remain in place. Therefore, the theme of global central banks replacing FX reserves with gold should continue for the foreseeable future.
Are you thinking about diversifying into precious metals? Talk to your financial advisor about initiating a gold IRA account today, allowing you to invest in this red-hot asset on a tax-advantaged basis. Additionally, our complimentary CPI inflation calculator remains at your disposal, enabling you to assess inflation’s impact on your finances. Please seek the guidance of a financial advisor before making any investment decision.
Furthermore, if credit concerns have increased alongside the economic uncertainty, there are solutions. TurboDebt is a debt settlement company that negotiates with creditors on your behalf to help lower your financial obligations. The firm focuses on unsecured claims, and you can book a free consultation to determine if the process is right for you.
For tax-related claims, an accredited lawyer can help guide you in the right direction and determine which services fit your needs. Our extensive guide breaks down how the process works and the options available.
Last, if your business is looking for the right financial partner, Grasshopper Bank is a digital institution providing a full suite of products like high-interest savings accounts, low-fee checking accounts, small business administration (SBA) loans, senior secured loans, lines of credit, and other types of commercial loans.
Remember, speaking with a professional ensures the right products are matched with your needs. For more options, please consult our list of debt management firms that can help keep you on track.

by Alex Demolitor | Sep 11, 2025 | Definitions
The August 2025 Consumer Price Index of All Urban Consumers (CPI-U) report indicates that inflation increased by 0.4% for the month, double the 0.2% rise in July. These data were released at 8:30 am EST on September 11, 2025, by the Bureau of Labor Statistics (BLS). Before seasonal adjustment, the year-over-year (Y-o-Y) inflation rate in the all-items index grew by 2.9%, up from 2.7% in July.
The results aligned near economists’ consensus estimates. The table below is courtesy of Investing.com. The left column represents August’s figures, while the right column represents forecasters’ expectations. As you can see, core came in as expected, while the monthly headline figure outperformed.

While Fed Chairman Jerome Powell hinted at a potential rate cut later this month, the FOMC has been cautious in its approach to monetary policy. Rather than encourage another round of inflation by cutting rates prematurely, the committee has prioritized price stability, and today’s results did little to eliminate the concerns.
Used cars and trucks were the primary outliers, with both rising by 1.0% MoM. Gasoline prices also rose by 1.9% MoM after declining by 2.2% in July. Core inflation (which excludes the impacts of food and energy), rose by 0.3% in August, matching the 0.3% from July, and slightly outperforming the 0.2% in June.

Food Prices
The food index rose by 0.5% MoM in August following a flat reading in July. All six major grocery store food indexes increased:
- Cereals and bakery products (+0.1%)
- Meats, poultry, fish, and eggs (+1.0%)
- Dairy and related products (+0.1%)
- Fruits and vegetables (+1.6%)
- Nonalcoholic beverages (+0.6%)
- Other food at home (+0.1%)
Maintaining its momentum, the food away from home index rose by 0.3%, mirroring July, and slightly underperforming the 0.4% increase in June.
Energy Prices
The energy index jumped by 0.7% in August after declining by 1.1% in July. Gasoline prices increased by 1.9%, electricity by 0.2%, while natural gas dropped by 1.6%.
Core CPI
The August core CPI rose by 0.3% month-over-month and 3.1% Y-o-Y. Below is an itemized breakdown of the main price fluctuations seen in the core CPI reading:
- Shelter index: (+0.4%) [July: +0.2%]
- Rent index: (+0.3%) [July: +0.3%]
- Owners’ equivalent rent: (+0.4%) [July: +0.3%]
- Motor vehicle insurance: (+0.0%) [July: +0.1%]
- Medical care services: (-0.1%) [July: +0.8%]
- Physician services: (+0.3%) [July: +0.2%]
- Hospital services: (+0.0%) [July: +0.5%]
- Airline fares: (+5.9%) [July: +4.0%]

Seasonally Unadjusted CPI
Before seasonal adjustments, the CPI-U for August 2025 increased by 2.9% Y-o-Y to an index level of 323.976. Since these figures are unadjusted, they include regular seasonal price fluctuations that can create volatility in the results.
Cuts Coming?
While the U.S. labor market has been weakening for some time, conflicting data had the FOMC preaching patience. However, with several sources converging recently and signaling a slowdown, a September rate cut is likely a done deal.
For example, the BLS released its latest U.S. nonfarm payrolls report on Sep. 5. The economy added 22,000 net new jobs (well below expectations), and the report stated:
“The change in total nonfarm payroll employment for June was revised down by 27,000, from +14,000 to -13,000, and the change for July was revised up by 6,000, from +73,000 to +79,000. With these revisions, employment in June and July combined is 21,000 lower than previously reported.”
Thus, while a 21,000 miscount may not seem like much, the key revelation was that June’s revision to -13,000 was the first net negative print since 2021.

To that point, the BLS reported on Sep. 9 that annual revisions showed the U.S. added 911,000 fewer jobs over the last 12 months than previously reported. An excerpt read:
“The preliminary estimate of the Current Employment Statistics (CES) national benchmark revision to total nonfarm employment for March 2025 is -911,000 (-0.6 percent), the U.S. Bureau of Labor Statistics reported today. The annual benchmark revisions over the last 10 years have an absolute average of 0.2 percent of total nonfarm employment.”
Finally, The Conference Board revealed on Aug. 26 that Americans’ assessment of the labor market continued to deteriorate. Stephanie Guichard, Senior Economist, Global Indicators at The Conference Board, said, “Consumer confidence dipped slightly in August but remained at a level similar to those of the past three months. The present situation and the expectation components both weakened. Notably, consumers’ appraisal of current job availability declined for the eighth consecutive month.”
More importantly, The Conference Board’s ‘labor differential’ metric soared to a new cycle high.

To explain, the gray line above tracks the U.S. unemployment rate, while the red line above tracks the labor differential. When the red line rises, it means that more survey respondents believe that jobs are “hard to get” versus “plentiful.”
Furthermore, with a rising red line often a precursor to a higher unemployment rate, the sharp spike on the right side of the chart should be a cause for concern for the FOMC.
All in all, while inflation uncertainty remains high, the second half of the FOMC’s dual mandate — maximum employment — remains challenged. Therefore, a continuation of the trend should result in more rate cuts in the months ahead.
As the drama unfolds, gold is the clear winner. The yellow metal hit another record high in September, and Goldman Sachs expects more upside in the months and years ahead.

To explain, the blue line above tracks the consolidated gold holdings of global central banks, while the red dashed line above tracks Goldman Sachs’ projection over the next several months.
As you can see, continued demand from the largest buyers should help keep the gold price elevated for the foreseeable future.
Are you thinking about diversifying into precious metals? Talk to your financial advisor about initiating a gold IRA account today, allowing you to invest in this red-hot asset on a tax-advantaged basis. Additionally, our complimentary CPI inflation calculator remains at your disposal, enabling you to assess inflation’s impact on your finances. Please seek the guidance of a financial advisor before making any investment decision.
In addition, if credit concerns have increased alongside the economic uncertainty, there are solutions. American Debt Relief provides debt settlement services, including negotiating with creditors to help eliminate or reduce the monthly payments on your unsecured debts like credit cards, medical bills, and personal loans. Similarly, Money Management International can help lower your interest rates, remove late payment fees, and negotiate lump sum settlements. Services are also available for student loans, bankruptcy, disaster recovery, homebuying, reverse mortgages, and military families.
Last, CreditAssociates can help you become debt-free in as little as 24–36 months. There are no upfront fees, but the group only provides assistance with unsecured debts and some business loans.
Remember, speaking with a professional can help you avoid bankruptcy and protect your credit score. For more options, please consult our list of debt management firms that can help get you back on track.

by Alex Demolitor | Aug 12, 2025 | Definitions
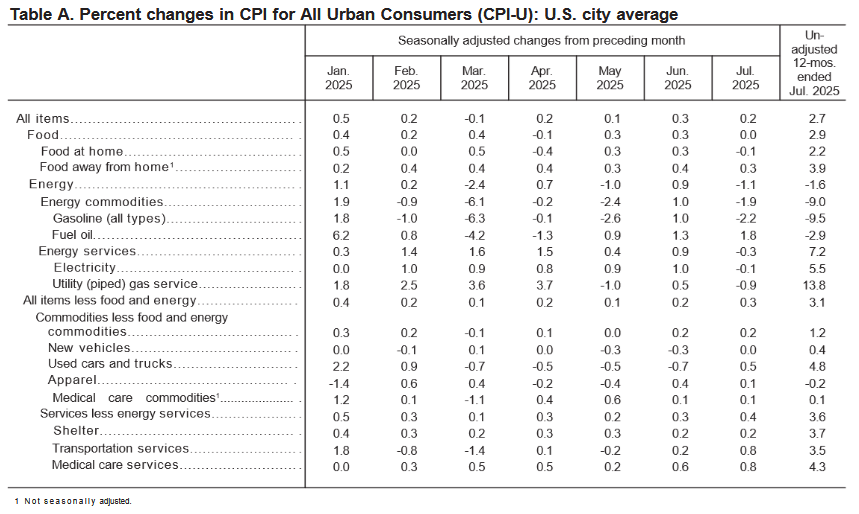
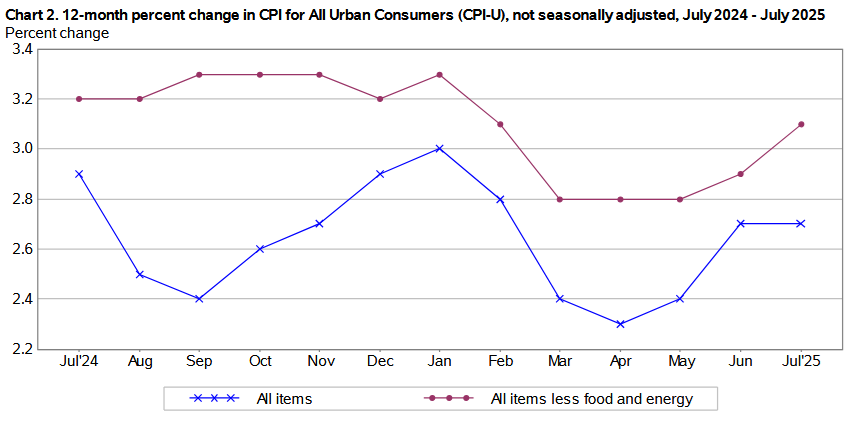
The July 2025 Consumer Price Index of All Urban Consumers (CPI-U) report indicates that inflation increased by 0.2% for the month, slightly below the 0.3% rise in June. These data were released at 8:30 am EST on August 12, 2025, by the Bureau of Labor Statistics. Before seasonal adjustment, the year-over-year (Y-o-Y) inflation rate in the all-items index grew by 2.7%, matching the figure from June.
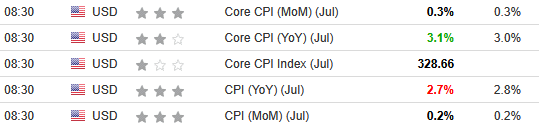
The mixed results aligned near economists’ consensus estimates. The table below is courtesy of Investing.com. The left column represents July’s figures, while the right column represents forecasters’ expectations. As you can see, core inflation outperformed, while headline inflation underperformed.
After the latest FOMC meeting on Jul. 30, Chairman Jerome Powell said during his press conference:
“Higher tariffs have begun to show through more clearly to prices of some goods, but their overall effects on economic activity and inflation remain to be seen. A reasonable base case is that the effects on inflation could be short-lived, reflecting a one-time shift in the price level. But it is also possible that the inflationary effects could instead be more persistent, and that is a risk to be assessed and managed.”
Thus, with today’s inflation results doing little to alleviate those concerns, more data will likely be needed before the FOMC feels comfortable cutting rates.
Transportation and medical care services were noticeable outliers in July, with each rising by 0.8% MoM, while fuel oil jumped by 1.8% MoM despite overall energy prices declining by 1.1% MoM. Core inflation (which excludes the impacts of food and energy), rose by 0.3% in July, up from 0.2% in June and 0.1% in May.
Food Prices
The food index was flat in July after rising by 0.3% MoM in June and May. Two of the six major grocery store food indexes increased, one was flat, and the other three realized deflation:
- Cereals and bakery products (-0.2%)
- Meats, poultry, fish, and eggs (+0.2%)
- Dairy and related products (+0.7%)
- Fruits and vegetables (+0.0%)
- Nonalcoholic beverages (-0.5%)
- Other food at home (-0.5%)
Maintaining its momentum, the food away from home index rose by 0.3%, as restaurant prices continue to outperform grocery store products.
Energy Prices
The energy index decreased by 1.1% in July after rising by 0.9% in June. Gasoline prices fell by 2.2%, natural gas by 0.9%, and electricity by 0.1%.
Core CPI
The July core CPI rose by 0.3% month-over-month and 3.1% Y-o-Y. Below is an itemized breakdown of the main price fluctuations seen in the core CPI reading:
- Shelter index: (+0.2%) [June: +0.2%]
- Rent index: (+0.3%) [June: +0.2%]
- Owners’ equivalent rent: (+0.3%) [June: +0.3%]
- Motor vehicle insurance: (+0.1%) [June: +0.1%]
- Medical care services: (+0.8%) [June: +0.6%]
- Physician services: (+0.2%) [June: +0.2%]
- Hospital services: (+0.5%) [June: +0.7%]
- Airline fares: (+4.0%) [June: -0.1%]
Seasonally Unadjusted CPI
Before seasonal adjustments, the CPI-U for July 2025 increased by 2.7% Y-o-Y to an index level of 323.048. Since these figures are unadjusted, they include regular seasonal price fluctuations that can create volatility in the results.
Tough Job Ahead?
The on-again, off-again, relationship with rate cuts continues to play out, as surprising labor market revisions confirmed the lingering weakness present in private data sources.
For example, U.S. job openings have declined, and ADP recently reported a net loss in its monthly private payrolls. However, the data was largely ignored because U.S. nonfarm payrolls — sourced from the Bureau of Labor Statistics (BLS) — continued to show solid growth and healthy hiring. But, that all changed on Aug. 1. The report stated:
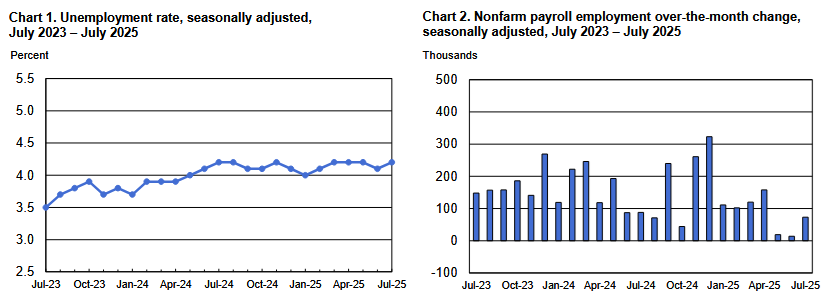
“Revisions for May and June were larger than normal. The change in total nonfarm payroll employment for May was revised down by 125,000, from +144,000 to +19,000, and the change for June was revised down by 133,000, from +147,000 to +14,000. With these revisions, employment in May and June combined is 258,000 lower than previously reported.”
Thus, while the unemployment rate held steady near 4.2%, the blue bars furthest to the right of the second chart below show how the pace of employment growth has declined significantly over the last few months.
Moreover, the massive downward revisions further complicate the FOMC’s already tough balancing act between taming inflation and maintaining maximum employment.
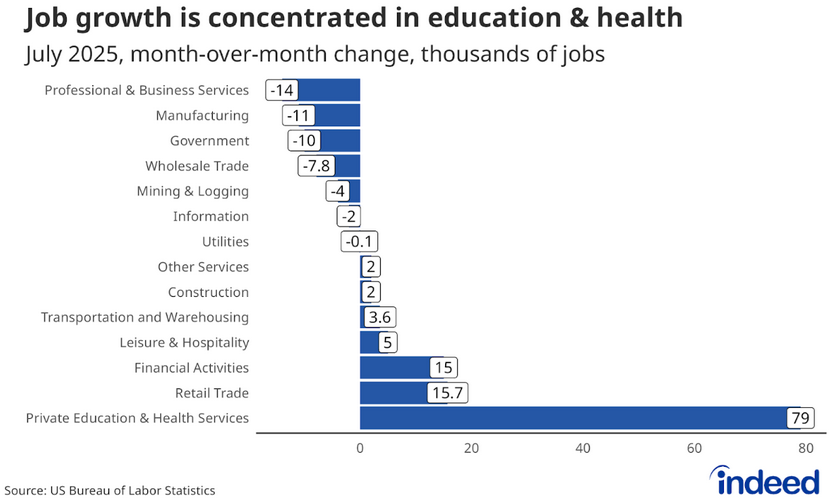
To that point, Indeed noted on Aug. 1 that the composition of hiring in July was equally troubling. An excerpt read:
“The sectoral breakdown from the jobs report is especially striking, with private education and health services adding 79,000 jobs, while other sectors, including professional and business services, manufacturing, and government, lost more than 10,000 jobs each. While the healthcare and social assistance sub-sector accounts for just 14.6% of total jobs in the economy, 48.8% of all employment growth in the US has occurred in this sub-sector over the past year….
“The increasing concentration of jobs in certain sectors and an outright contraction of jobs in many others does not bode well for the market going forward.”
So, while the FOMC’s latest Summary of Economic Projections has market participants expecting two rate cuts before the end of 2025, Vice Chair of Supervision, Michelle Bowman, advocated for three interest rate reductions on Aug. 9 to act as a hedge “against the risk of a further erosion in labor market conditions and a further weakening in economic activity.” Yet, other committee members prefer a wait-and-see approach, and there is plenty of division among the group.
All in all, there is so much volatility in the data that one month’s sunshine becomes next month’s storm. And with tariff uncertainty still lingering, FOMC members may struggle to form a clear consensus in the months ahead.
In contrast, the economic tension is bullish for gold, with the yellow metal hitting a new record high in August — surpassing $3,500 — and the long-term momentum remains intact.
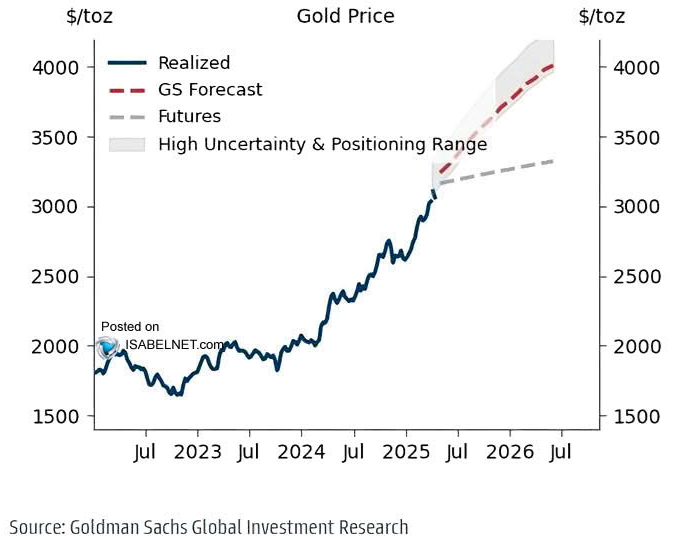
To explain, Goldman Sachs still expects gold to hit $4,000 by mid-2026. The investment bank’s latest analysis (the dashed red line) is well ahead of what’s priced into the futures market (the dashed gray line), which means there’s still room for traders to shift their expectations upwards.
Are you thinking about diversifying into precious metals? Talk to your financial advisor about initiating a gold IRA account today, allowing you to invest in this red-hot asset on a tax-advantaged basis. Additionally, our complimentary CPI inflation calculator remains at your disposal, enabling you to assess inflation’s impact on your finances. Please seek the guidance of a financial advisor before making any investment decision.
In addition, if credit concerns have increased alongside the economic uncertainty, there are solutions. Americor helps individuals and families with debt settlement, credit counseling, and provides consolidation loans by converting high-interest debt into products with lower interest rates and more manageable monthly payments.
Likewise, National Debt Relief offers advice, counselling, and negotiates with unsecured creditors to reduce your outstanding balance. It’s also a member of the American Fair Credit Council (AFCC) and the International Association of Professional Debt Arbitrators (IAPDA).
Finally, Trinity Debt Management is a nonprofit Christian group that delivers similar debt relief services and may be well-suited for Americans seeking faith-based advice and solutions.
Remember, speaking with a professional can help you avoid bankruptcy and protect your credit score. For more options, please consult our list of debt management firms that can help get you back on track.