by Andrew | May 5, 2015 | Definitions

Financial commentary and analysis is usually heavily peppered with “since Lehman” or “Post-Lehman” comparison statistics and conjecture. 2008 were some of the darkest days ever for financial markets; the losses worldwide were truly staggering and we are still wrestling with the consequences of this epic event to this day.
The world has changed a great deal since Lehman closed its doors – the financial world in particular has changed. The policy response from governments and monetary authorities around the world were amongst the most aggressive monetary policy moves of the modern era. As a result, we are now living in the midst of a giant financial experiment with all the theories, uncertainty, fear, greed and hope associated with finance jostling for equilibrium.
The Federal Reserve and other central banks throughout the world have been engaged in loose monetary policy, quantitative easing, ZIRP, and NIRP without issue despite the dire warnings of opponents who see the surge in the money supply as the precursor to rampant inflation and a hyperinflationary currency collapse. These fears for the most part have not transpired. Inflation has remained subdued through this period, and a lot of head scratching has ensued.
We are in uncharted territory, but there can be no argument about some of the major economic themes that have transpired “Post-Lehman” – the most astounding of which has been a complete collapse in the velocity of money throughout the economy. This metric above all others, helps explain why the expansionary monetary policy regimes throughout the world have managed to avoid triggering bouts of high inflation. The low velocity of money statistics also reveal just how fractured the economic recovery has been in the United States – where the exuberant valuation levels of financial markets are not borne out by developments in the real economy.
What is the velocity of money?
The velocity of money refers to how fast money circulates within the economy from one person to the next. Velocity of money is an important tool for gauging the rate at which money within the economy is used for purchasing goods and services. Analysts will often take the velocity of money as part of their consideration when determining how well the overall economy is performing. A high velocity of money indicates an active economy, and by consequence, is likely performing well. A low velocity of money will usually cause alarm bells to start ringing for economists. Low velocity of money is usually the precursor of slower growth and the onset of deflationary conditions.
Another element we need to take into consideration is the overall money supply of the economy. The money supply has many different measures, but economists usually narrow these down into two distinct measures known as M1 and M2.
The M1 definition refers to the most liquid assets in the economy, namely cash and checking deposits. M2 broadens the definition of the money supply by also including “near cash” assets such as savings deposits, time deposits, and other money market mutual funds which can be converted into cash relatively quickly.
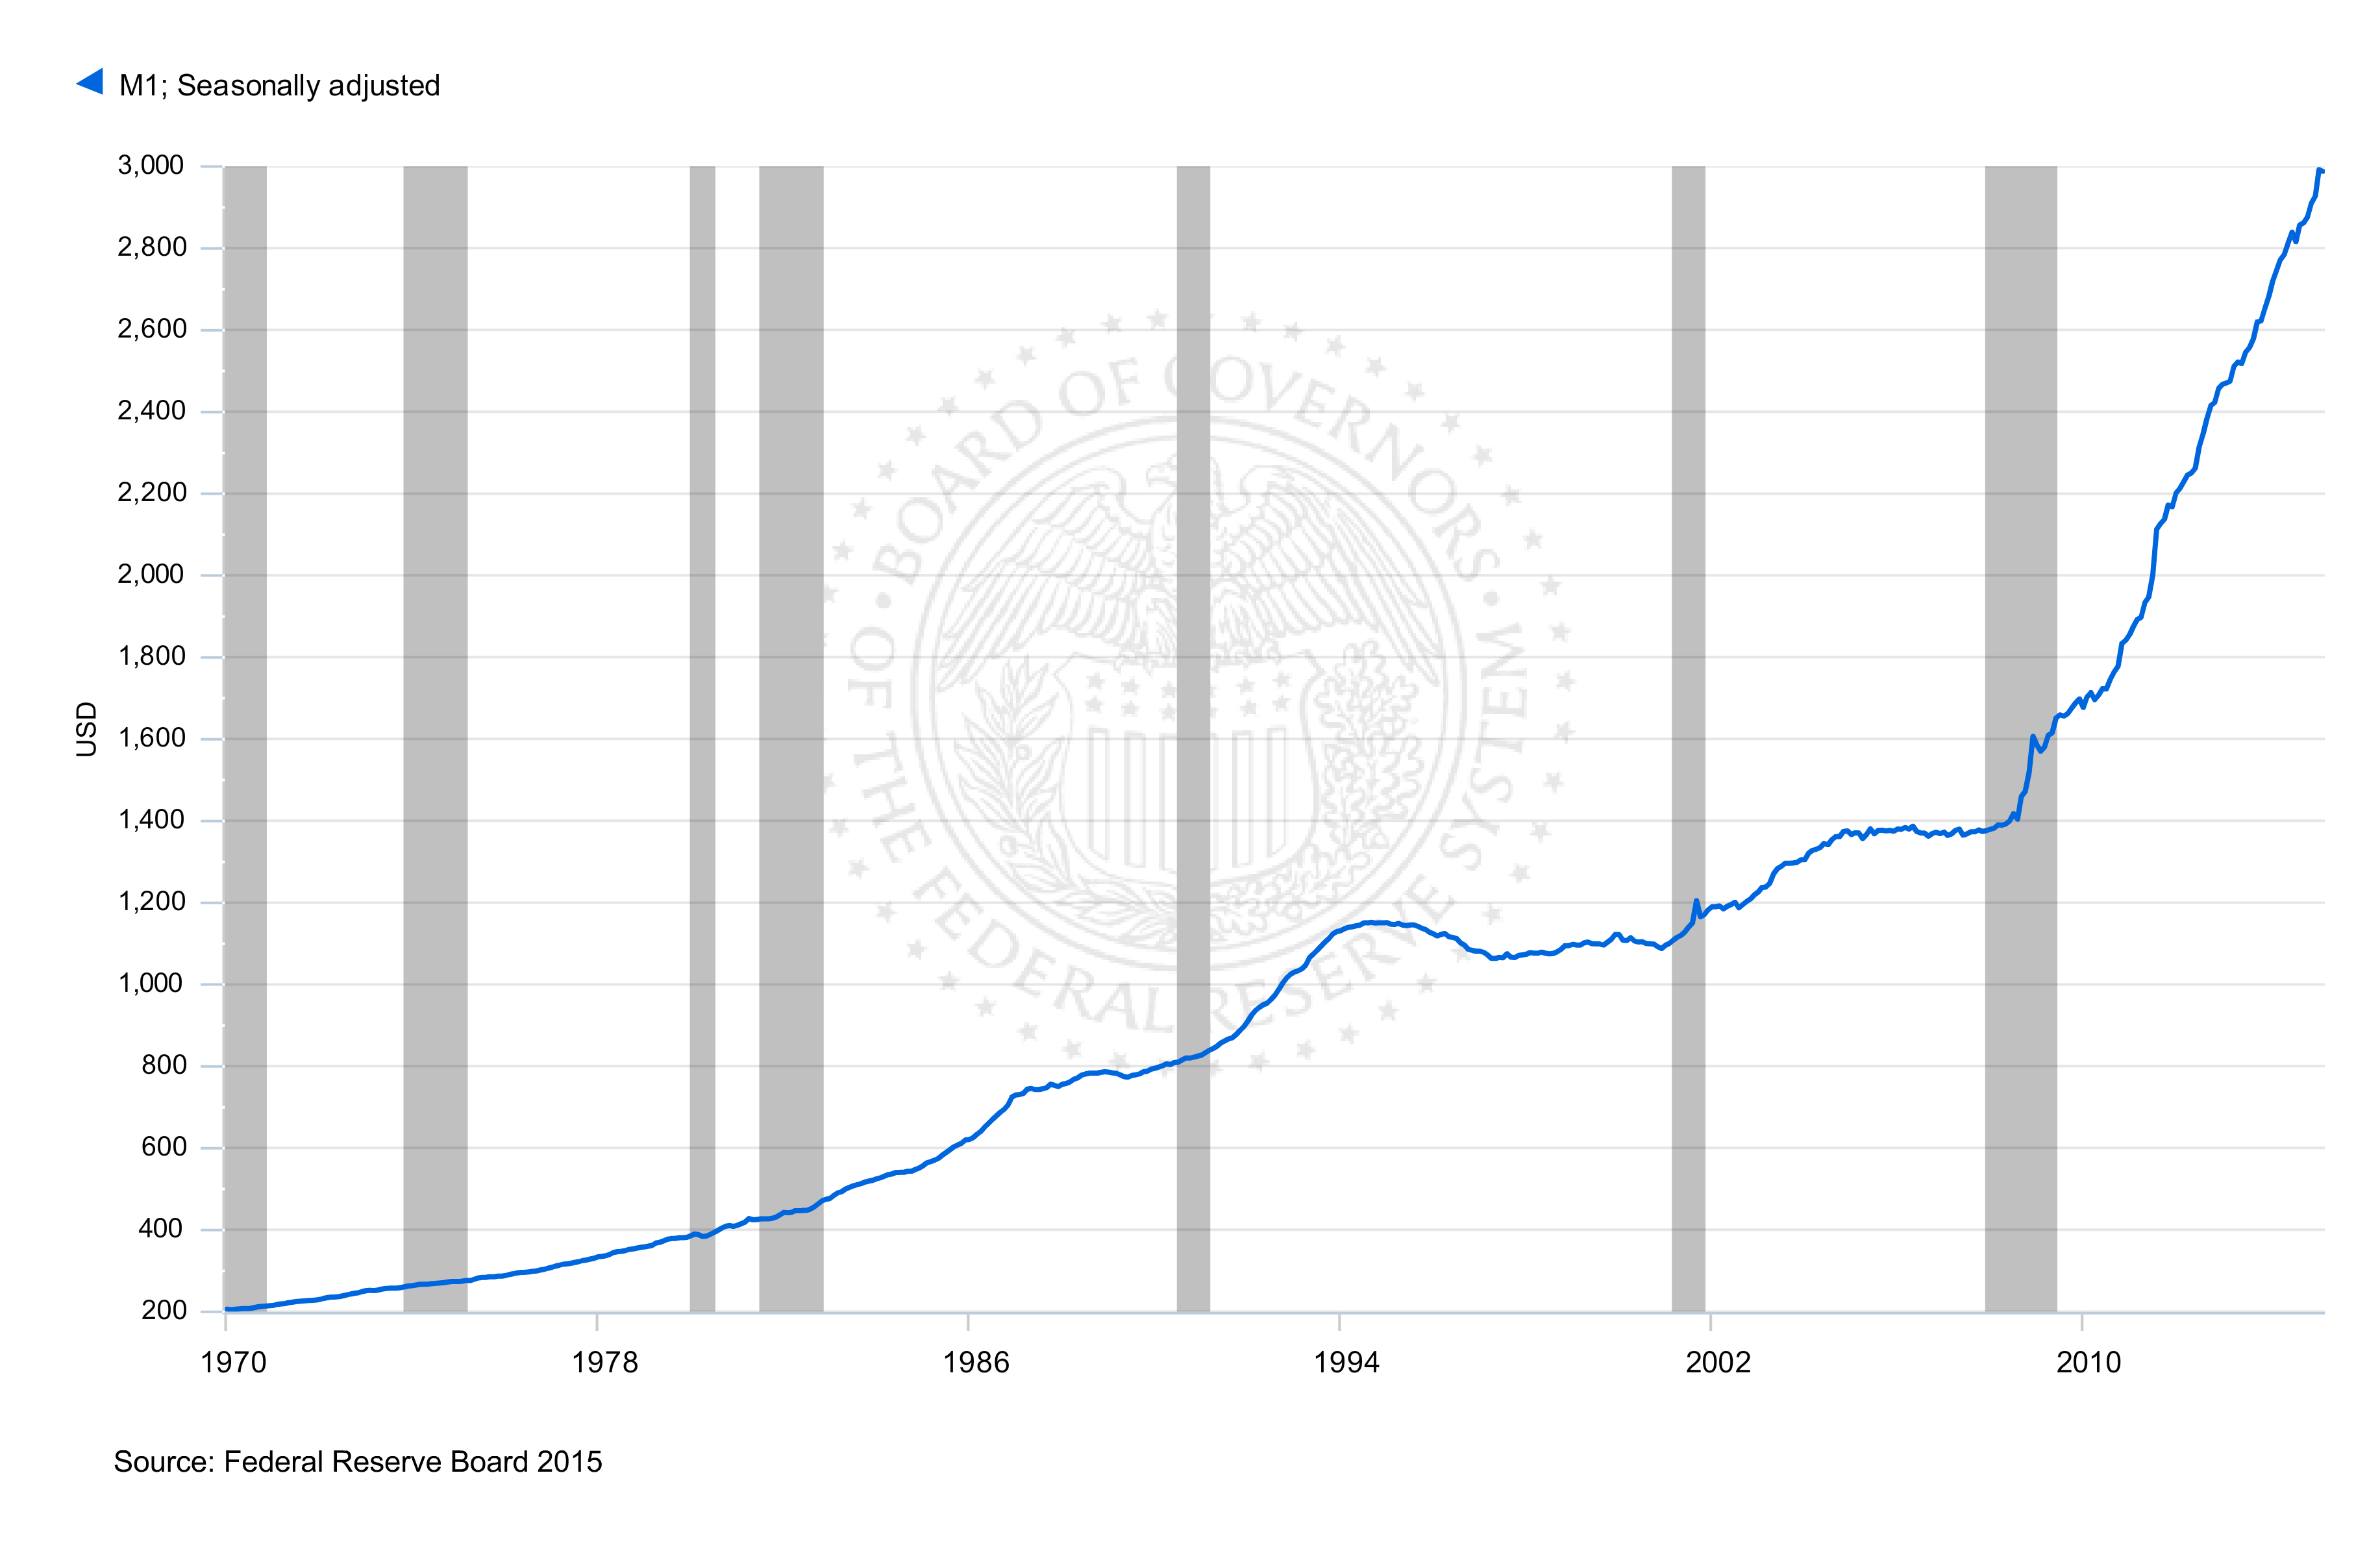
How much has money supply increased since the start of QE?
As a consequence of the Federal Reserve’s QE program, the money supply of the United States as measured by M1 has increased by over 100% since September 2008. Increasing the money supply on this scale has never occurred before – the exponential nature of the M1 chart illustrates this well.
Despite the dramatic increase in the overall money supply – we are still concerned about deflationary pressures within the economy. So what has been happening with all of this extra money? Banks for the large part, have been hoarding this cash as excess reserves within the system. The transmission mechanism through credit growth has been sluggish at best – and therefore the velocity of money has been crashing.
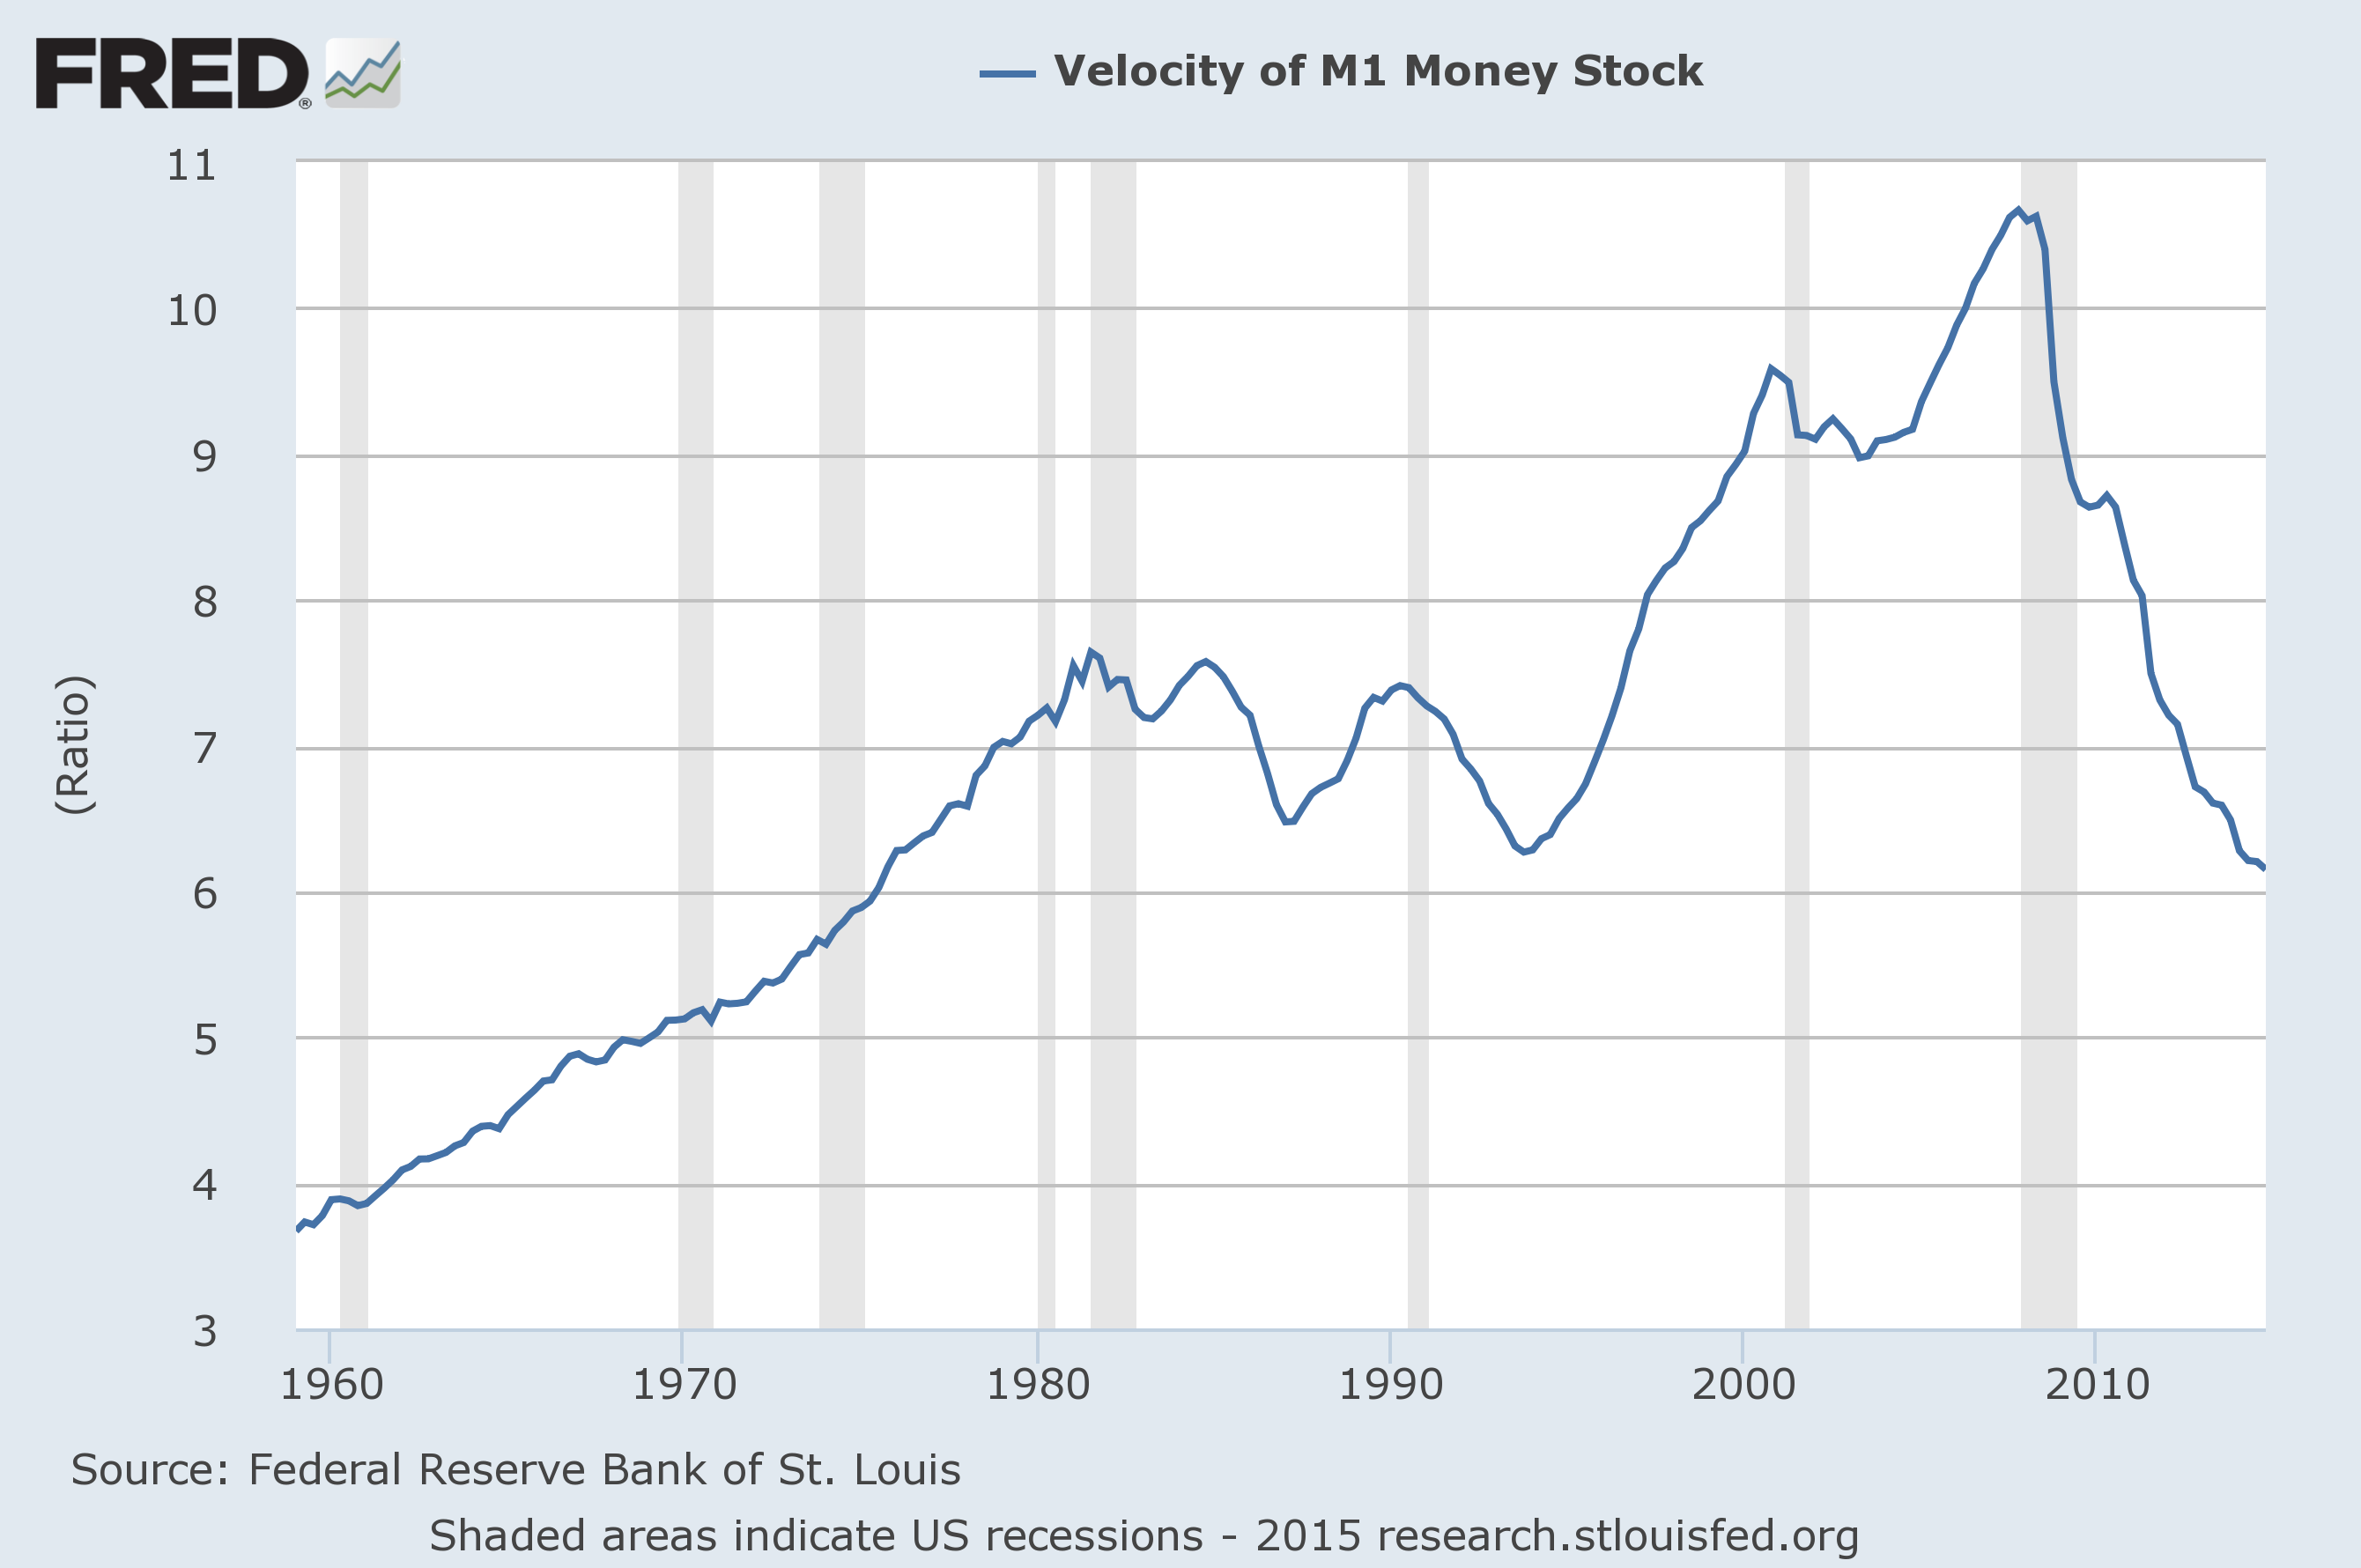
The Velocity of Money has been in freefall since 2008
The velocity of money has crashed “Post-Lehman” – the chart below shows by just how much! The implications of this are obvious. Money has been tied up in the financial sector – banks have been unwilling to lend to the “real sector” and the recovery has been going at a snail’s pace as a consequence. Financial markets by contrast, have been soaring with various markets around the word frequently taking out all time highs.
What happens next?
Looking forward from our current position is difficult. On one hand, the deflationary pressures weighing down the economy are still at large but the massive increase in the money supply has the potential to stoke serious inflationary pressures going forward. Central bank around the world have all squeezed the toothpaste tube and the contents are out. The next chapter in the “Post-Lehman” story will undoubtedly be dominated by how to get the money supply genie back into the bottle. Time will tell.
by Andrew | Apr 20, 2015 | Definitions
Official March inflation data from the BLS was a mixed bag with headline CPI continuing to remain under pressure, but a significant rise in Core CPI ex Food and Energy was enough to trigger knee jerk uncertainty about the outlook for the Fed’s immediate interest rate policy. A weak session across all markets following the release of the data suggests market participants are viewing the recent uptick in prices as a signal for rates to rise quicker than expected.
The Deflationary Camp
On one side, the deflationary environment shows no sign of easing up, with headline CPI coming in weaker than expected – consumer prices rose a modest 0.2% from February versus a consensus call for a 0.3% increase. CPI YoY fell to -0.1%, the third successive monthly decrease. Double digit falls in energy prices YoY continue to keep a lid on consumer prices for the time being with Energy (-18% YoY) and Gasoline in particular (-29% YoY). Food prices fell -0.2% for the first time in six month providing further relief to the consumer.
In a worrying sign for business activity and sentiment going forward, the index for airline fares declined for the fourth time in the last 5 months and there seems to be growing evidence of discounting taking place in the business travel segment across the board.
Core CPI Remains Stubbornly High
On the flip side, Core CPI excluding Food and Energy continues to print at elevated levels, rising to 1.8% YoY versus consensus expectations of 1.7% YoY. Increased Housing (+0.3% MoM, 3% YoY) and Health Care costs (0.4% MoM, 1.9% YoY) were the main contributors. The recent stability in Crude and Energy prices could see Core CPI remain on the high side for the next few months and the market is likely to start paying more attention to energy prices going forward to try and gauge potential sentiment within the Fed.
Wages
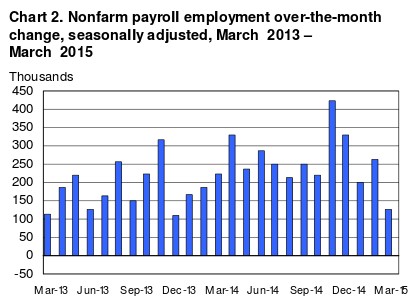
Real average hourly earnings for all employees increased 0.1 percent from February to March with 0.3-percent increase in average hourly earnings just shading the 0.2% increase in CPI. The NFP numbers for the past few months are likely to give the Fed further room to pause – NFP has been on the slide every month since December 2014, and with the potential for increased layoffs coming from the oil, gas, and shale sectors the unemployment numbers might show increasing stress in the coming months.
Market Reaction
Equity markets were a sea of red all day Friday, as a perfect storm of higher than expected Core CPI, increased volatility in China and wider Asian markets, and ongoing drama with Greece triggered a bout of selling from investors trying to reduce exposure going into the weekend.
Selected Market Performances
S&P500 -1.13%
DJIA -1.54%
WTI Crude -1.71%
EURUSD +0.43%
Outlook Going Forward
Rising Core CPI will be a concern for markets, but with increased volatility within China and Emerging Asia equity markets, and heightened geopolitical tensions it appears too early to assume any imminent rate hike from the Fed – if anything these pressures are likely to keep the Fed on hold for the time being in order to get more clarity on world events. Consumer prices continue to remain subdued and policy makers are likely to want to see a pick up on this side before jumping into action.
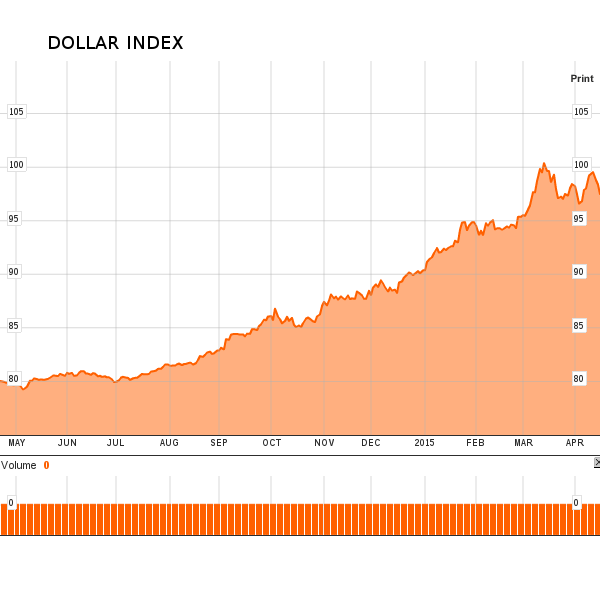
The dollar will continue to act as proxy for rates in the meantime, and we expect the currency to remain well bid against its major competitors for as long as the current standoff from the Fed continues to playout. The Gold market has been steady all month with the yellow metal hovering around the $1200 mark in fairly tight trading bands. With the ZIRP, and increasingly NIRP world in which we live, the Gold market might still have a role to play this year.
by Andrew | Mar 6, 2015 | BLS, CPI, Inflation
Inflation is one of the most important economic indicators for everyone, especially for investors, businesses, retirees, and policymakers. It affects the cost of groceries, rent, mortgage rates, wages, savings accounts, bond yields, retirement planning, and even the way the Federal Reserve thinks about interest rates.
But here is the part many people miss: there is not just one way to measure inflation.
On this site, we focus heavily on the CPI inflation calculator because the Consumer Price Index is one of the most widely recognized inflation measures in the United States. But CPI is only one part of the bigger picture. Economists, investors, journalists, and the Federal Reserve also look at PPI, PCE, Core CPI, Core PCE, Chained CPI, wage growth, commodity prices, and other indicators.
I have been writing about financial and investment-related topics for more than two decades, and one lesson I have learned is that inflation data can tell different stories depending on the measure you use. That does not mean one number is “fake” and another is “real.” It means each measure has a different purpose, a different method, and a different weakness.
Quick Answer: What Is the Best Way to Measure Inflation?
Honestly, there is no single perfect inflation measure. CPI is useful for understanding consumer price changes. PCE is closely watched by the Federal Reserve. PPI can show price pressure before it reaches consumers. Core inflation strips out volatile food and energy prices. The best approach is to understand what each measure is designed to show, then use them together.
The Bureau of Labor Statistics describes CPI as a measure of the average change over time in prices paid by urban consumers for a representative basket of consumer goods and services. The Bureau of Economic Analysis says the PCE Price Index captures inflation or deflation across a wide range of consumer expenses and reflects changes in consumer behavior. The Federal Reserve’s 2% longer-run inflation goal is measured using the annual change in the PCE Price Index, not CPI.
Why Inflation Is Measured in Different Ways
Inflation sounds simple: prices go up, and money buys less. But measuring inflation across a large, complex economy is not simple at all.
Different people spend money differently. A retiree, a renter, a homeowner, a student, a family with young children, and a small business owner may all experience inflation in very different ways. One person may feel food inflation most. Another may feel rent, insurance, healthcare, or gasoline more sharply.
That is why different inflation measures exist. Each one answers a slightly different question.
| Inflation Measure |
What It Measures |
Why It Matters |
| CPI |
Prices paid by urban consumers for a basket of goods and services. |
Commonly used by consumers, media, contracts, and inflation calculators. |
| PPI |
Prices received by domestic producers for goods and services. |
Can show inflation pressure before it reaches consumers. |
| PCE |
Prices paid for goods and services consumed by people in the U.S. |
The Federal Reserve’s preferred inflation measure. |
| Core CPI / Core PCE |
Inflation excluding food and energy. |
Helps show underlying inflation trends without the noisiest categories. |
| Chained CPI |
Consumer inflation adjusted for substitution behavior. |
Can reflect how consumers change purchases when prices shift. |
| Alternative indicators |
Gold, commodities, wages, rents, market expectations, and private estimates. |
Can provide context, but should not replace official inflation data. |
Official Government Inflation Measures: CPI and PPI
The Bureau of Labor Statistics has the difficult job of collecting and publishing several major U.S. inflation measures. Two of the most widely followed are the Consumer Price Index and the Producer Price Index.
Consumer Price Index: CPI
The Consumer Price Index, or CPI, measures the average change over time in prices paid by consumers for a representative basket of goods and services. It is probably the inflation measure most people recognize because it appears in news headlines, wage discussions, cost-of-living adjustments, and many personal finance calculations.
The CPI includes major categories such as food, housing, apparel, transportation, medical care, recreation, education, and other goods and services. If you want a deeper explanation of the method, we have a guide on what the Consumer Price Index is and how it is calculated.
One reason CPI matters so much is that it gives consumers a practical way to understand changes in purchasing power. When CPI rises, the same dollar generally buys less than it did before. You can see this clearly by comparing historical prices with our historical CPI tables.
The image above shows why the CPI is sometimes described as a “basket of goods” measure. In simple terms, the BLS tracks a representative mix of consumer spending categories and uses that basket to estimate how prices are changing over time. You can read more about this concept in our guide to what a basket of goods means.
Best use of CPI: CPI is useful when you want to understand consumer-facing inflation, cost-of-living changes, or how much purchasing power has changed over time.
Producer Price Index: PPI
The Producer Price Index, or PPI, measures price changes from the producer side of the economy. According to the BLS, PPI measures the average change over time in selling prices received by domestic producers for goods and services.
PPI matters because producer prices can sometimes move before consumer prices. If businesses pay more for raw materials, labor, energy, shipping, or wholesale goods, those higher costs may eventually show up in consumer prices.
That does not always happen immediately. Some companies absorb higher costs to stay competitive. Others pass costs on quickly. The result depends on demand, competition, pricing power, profit margins, and the broader economy.
Still, PPI is worth watching because it can provide an early signal of inflation pressure inside the production pipeline.
Best use of PPI: PPI is useful when you want to understand inflation pressure before it fully reaches consumers. It can be especially helpful for investors, business owners, and analysts watching supply chains and profit margins.
PCE Inflation: The Fed’s Preferred Measure
The Personal Consumption Expenditures Price Index, usually called the PCE Price Index, is another major inflation measure. It is produced by the Bureau of Economic Analysis rather than the Bureau of Labor Statistics.
PCE is especially important because it is the Federal Reserve’s preferred inflation measure. The Federal Reserve says it seeks inflation of 2% over the longer run as measured by the annual change in the PCE Price Index.
One reason economists like PCE is that it can better reflect changes in consumer behavior. For example, if beef prices rise sharply and consumers buy more chicken instead, PCE is designed to capture this kind of substitution more flexibly than traditional CPI.
PCE also covers a broader range of expenditures, including some purchases made on behalf of consumers, such as certain healthcare costs paid by employers or government programs.
| CPI |
PCE |
| Produced by the Bureau of Labor Statistics. |
Produced by the Bureau of Economic Analysis. |
| Focuses on out-of-pocket prices paid by urban consumers. |
Covers a broader range of consumption expenditures. |
| Often used in media, contracts, calculators, and cost-of-living discussions. |
Preferred by the Federal Reserve for its inflation target. |
| May show a different inflation rate than PCE. |
Can better reflect substitution and changing spending patterns. |
For everyday consumers, CPI is often easier to understand. For monetary policy, PCE is often more important. If you are trying to understand what the Fed may do with interest rates, you should pay attention to PCE and Core PCE as well as CPI.
Core Inflation: Why Food and Energy Are Often Excluded
Core inflation usually refers to inflation excluding food and energy. At first, this can sound strange. Food and energy are not optional for most households. Anyone who buys groceries or fills up a car knows these prices matter.
So why exclude them?
The reason is not that food and energy are unimportant. The reason is that food and energy prices can swing sharply from month to month because of weather, wars, supply disruptions, seasonal changes, oil markets, and other temporary shocks. By removing those categories, economists try to get a cleaner view of the underlying inflation trend.
Core CPI and Core PCE are both widely watched. The BEA notes that Core PCE, which excludes food and energy, is closely watched by the Federal Reserve as it conducts monetary policy.
In my view, consumers should look at both headline and core inflation. Headline inflation shows what people are actually paying across the full basket. Core inflation helps show whether inflation pressure is becoming more deeply embedded in the economy.
How to Think About Headline vs. Core Inflation
- Headline inflation includes food and energy, so it can better reflect what households feel month to month.
- Core inflation excludes food and energy, so it may better reflect the underlying trend.
- Both matter because consumers live with headline inflation, while policymakers often focus closely on core inflation.
Chained CPI: Measuring Substitution Behavior
Chained CPI is another inflation measure that tries to account for changes in consumer behavior. When prices rise, people often substitute cheaper products for more expensive ones. For example, if one type of meat becomes much more expensive, a household might buy a different protein instead.
Traditional CPI measures price changes based on a basket of goods and services. Chained CPI adjusts more directly for the way consumers shift spending when relative prices change.
This can make Chained CPI grow more slowly than traditional CPI in some periods. Supporters argue that it reflects real consumer behavior more accurately. Critics argue that it may understate the pressure felt by households that cannot easily substitute away from rising costs like rent, healthcare, insurance, or utilities.
That is a key theme across inflation measurement: every method has tradeoffs.
Median CPI and Trimmed Mean Inflation
Some economists use inflation measures that remove extreme price movements, not just food and energy. Two examples are Median CPI and trimmed mean inflation.
The idea is simple. In any given month, a few categories can jump or fall dramatically. Those outliers can distort the headline number. Median and trimmed mean measures try to show the middle of the inflation distribution by reducing the influence of extreme categories.
The Federal Reserve Bank of Cleveland has also explained how CPI and PCE differ, including why the Fed’s preferred measure is PCE. Regional Federal Reserve banks often publish useful inflation research, including measures such as median CPI and trimmed mean inflation.
These measures are more technical, but they can be helpful when headline inflation is being distorted by one-time spikes in categories like energy, used cars, airline fares, or shelter.
Wage Inflation and Labor Costs
Inflation is not only about consumer prices. Wages and labor costs also matter.
If wages rise faster than productivity, businesses may raise prices to protect margins. On the other hand, if consumer prices rise faster than wages, households lose purchasing power. That is why wage growth and inflation are often discussed together.
For consumers, the practical question is simple: is your income rising faster than your cost of living?
A 4% raise does not feel like a raise if your personal cost of living rises 6%. This is one reason many households can feel financially squeezed even when the official economy looks stable.
To understand why inflation affects households so differently, it helps to read our guide on how CPI affects inflation.
Commodity Prices, Gold, and Market-Based Inflation Signals
Some investors also watch commodity prices, including oil, copper, agricultural products, and gold, for clues about inflation. These indicators can be useful, but they need to be handled carefully.
Gold has historically been seen by many investors as a store of value and a hedge against currency weakness, inflation risk, and financial stress. When investors lose confidence in paper currencies, central banks, or the broader financial system, gold may attract more attention.
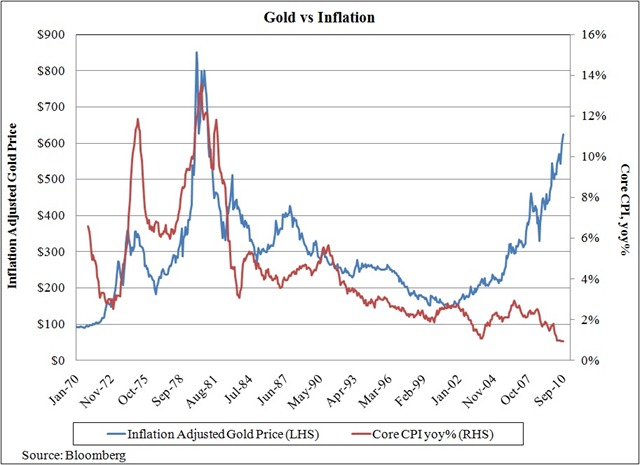
The chart above reflects the older version of this article’s discussion around gold and inflation. I still think gold is worth watching, but I would not treat it as a clean inflation measure. Gold prices can be influenced by real interest rates, the U.S. dollar, central bank buying, geopolitical risk, investor fear, and long-term demand for hard assets.
That means gold can provide useful context, but it should not replace CPI, PCE, or other official inflation data. If you are interested in that topic, we have a dedicated article on whether gold is a good inflation hedge, as well as an inflation-adjusted gold return calculator.
Investor note: Gold, oil, copper, and other commodities can provide signals about inflation pressure, but they also react to many non-inflation factors. I view them as context, not replacements for official inflation indexes.
Private and Alternative Inflation Estimates
Some investors and analysts are skeptical of official inflation statistics and prefer to track alternative estimates. This skepticism has existed for a long time, especially among people who believe CPI does not fully capture the cost pressures they feel in daily life.
I understand the frustration. Official inflation data can feel disconnected from your household experience if your rent, insurance, groceries, or healthcare costs are rising faster than the national average.
At the same time, I would be careful about treating private inflation estimates as automatically more accurate. Official statistics have limitations, but they also use transparent methodologies, large datasets, and long historical series. Private estimates can be useful as a second opinion, but they may also use assumptions that produce very different results.
The better approach is not to rely blindly on any single number. Look at multiple indicators and understand what each one is measuring.
Why Your Personal Inflation Rate May Differ From CPI
One of the most important points in this article is that the official inflation rate may not match your personal inflation rate.
CPI is based on average spending patterns. But your household is not average. Your budget might be heavily weighted toward rent, childcare, gasoline, insurance, healthcare, or food. If those categories rise faster than the overall CPI, your personal inflation rate may feel much higher.
| Household Type |
Inflation They May Feel Most |
| Renter |
Rent increases, utilities, insurance, transportation. |
| Homeowner |
Property taxes, insurance, repairs, maintenance, utilities. |
| Retiree |
Healthcare, food, insurance, utilities, fixed-income pressure. |
| Commuter |
Gasoline, auto insurance, repairs, financing costs. |
| Family with children |
Food, childcare, housing, education, clothing, medical costs. |
This is why I usually recommend looking at both official inflation and your own budget. The CPI tells you what is happening broadly. Your bank statement tells you what is happening personally.
How Investors Can Use Different Inflation Measures
Investors should pay attention to inflation because it affects interest rates, bond yields, stock valuations, commodity prices, real estate, cash returns, and retirement planning.
For example:
- CPI helps investors understand consumer-facing inflation and purchasing power.
- PPI can show cost pressure on companies before it reaches consumers.
- PCE matters because the Fed uses it for its inflation target.
- Core inflation helps show whether inflation pressure is broad and persistent.
- Commodity prices can offer market-based clues, especially around energy and materials.
- Wage growth can show whether consumers are keeping up with price increases.
If you are building a portfolio, inflation matters because what counts is your real return, not just your nominal return. A 5% investment return looks good until inflation is 4%. In that case, your real return before taxes is only about 1%.
For more on that topic, read our guide to investing during inflation and deflation or our article on inflation-resistant investment ideas.
How Consumers Can Use Inflation Data
You do not need to be an economist to use inflation data. For regular households, inflation data can help with budgeting, wage negotiations, retirement planning, debt decisions, and savings goals.
Here are a few practical ways to use it:
- Use CPI to understand how prices have changed over time.
- Compare your wage growth with inflation to see whether your real income is rising.
- Review your savings rate against inflation to understand your real return.
- Use inflation assumptions when estimating future retirement expenses.
- Watch PCE and Core PCE if you are trying to understand the Federal Reserve’s likely policy direction.
- Track CPI release dates using our CPI release schedule.
Inflation can also connect to broader economic cycles. If you want to understand the relationship between inflation, slowdowns, and contractions, read our explainer on inflation vs. recession vs. depression.
Which Inflation Measure Should You Trust?
The honest answer is that you should not rely on one measure alone.
CPI is useful for understanding consumer prices. PCE is important for Federal Reserve policy. PPI can provide early warnings about business cost pressures. Core inflation can help identify underlying trends. Gold and commodities can provide market context. Your personal budget tells you what inflation feels like in your real life.
If I had to simplify it, I would say this:
My Practical Inflation Dashboard
- For household purchasing power: CPI and your own monthly spending.
- For Federal Reserve policy: PCE and Core PCE.
- For business cost pressure: PPI.
- For underlying trend: Core CPI, Core PCE, median CPI, and trimmed mean measures.
- For market sentiment: gold, oil, commodities, bond yields, and inflation expectations.
No measure is perfect. But together, they can give you a much more complete picture of inflation than any single headline number.
Final Thoughts: Cover All Bases
There is no single inflation measure that tells the whole story. CPI, PPI, PCE, Core PCE, Chained CPI, commodities, wages, and private estimates all provide different pieces of the inflation puzzle.
The important thing is to understand what each measure is good at and where it falls short.
For most consumers, CPI is the easiest inflation measure to understand. For monetary policy, PCE is crucial. For investors and business owners, PPI and core inflation can help reveal pressure building beneath the surface. For your own household, your personal budget may be the most important inflation measure of all.
That is why I believe the best approach is to cover all bases. Follow the official numbers, understand their limitations, and compare them with your real-life spending. Inflation is not just a government statistic. It is something you feel every time your money buys less than it used to…