
Alex Demolitor
Alex Demolitor is a Canadian financial writer hailing from Halifax, NS. Alex has a Bachelors Degree from King's College and passed the CFA Exam Level III. He specializes in fundamental analysis of the stock, bond, commodity, and FX markets. He also covers US & Canadian economic indicators.

by Alex Demolitor | Aug 12, 2025 | Definitions
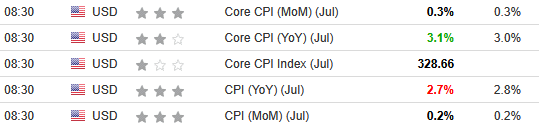
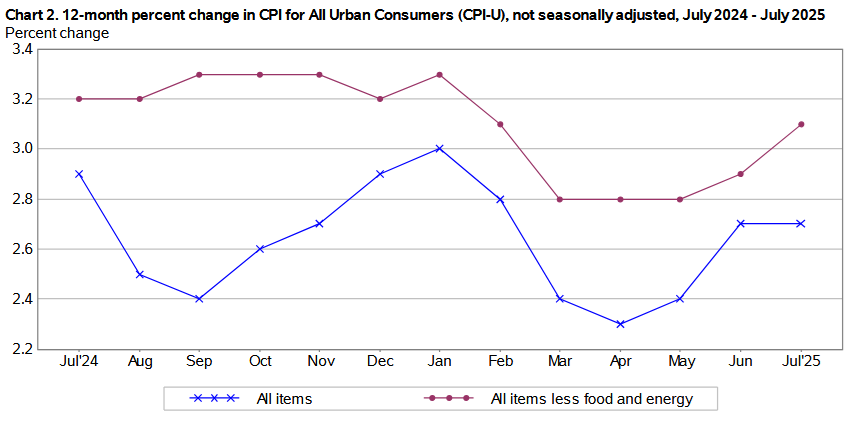
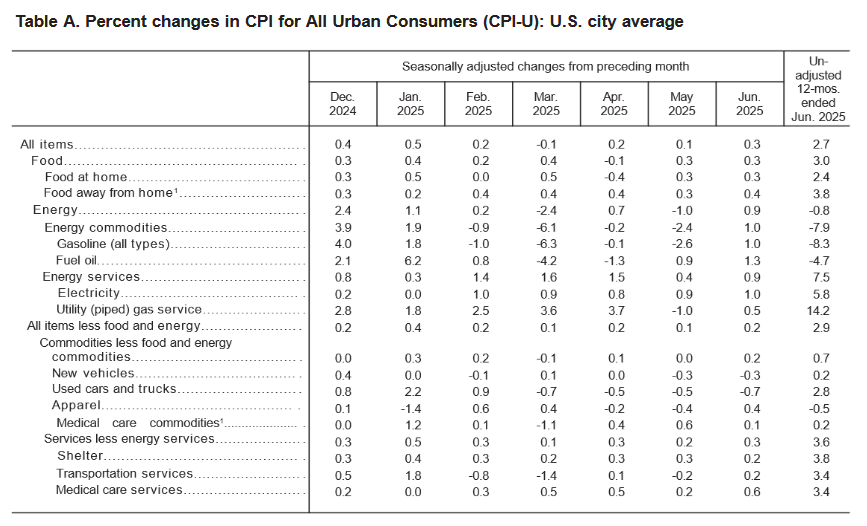
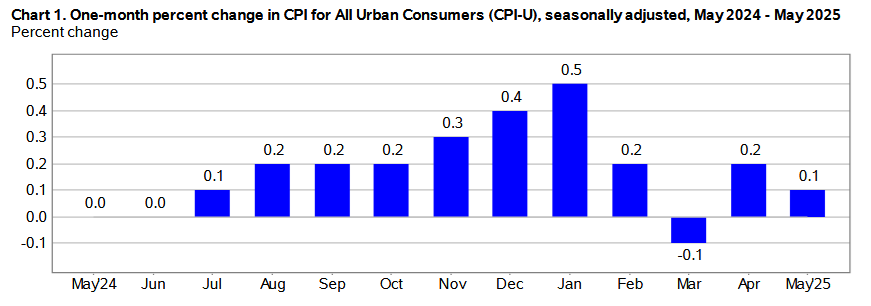
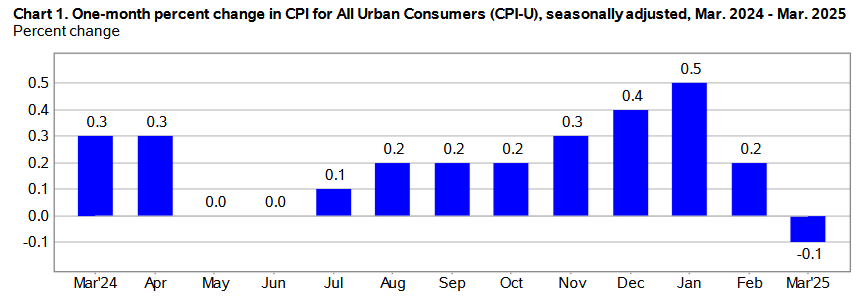
The July 2025 Consumer Price Index of All Urban Consumers (CPI-U) report indicates that inflation increased by 0.2% for the month, slightly below the 0.3% rise in June. These data were released at 8:30 am EST on August 12, 2025, by the Bureau of Labor Statistics. Before seasonal adjustment, the year-over-year (Y-o-Y) inflation rate in the all-items index grew by 2.7%, matching the figure from June.
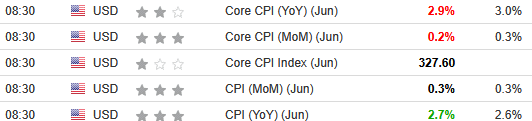
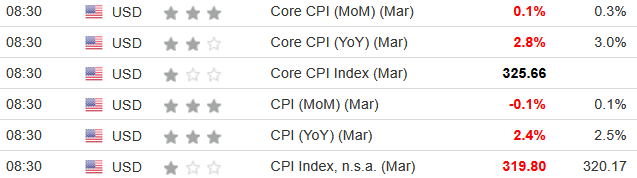
The mixed results aligned near economists’ consensus estimates. The table below is courtesy of Investing.com. The left column represents July’s figures, while the right column represents forecasters’ expectations. As you can see, core inflation outperformed, while headline inflation underperformed.
After the latest FOMC meeting on Jul. 30, Chairman Jerome Powell said during his press conference:
“Higher tariffs have begun to show through more clearly to prices of some goods, but their overall effects on economic activity and inflation remain to be seen. A reasonable base case is that the effects on inflation could be short-lived, reflecting a one-time shift in the price level. But it is also possible that the inflationary effects could instead be more persistent, and that is a risk to be assessed and managed.”
Thus, with today’s inflation results doing little to alleviate those concerns, more data will likely be needed before the FOMC feels comfortable cutting rates.
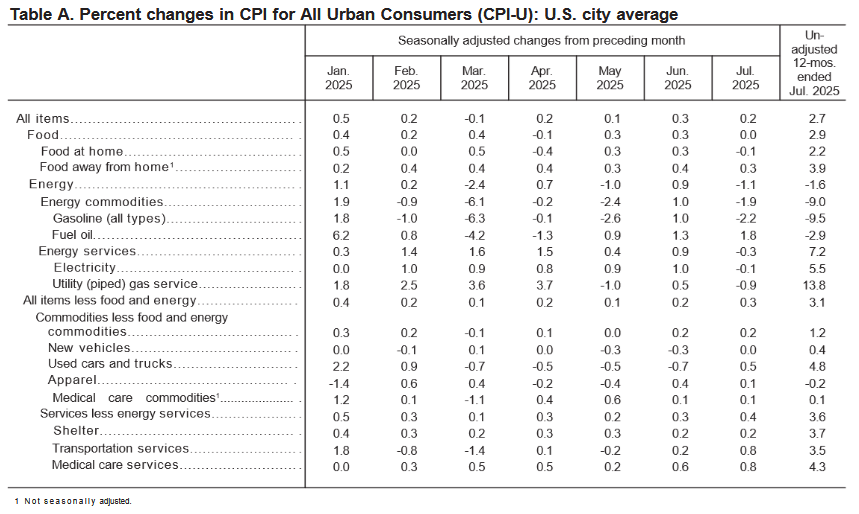
Transportation and medical care services were noticeable outliers in July, with each rising by 0.8% MoM, while fuel oil jumped by 1.8% MoM despite overall energy prices declining by 1.1% MoM. Core inflation (which excludes the impacts of food and energy), rose by 0.3% in July, up from 0.2% in June and 0.1% in May.
Food Prices
The food index was flat in July after rising by 0.3% MoM in June and May. Two of the six major grocery store food indexes increased, one was flat, and the other three realized deflation:
- Cereals and bakery products (-0.2%)
- Meats, poultry, fish, and eggs (+0.2%)
- Dairy and related products (+0.7%)
- Fruits and vegetables (+0.0%)
- Nonalcoholic beverages (-0.5%)
- Other food at home (-0.5%)
Maintaining its momentum, the food away from home index rose by 0.3%, as restaurant prices continue to outperform grocery store products.
Energy Prices
The energy index decreased by 1.1% in July after rising by 0.9% in June. Gasoline prices fell by 2.2%, natural gas by 0.9%, and electricity by 0.1%.
Core CPI
The July core CPI rose by 0.3% month-over-month and 3.1% Y-o-Y. Below is an itemized breakdown of the main price fluctuations seen in the core CPI reading:
- Shelter index: (+0.2%) [June: +0.2%]
- Rent index: (+0.3%) [June: +0.2%]
- Owners’ equivalent rent: (+0.3%) [June: +0.3%]
- Motor vehicle insurance: (+0.1%) [June: +0.1%]
- Medical care services: (+0.8%) [June: +0.6%]
- Physician services: (+0.2%) [June: +0.2%]
- Hospital services: (+0.5%) [June: +0.7%]
- Airline fares: (+4.0%) [June: -0.1%]
Seasonally Unadjusted CPI
Before seasonal adjustments, the CPI-U for July 2025 increased by 2.7% Y-o-Y to an index level of 323.048. Since these figures are unadjusted, they include regular seasonal price fluctuations that can create volatility in the results.
Tough Job Ahead?
The on-again, off-again, relationship with rate cuts continues to play out, as surprising labor market revisions confirmed the lingering weakness present in private data sources.
For example, U.S. job openings have declined, and ADP recently reported a net loss in its monthly private payrolls. However, the data was largely ignored because U.S. nonfarm payrolls — sourced from the Bureau of Labor Statistics (BLS) — continued to show solid growth and healthy hiring. But, that all changed on Aug. 1. The report stated:
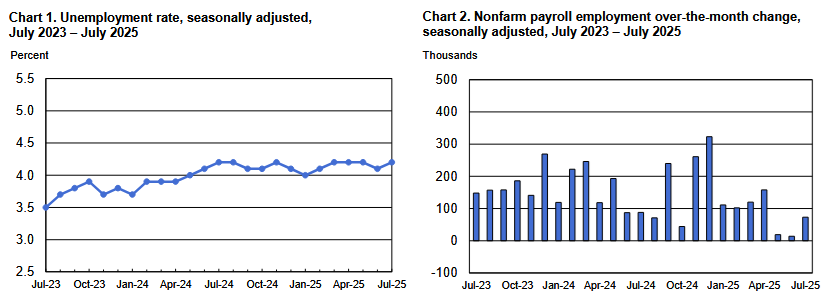
“Revisions for May and June were larger than normal. The change in total nonfarm payroll employment for May was revised down by 125,000, from +144,000 to +19,000, and the change for June was revised down by 133,000, from +147,000 to +14,000. With these revisions, employment in May and June combined is 258,000 lower than previously reported.”
Thus, while the unemployment rate held steady near 4.2%, the blue bars furthest to the right of the second chart below show how the pace of employment growth has declined significantly over the last few months.
Moreover, the massive downward revisions further complicate the FOMC’s already tough balancing act between taming inflation and maintaining maximum employment.
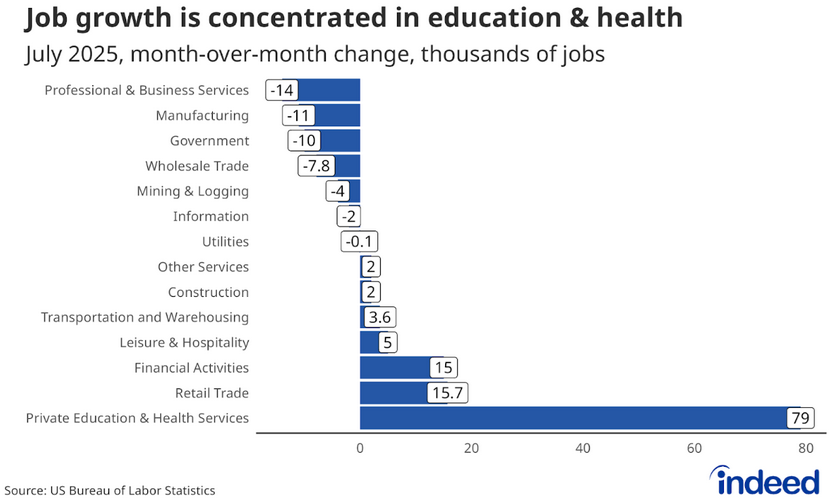
To that point, Indeed noted on Aug. 1 that the composition of hiring in July was equally troubling. An excerpt read:
“The sectoral breakdown from the jobs report is especially striking, with private education and health services adding 79,000 jobs, while other sectors, including professional and business services, manufacturing, and government, lost more than 10,000 jobs each. While the healthcare and social assistance sub-sector accounts for just 14.6% of total jobs in the economy, 48.8% of all employment growth in the US has occurred in this sub-sector over the past year….
“The increasing concentration of jobs in certain sectors and an outright contraction of jobs in many others does not bode well for the market going forward.”
So, while the FOMC’s latest Summary of Economic Projections has market participants expecting two rate cuts before the end of 2025, Vice Chair of Supervision, Michelle Bowman, advocated for three interest rate reductions on Aug. 9 to act as a hedge “against the risk of a further erosion in labor market conditions and a further weakening in economic activity.” Yet, other committee members prefer a wait-and-see approach, and there is plenty of division among the group.
All in all, there is so much volatility in the data that one month’s sunshine becomes next month’s storm. And with tariff uncertainty still lingering, FOMC members may struggle to form a clear consensus in the months ahead.
In contrast, the economic tension is bullish for gold, with the yellow metal hitting a new record high in August — surpassing $3,500 — and the long-term momentum remains intact.
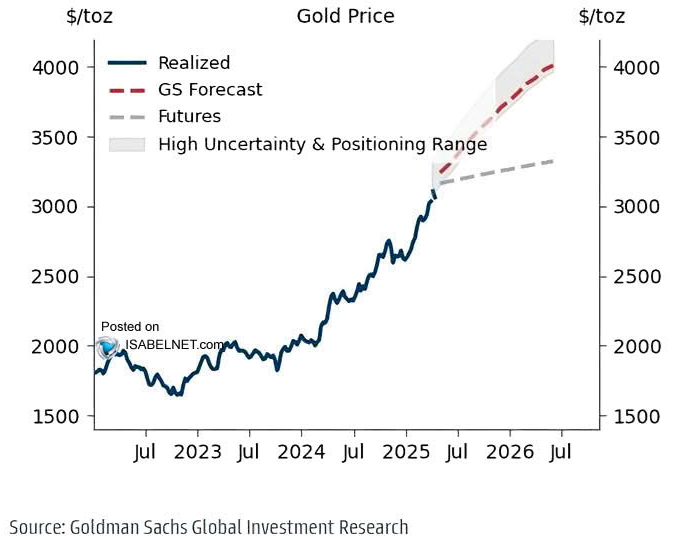
To explain, Goldman Sachs still expects gold to hit $4,000 by mid-2026. The investment bank’s latest analysis (the dashed red line) is well ahead of what’s priced into the futures market (the dashed gray line), which means there’s still room for traders to shift their expectations upwards.
Are you thinking about diversifying into precious metals? Talk to your financial advisor about initiating a gold IRA account today, allowing you to invest in this red-hot asset on a tax-advantaged basis. Additionally, our complimentary CPI inflation calculator remains at your disposal, enabling you to assess inflation’s impact on your finances. Please seek the guidance of a financial advisor before making any investment decision.
In addition, if credit concerns have increased alongside the economic uncertainty, there are solutions. Americor helps individuals and families with debt settlement, credit counseling, and provides consolidation loans by converting high-interest debt into products with lower interest rates and more manageable monthly payments.
Likewise, National Debt Relief offers advice, counselling, and negotiates with unsecured creditors to reduce your outstanding balance. It’s also a member of the American Fair Credit Council (AFCC) and the International Association of Professional Debt Arbitrators (IAPDA).
Finally, Trinity Debt Management is a nonprofit Christian group that delivers similar debt relief services and may be well-suited for Americans seeking faith-based advice and solutions.
Remember, speaking with a professional can help you avoid bankruptcy and protect your credit score. For more options, please consult our list of debt management firms that can help get you back on track.

by Alex Demolitor | Jul 15, 2025 | Definitions
The June 2025 Consumer Price Index of All Urban Consumers (CPI-U) report indicates that inflation rose by 0.3% for the month, up from 0.2% in May. These data were released at 8:30 am EST on July 15, 2025, by the Bureau of Labor Statistics. Before seasonal adjustment, the year-over-year (Y-o-Y) inflation rate in the all-items index grew by 2.7%, a jump from 2.4% Y-o-Y in May.
The mixed results aligned near economists’ consensus estimates. The table below is courtesy of Investing.com. The left column represents June’s figures, while the right column represents forecasters’ expectations. As you can see, core was cool, while the headline figure was somewhat hot.
Despite that, fresh tariff threats could increase the FOMC’s inflation concerns. Chairman Jerome Powell said recently that resurgent inflation “is a risk. As the people who are supposed to keep stable prices, we need to manage that risk. That’s all we’re doing…. It is just something you want to approach carefully. If we make a mistake people will pay the cost for a long time.”
Thus, today’s data may not have done enough to alleviate those concerns.
Electricity, gasoline, and fuel oil led the headline increase, as the metrics rose by 1% or more MoM . Core inflation (which excludes the impacts of food and energy), rose by 0.2% in June, up from 0.1% in May.
Food Prices
The food index jumped by 0.3% MoM in June, matching May, and three of the six major grocery store food indexes realized deflation once again:
- Cereals and bakery products (-0.2%)
- Meats, poultry, fish, and eggs (-0.1%)
- Dairy and related products (-0.3%)
- Fruits and vegetables (+0.9%)
- Nonalcoholic beverages (+1.4%)
- Other food at home (+0.2%)
Maintaining its momentum, the food away from home index rose by 0.4%, as restaurant inflation accelerated in June.
Energy Prices
The energy index increased by 0.9% in June after falling by 1.0% in May. Gasoline prices rose by 1.0%, natural gas by 0.5%, and electricity by 1.0%.
Core CPI
The June core CPI rose by 0.2% month-over-month and 2.9% Y-o-Y. Below is an itemized breakdown of the main price fluctuations seen in the core CPI reading:
- Shelter index: (+0.2%) [May: +0.3%]
- Rent index: (+0.2%) [May: +0.2%]
- Owners’ equivalent rent: (+0.3%) [May: +0.3%]
- Motor vehicle insurance: (+0.1%) [May: +0.7%]
- Medical care services: (+0.6%) [May: +0.2%]
- Physician services: (+0.2%) [May: -0.3%]
- Hospital services: (+0.7%) [May: +0.4%]
- Airline fares: (-0.1%) [May: -2.7%]

Seasonally Unadjusted CPI
Before seasonal adjustments, the CPI-U for June 2025 increased by 2.7% Y-o-Y to an index level of 322.561. Since these figures are unadjusted, they include regular seasonal price fluctuations that can create volatility in the results.
Trump’s Tariff Threats
After a three-month tariff reprieve, U.S. President Donald Trump ignited trade war fears again by threatening new levies on Canada, Mexico, Brazil, and the EU. And while most of the dues don’t come into effect until Aug. 1, and he could announce another pause when the deadline arrives, the uncertainty is another headache for the FOMC.
With the committee largely adopting a wait-and-see approach to interest rate cuts, the longer the uncertainty lingers, the more time and data they need to assess the situation. Consequently, while inflation remains above their 2% target and the labor market looks solid on the surface, the tariff diversion could distract from the underlying warning signs.
For example, U.S. nonfarm payrolls came in at 147,000 on Jul. 3, and the unemployment rate declined from 4.2% to 4.1%. However, ADP reported on Jul. 2 that private employers cut 33,000 jobs in June, which was a rare negative print from the payrolls provider. So, while government job gains helped bolster the former, the corporate sector could be signaling that tariff uncertainty is hurting business prospects.
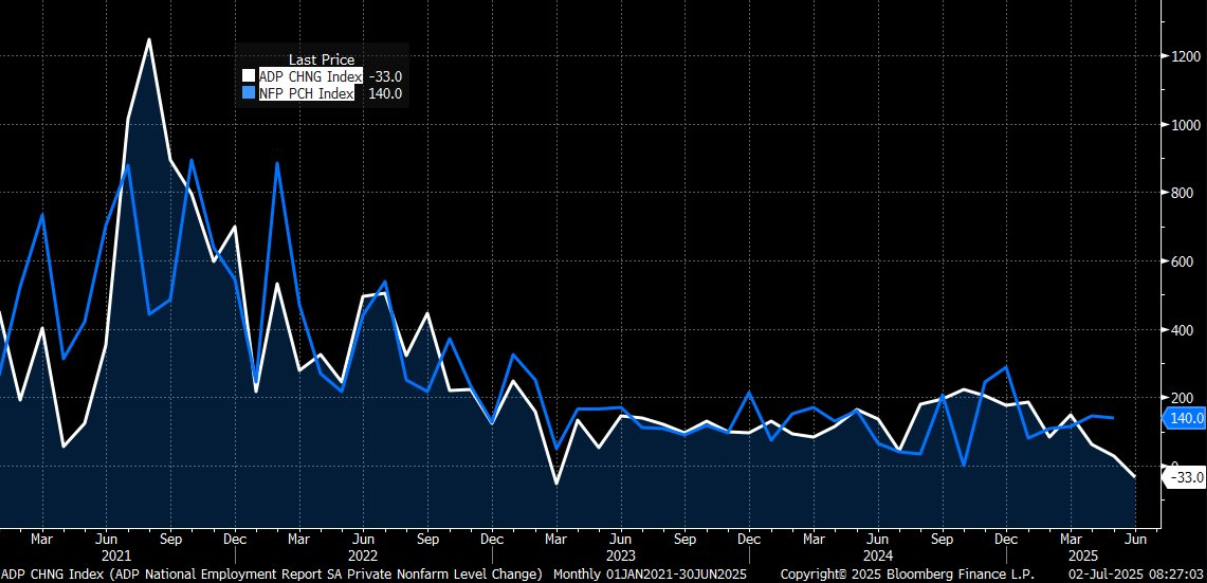
To explain, the blue line above tracks the monthly change in the private component of U.S. nonfarm payrolls, while the white line above tracks the monthly change in ADP’s figures. If you analyze the connection, you can see the pair often moves in a similar direction.
More importantly, the gap on the right side of the chart shows how negative ADP payrolls (the white line) contrast the strength of the NFP number (the blue line). As such, the U.S. labor market may be weaker than it appears.
To that point, the NFIB released its latest Small Business Optimism Index on Jul. 8. The report noted that 10% of respondents cited poor sales as their single most important problem, the highest reading since March 2021.
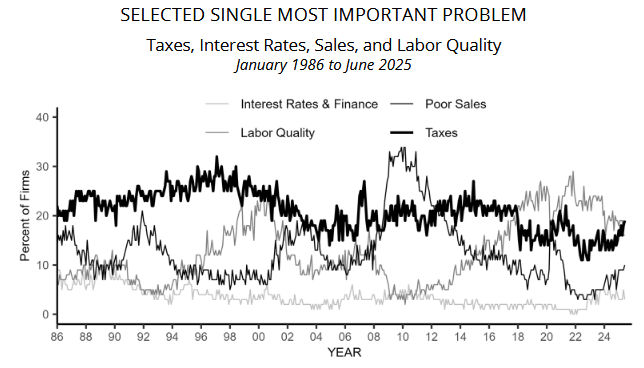
To explain, the second-darkest line on the chart above tracks the poor sales component. If you analyze the right side of the chart, you can see that it continues to trend higher and is unlikely to reverse until the macroeconomic clouds clear. Furthermore, if a sales slump continues to plague U.S. small businesses, they may respond by reducing headcount and further weakening the labor market.
All in all, while tariffs will likely exacerbate the growth and employment slowdown, the economic turmoil is bullish for gold. The yellow metal remains in an uptrend and concerns about the U.S. dollar and its safe-haven status have investors and central banks allocating more capital toward gold.
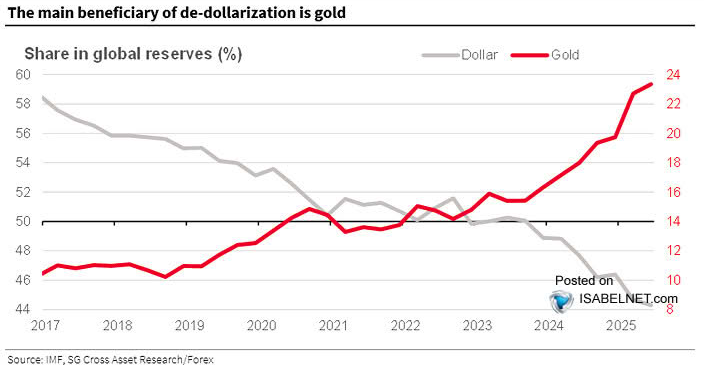
To explain, the gray line above tracks the share of U.S. dollar reserves held by global central banks, while the red line above tracks the share of gold reserves held by global central banks. If you analyze the post-COVID shift, you can see that U.S. debt and spending concerns caused global institutions to reduce their USD exposure and increase their gold assets. And with the trend poised to continue, flows and fundamentals should keep gold elevated for the foreseeable future.
Are you thinking about diversifying into precious metals? Talk to your financial advisor about initiating a gold IRA account today, allowing you to invest in this red-hot asset on a tax-advantaged basis. Additionally, our complimentary CPI inflation calculator remains at your disposal, enabling you to assess inflation’s impact on your finances. Please seek the guidance of a financial advisor before making any investment decision.
In addition, if credit concerns have increased alongside the economic uncertainty, you’re not alone. New Era Debt Solutions is a top-rated debt settlement company that can help alleviate unsecured claims in as little as 24 to 48 months. Similarly, Family Credit Management is an excellent nonprofit credit counseling agency that provides the education and resources necessary to determine the optimal path to financial well-being.
For debt consolidation, Mariner Finance is a reputable personal loan provider that caps its APRs at 35.99%. You can borrow $1,000 to $25,000 (up to $50,000 in select states) and solutions are available for applicants that often don’t qualify at traditional banks.
Remember, speaking with a professional can help you avoid bankruptcy and protect your credit score. To learn more, please consult our list of debt management firms that can help get you back on track.
by Alex Demolitor | Jun 11, 2025 | Definitions
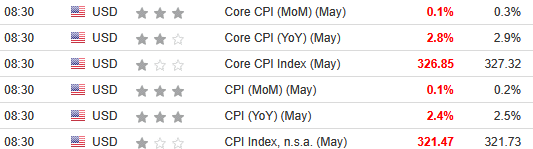
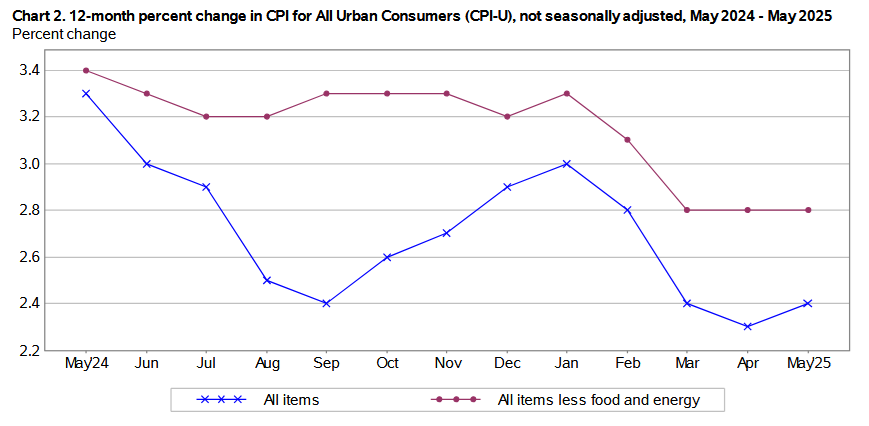
The May 2025 Consumer Price Index of All Urban Consumers (CPI-U) report indicates that inflation rose by 0.1% for the month, down from April’s 0.2% increase. These data were released at 8:30 am EST on Tuesday, June 11, 2025, by the Bureau of Labor Statistics. Before seasonal adjustment, the year-over-year (Y-o-Y) inflation rate in the all-items index grew by 2.4%, a small rise from the 2.3% Y-o-Y in April.
The downside surprise was more welcome news, as the results missed economists’ consensus estimates. The table below is courtesy of Investing.com. The left column represents May’s figures, while the right column represents forecasters’ expectations. As you can see, tariffs have not been as inflationary as anticipated.
Despite the deceleration, the FOMC has been increasingly concerned about inflation. The May meeting Minutes (released on May 28) stated:
“The substantial upward revision to the inflation forecast in 2025 was judged to leave the risks around the inflation projection balanced in that year. Thereafter, the staff continued to view the risks around the inflation forecast as skewed to the upside, with recent increases in some measures of inflation expectations raising the possibility that inflation would prove to be more persistent than the baseline projection assumed.”
As a result, with the FOMC somewhat offside in its projection, a weaker CPI could surprise market participants in the months ahead.
Gasoline, used cars and trucks, and apparel led May’s downside momentum, while shelter held steady at 0.3% MoM. Core inflation (which excludes the impacts of food and energy), rose by 0.1% in May, declining from the 0.2% rise in April.

Food Prices
The food index jumped by 0.3% MoM in May, after falling by 0.1% in April, and three of the six major grocery store food indexes realized deflation:
- Cereals and bakery products (+1.1%)
- Meats, poultry, fish, and eggs (-0.4%)
- Dairy and related products (-0.1%)
- Fruits and vegetables (+0.3%)
- Nonalcoholic beverages (-0.3%)
- Other food at home (+0.7%)
Maintaining its momentum, the food away from home index rose by 0.3%, as restaurant inflation stayed resilient.
Energy Prices
The energy index dropped by 1.0% in May, a noticeable turn from the 0.7% increase in April. Gasoline prices fell by 2.6%, while natural gas deflated by 1%, and electricity jumped by 0.9%.
Core CPI
The May core CPI rose by 0.1% month-over-month and 2.8% Y-o-Y. Below is an itemized breakdown of the main price fluctuations seen in the core CPI reading:
- Shelter index: (+0.3%) [April: +0.3%]
- Rent index: (+0.2%) [April: +0.2%]
- Owners’ equivalent rent: (+0.3%) [April: +0.4%]
- Motor vehicle insurance: (+0.7%) [April: +0.6%]
- Medical care services: (+0.2%) [April: +0.5%]
- Physician services: (-0.3%) [April: +0.3%]
- Hospital services: (+0.4%) [April: +0.6%]
- Airline fares: (-2.7%) [April: -2.8%]
Seasonally Unadjusted CPI
Before seasonal adjustments, the CPI-U for May 2025 increased by 2.4% Y-o-Y to an index level of 321.465. Since these figures are unadjusted, they include regular seasonal price fluctuations that can create volatility in the results.
Juggling the Dual Mandate
While inflation has been the primary driver of the FOMC’s caution, it’s important to remember that maximum employment is the second half of the committee’s dual mandate. And with mixed data hitting the wire recently, slower job growth could support rate cuts in the months ahead.
On the positive side, U.S. nonfarm payrolls outperformed expectations on Jun. 6, as the economy added 139,000 new jobs in May, and the unemployment rate held firm at 4.2%. However, the report stated:
“The change in total nonfarm payroll employment for March was revised down by 65,000, from +185,000 to +120,000, and the change for April was revised down by 30,000, from +177,000 to +147,000. With these revisions, employment in March and April combined is 95,000 lower than previously reported.”
As a result, prior months were weaker than they appeared, and another downward revision could occur next month. Moreover, the unemployment rate continues to creep higher off of its 2023 low.

As further evidence, ADP’s private payrolls missed expectations on Jun. 4. The report stated, “The pace of hiring in May reached its lowest level since March 2023.” Furthermore, firms of all sizes reduced their headcounts in May, with the only positive contribution of 51,000 additions coming from firms with 50-249 employees. Conversely, layoffs were driven by small establishments.

Finally, the NFIB released its small business employment report on May 31. The release stated: “A seasonally adjusted net 12 percent of owners plan to create new jobs in the next three months, down 1 point from April. Job creation plans remain in weak territory compared to recent history.”

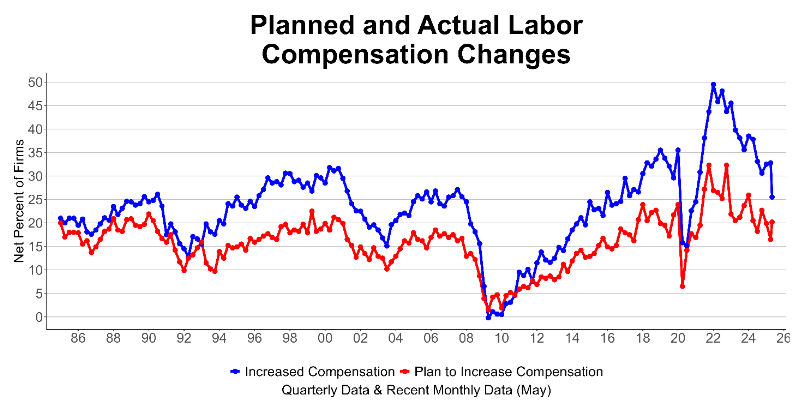
Furthermore, “Seasonally adjusted, a net 26 percent reported raising compensation, down 7 points from April and the lowest reading since February 2021. This was the greatest monthly decline since April 2020. A net 20 percent (seasonally adjusted) plan to raise compensation in the next three months, up 3 points from April. Clearly, the pressure of labor costs on inflation is easing.”
Thus, with hiring intentions and expected wage increases both heading in negative directions, a weaker U.S. labor market could prompt the Fed to ease monetary policy during the summer months. If so, the dovish recalibration could push gold to another record high. The yellow metal has been one of the best-performing assets in 2025, and ETF flows could be the next bullish catalyst.

To explain, the Deutsche Bank chart above shows how after four negative years, gold ETF flows turned positive in 2025. However, the blue bar furthest to the right is relatively small, and prior periods saw much larger inflows that were sustained for several years.
As such, a repeat of recent history could support a gold bull market that lasts into 2026 and beyond.
Are you thinking about diversifying into precious metals? Talk to your financial advisor about initiating a gold IRA account today, allowing you to invest in this red-hot asset on a tax-advantaged basis. Additionally, our complimentary CPI inflation calculator remains at your disposal, enabling you to assess inflation’s impact on your finances. Please seek the guidance of a financial advisor before making any investment decision.
In addition, if credit concerns have increased alongside the economic uncertainty, you’re not alone. New Era Debt Solutions is a top-rated debt settlement company that can help alleviate unsecured claims in as little as 24 to 48 months. Similarly, Family Credit Management is an excellent nonprofit credit counseling agency that provides the education and resources necessary to determine the optimal path to financial well-being.
For debt consolidation, Mariner Finance is a reputable personal loan provider that caps its APRs at 35.99%. You can borrow $1,000 to $25,000 (up to $50,000 in select states) and solutions are available for applicants that often don’t qualify at traditional banks.
Remember, speaking with a professional can help you avoid bankruptcy and protect your credit score. To learn more, please consult our list of debt management firms that can help get you back on track.
by Alex Demolitor | May 13, 2025 | Definitions
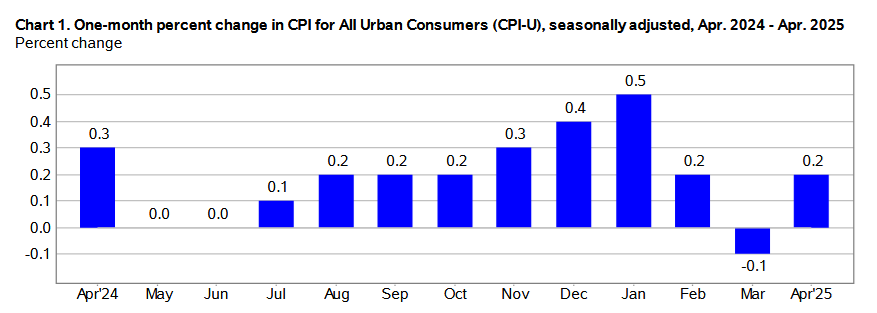
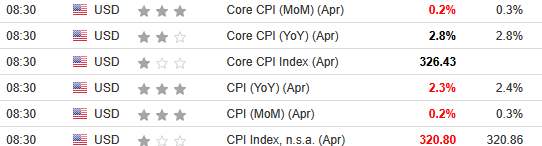
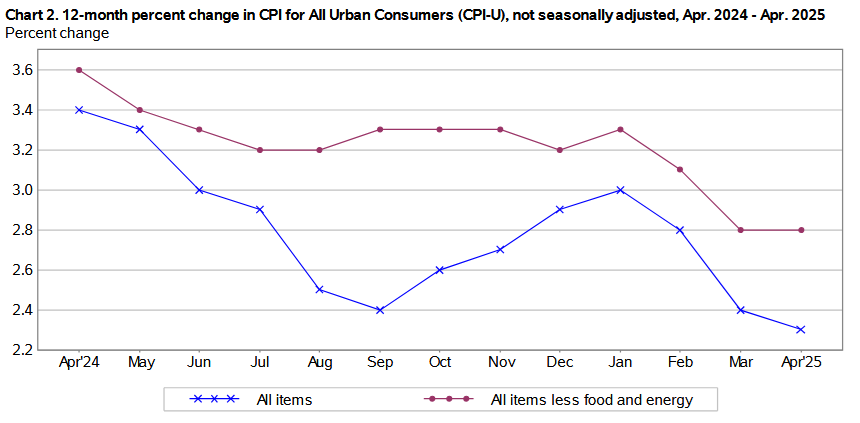
The April 2025 Consumer Price Index of All Urban Consumers (CPI-U) report indicates that inflation rose by 0.2% for the month, up from the 0.1% drop in March and matching February’s 0.2% increase. These data were released at 8:30 am EST on Tuesday, May 13, 2025, by the Bureau of Labor Statistics. Before seasonal adjustment, the year-over-year (Y-o-Y) inflation rate in the all-items index grew by 2.3%, a continued deceleration from 2.4% in March and 2.8% in February.
The downside surprise was more welcome news, as the results missed economists’ consensus estimates. The table below is courtesy of Investing.com. The left column represents April’s figures, while the right column represents forecasters’ expectations. As you can see, the red metrics were softer than anticipated.
Despite that, Fed Chairman Jerome Powell has maintained a cautious outlook amid the trade uncertainty and highlighted the challenges following the FOMC meeting on May 7:
“If the large increases in tariffs that have been announced are sustained, they are likely to generate a rise in inflation, a slowdown in economic growth, and an increase in unemployment,” he said. “The effects on inflation could be short-lived, reflecting a one-time shift in the price level. It is also possible that the inflationary effects could instead be more persistent.”
“Avoiding that outcome will depend on the size of the tariff effects, on how long it takes for them to pass through fully into prices, and, ultimately, on keeping longer-term inflation expectations well anchored. Our obligation is to keep longer-term inflation expectations well anchored and to prevent a one-time increase in the price level from becoming an ongoing inflation problem.”
Thus, while Powell made these remarks before the U.S.-China deal was announced, the FOMC continues to cite inflation as its primary concern. And while the data cooperated again in April, Powell still prefers further evidence of disinflation to justify easing monetary policy.
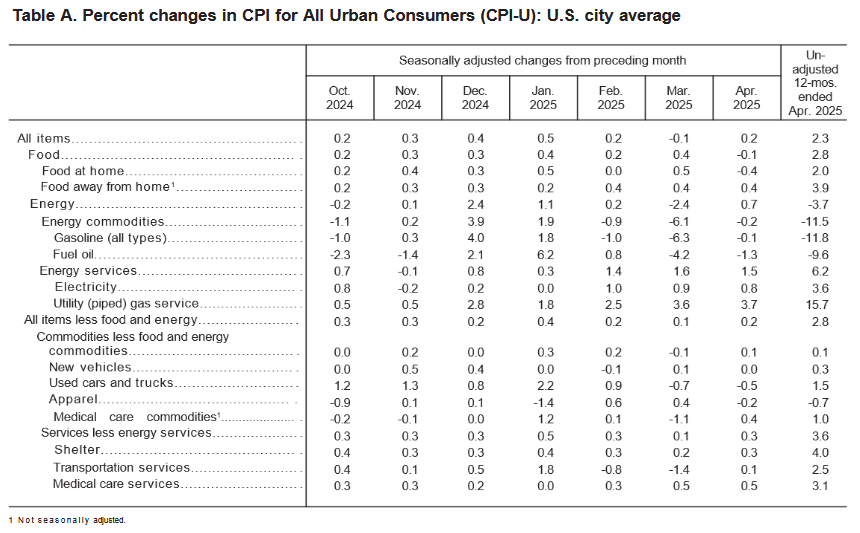
Used cars and trucks, fuel oil, and apparel headlined April’s downside momentum, while shelter remained well-behaved at 0.3% MoM.
Core inflation (which excludes the impacts of food and energy), rose by 0.2% in April, up from 0.1% in March, and matching the 0.2% rise in February. Airline fares, used cars and trucks, communication, and apparel prices lagged, while household furnishings and operations, medical care, motor vehicle insurance, education, and personal care prices increased.
Food Prices
The food index fell by 0.1% in April, a noticeable slowdown from the 0.4% jump in March. Five of the six major grocery store food indexes realized deflation, and the 0.4% MoM drop in the food at home index was the largest decline since September 2020:
- Cereals and bakery products (-0.5%)
- Meats, poultry, fish, and eggs (-1.6%)
- Dairy and related products (-0.2%)
- Fruits and vegetables (-0.4%)
- Nonalcoholic beverages (+0.7%)
- Other food at home (-0.1%)
In contrast, the food away from home index rose by 0.4%, as restaurant inflation remains resilient.
Energy Prices
The energy index rose by 0.7% in April, bouncing back from the 2.4% drop in March. Gasoline prices fell by 0.1%, while natural gas and electricity inflation jumped by 3.7% and 0.8%.
Core CPI
The April core CPI rose by 0.2% month-over-month and 2.8% Y-o-Y. Below is an itemized breakdown of the main price fluctuations seen in the core CPI reading:
- Shelter index: (+0.3%) [March: +0.2%]
- Rent index: (+0.3%) [March: +0.3%]
- Owners’ equivalent rent: (+0.4%) [March: +0.4%]
- Motor vehicle insurance: (+0.6%) [March: -0.8%]
- Medical care services: (+0.5%) [March: +0.5%]
- Physician services: (+0.3%) [March: +0.3%]
- Hospital services: (+0.6%) [March: +1.1%]
- Airline fares: (-2.8%) [March: -5.3%]
Seasonally Unadjusted CPI
Before seasonal adjustments, the CPI-U for April 2025 increased by 2.3% Y-o-Y to an index level of 320.795. Since these figures are unadjusted, they include regular seasonal price fluctuations that can create volatility in the results.
Waiting For Clarity
With Powell pushing back on pundits’ calls for rate cuts, he cited a resilient economy and solid labor market as other reasons for prioritizing patience. He added:
“The labor market appears to be solid. Inflation is running just a bit above two percent. So, it’s an economy that’s been resilient and is in good shape, and our policy is sort of modestly or moderately restrictive. It’s 100 basis points less restrictive than it was last fall. And so, we think that leaves us in a good place to wait and see. We don’t think we need to be in a hurry. We think we can be patient.”
However, while the headline data remains constructive, leading indicators signal a more pessimistic outlook. For example, wage growth often provides clues into labor demand, and when the former slows, the latter typically follows.
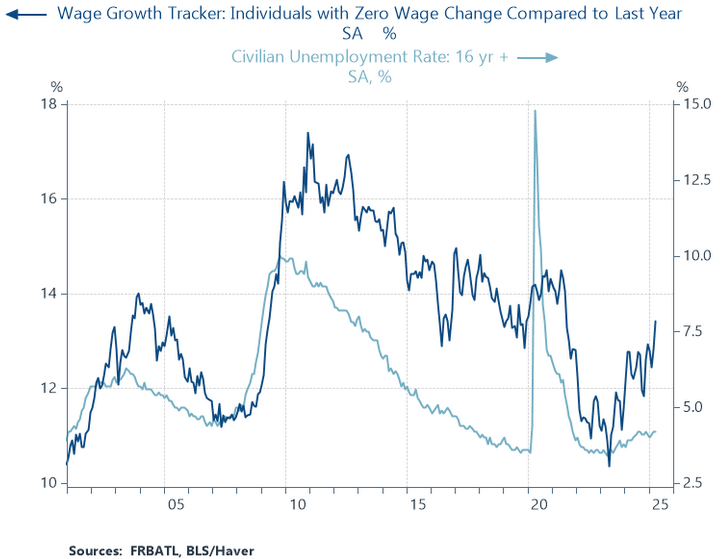
To explain, the light blue line above tracks the civilian unemployment rate (16+), while the dark blue line above tracks the Y-o-Y percentage change in the number of Americans with no wage growth.
If you analyze the connection, you can see that flat wages are often a precursor to layoffs and a higher unemployment rate. And with the dark blue line on the right side of the chart rising sharply, Powell may be missing the extent of the cooling U.S. labor market.
To that point, with U.S. job postings on Indeed hitting a new cycle low, it’s another leading indicator pointing to a labor market slowdown.
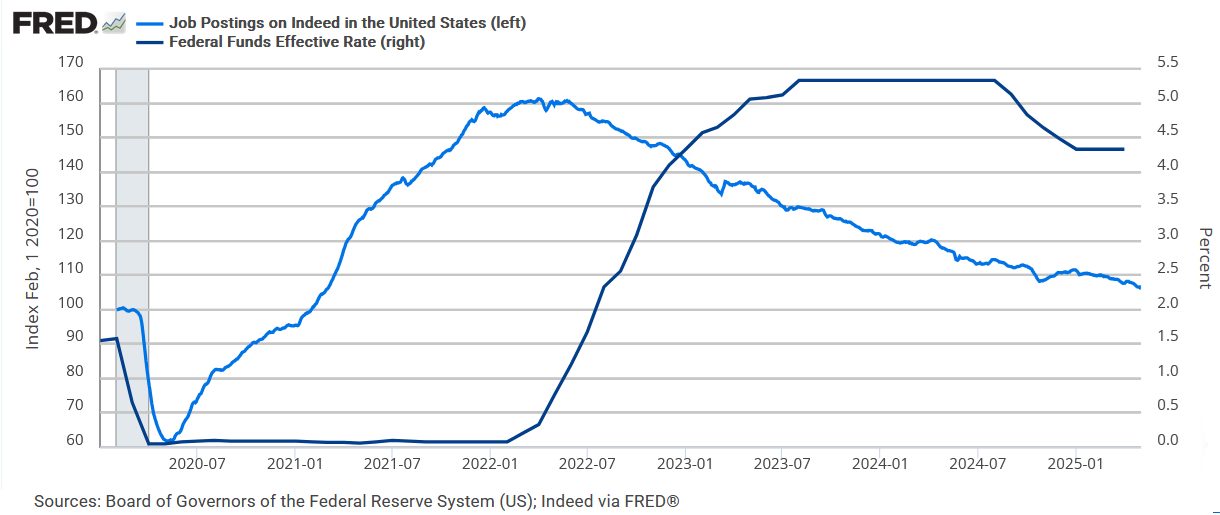
To explain, the dark blue line above tracks the U.S. federal funds rate (FFR), while the light blue line above tracks Indeed’s job postings. And while the latter is nearly back to where it was pre-pandemic, the FFR is roughly 3% higher than it was pre-pandemic. As a result, Powell’s focus on inflation could cause short-term interest rates to remain higher for longer than they should.
Yet, as tariff and inflation uncertainty handcuff the Fed, gold should remain a primary beneficiary. China’s central bank continues to stockpile gold, and robust demand could foster higher prices for several years. The World Gold Council noted recently:
“The People’s Bank of China (PBoC) has been adding gold to its reserves for five consecutive months: March saw a 2.8t reported addition to China’s official gold holdings and Q1 ended with a net gain of 12.8t.”
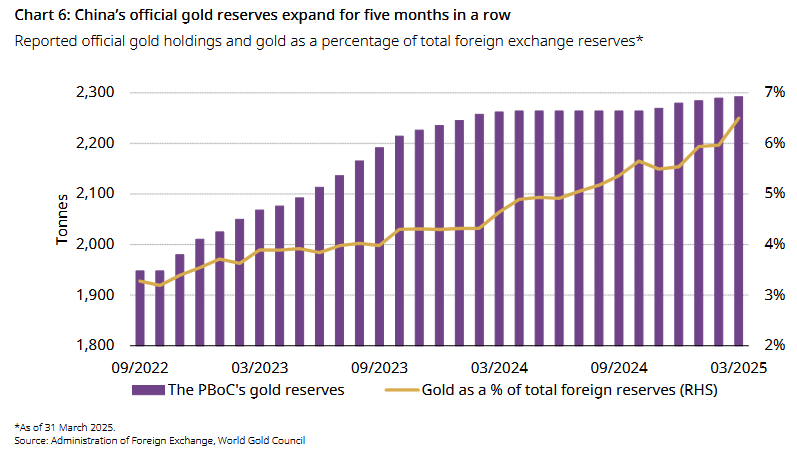
Likewise, Goldman Sachs noted that while the PBoC has been on a buying spree, it holds fewer than 8% of its total reserves in gold compared to a developed-market average of ~70%. Moreover, an achievable purchase allocation of 40 tonnes per month over the next three years could push the figure to 20% and create price support for the foreseeable future.

Are you thinking about diversifying into precious metals? Talk to your financial advisor about initiating a gold IRA account today, allowing you to invest in this red-hot asset on a tax-advantaged basis. Additionally, our complimentary CPI inflation calculator remains at your disposal, enabling you to assess inflation’s impact on your finances. Please seek the guidance of a financial advisor before making any investment decision.
In addition, if credit concerns have increased alongside the economic uncertainty, you’re not alone. New Era Debt Solutions is a top-rated debt settlement company that can help alleviate unsecured claims in as little as 24 to 48 months. Similarly, Family Credit Management is an excellent nonprofit credit counseling agency that provides the education and resources necessary to determine the optimal path to financial well-being.
Remember, speaking with a professional can help you avoid bankruptcy and protect your credit score. To learn more, please consult our list of debt management firms that can help get you back on track.
by Alex Demolitor | Apr 10, 2025 | Definitions
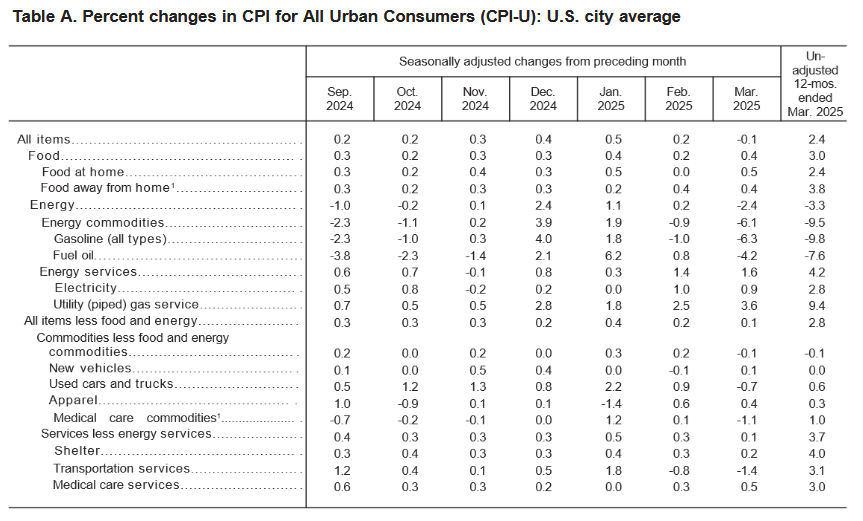
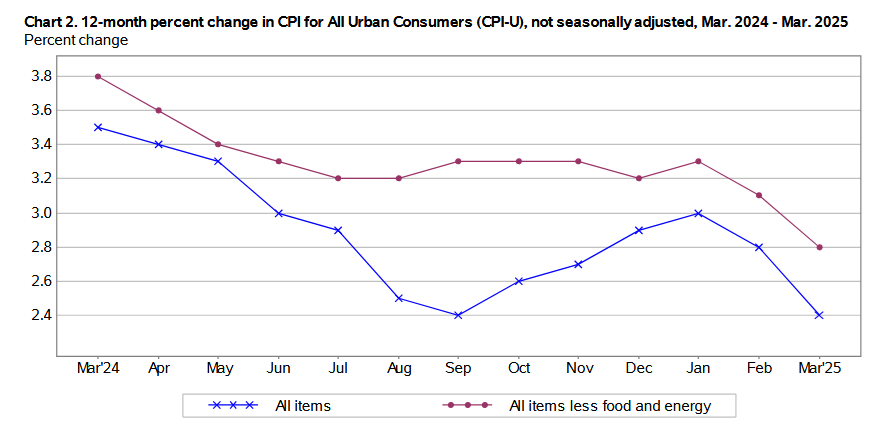
The March 2025 Consumer Price Index of All Urban Consumers (CPI-U) report indicates that inflation declined by 0.1% for the month, reversing February’s 0.2% rise. These data were released at 8:30 am EST on Thursday, April 10, 2025, by the Bureau of Labor Statistics. Before seasonal adjustment, the year-over-year (Y-o-Y) inflation rate in the all-items index grew by 2.4%, a continued deceleration from 2.8% in February, 3.0% in January, and 2.9% in December.
The downside surprise was more welcome news, as the results missed economists’ consensus estimates. The table below is courtesy of Investing.com. The left column represents March’s figures, while the right column represents forecasters’ expectations. As you can see, the red metrics were weaker than anticipated.
Despite that, Fed Chairman Jerome Powell has maintained a cautious outlook and said on Apr. 4:
“While uncertainty remains elevated, it is now becoming clear that the tariff increases will be significantly larger than expected. While tariffs are highly likely to generate at least a temporary rise in inflation, it is also possible that the effects could be more persistent. We are well positioned to wait for greater clarity before considering any adjustments to our policy stance. It is too soon to say what will be the appropriate path for monetary policy.”
As a result, while the data has cooperated recently, Powell still prefers further evidence of disinflation to warrant more rate cuts.
Gasoline, transportation services, and used cars and trucks drove March’s downside momentum, while shelter also slowed to 0.2% MoM.
Core inflation (which excludes the impacts of food and energy), rose by 0.1% in March, down from 0.2% in February and 0.4% in January. The indexes for airline fares, motor vehicle insurance, and recreation were among the primary laggards.
Food Prices
The food index jumped by 0.4% in March, after slowing to 0.2% in February. Although, two of the six major grocery store food indexes realized deflation:
- Cereals and bakery products (-0.1%)
- Meats, poultry, fish, and eggs (+1.3%)
- Dairy and related products (+1.0%)
- Fruits and vegetables (-0.5%)
- Nonalcoholic beverages (+0.6%)
- Other food at home (+0.5%)
Likewise, the food away from home index rose by 0.4%, as restaurant inflation remains resilient.
Energy Prices
The energy index fell by 2.4% in March, after rising by 0.2% in February and 1.1% in January. Gasoline prices sunk by 6.3%, while natural gas and electricity inflation jumped by 3.6% and 0.9%.
Core CPI
The March core CPI rose by 0.1% month-over-month and 2.8% Y-o-Y. Below is an itemized breakdown of the main price fluctuations seen in the core CPI reading:
- Shelter index: (+0.2%) [February: +0.3%]
- Rent index: (+0.3%) [February: +0.3%]
- Owners’ equivalent rent: (+0.4%) [February: +0.3%]
- Motor vehicle insurance: (-0.8%) [February: +0.3%]
- Medical care services: (+0.5%) [February: +0.3%]
- Physician services: (+0.3%) [February: +0.4%]
- Hospital services: (+1.1%) [February: +0.1%]
- Airline fares: (-5.3%) [February: -4.0%]
Seasonally Unadjusted CPI Data for March
Before seasonal adjustments, the CPI-U for March 2025 increased by 2.4% Y-o-Y to an index level of 319.799. Since these figures are unadjusted, they include regular seasonal price fluctuations that can create volatility in the results.
Who Blinks First?
Although Powell has preached patience when it comes to future rate cuts, the economic backdrop has become more precarious. With trade wars and stock market volatility intensifying, the sour sentiment could weigh on corporations’ investment decisions and eventually result in higher unemployment. As a result, the second half of the Fed’s dual mandate could dominate the longer the uncertainty persists.
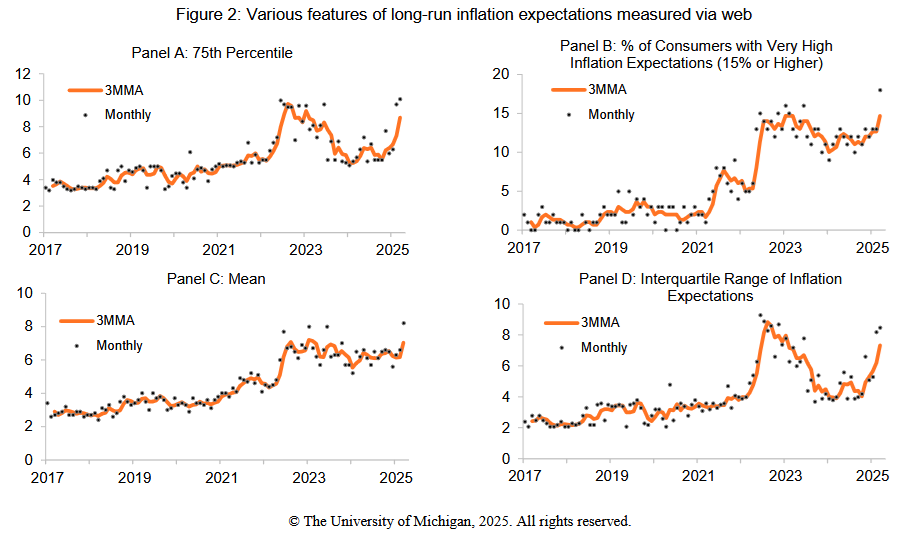
Furthermore, the dichotomy in inflation expectations could have Powell looking in the wrong direction. For example, the University of Michigan’s latest Consumer Sentiment Report showed a material rise in Americans’ inflation fears. An excerpt read:
“As of March 2025, long-run expectations have climbed sharply for three consecutive months and are now comparable to the peak readings from the post-pandemic inflationary episode. They exhibit substantial uncertainty, particularly in light of frequent developments and changes with economic policy.”
Conversely, the 5y5y tells a different story. For context, the metric measures institutional investors’ five-year inflation expectation five years from today. If you analyze the right side of the chart below, you can see that the 5y5y has declined considerably in 2025 and remains near the Fed’s 2% long-run target.
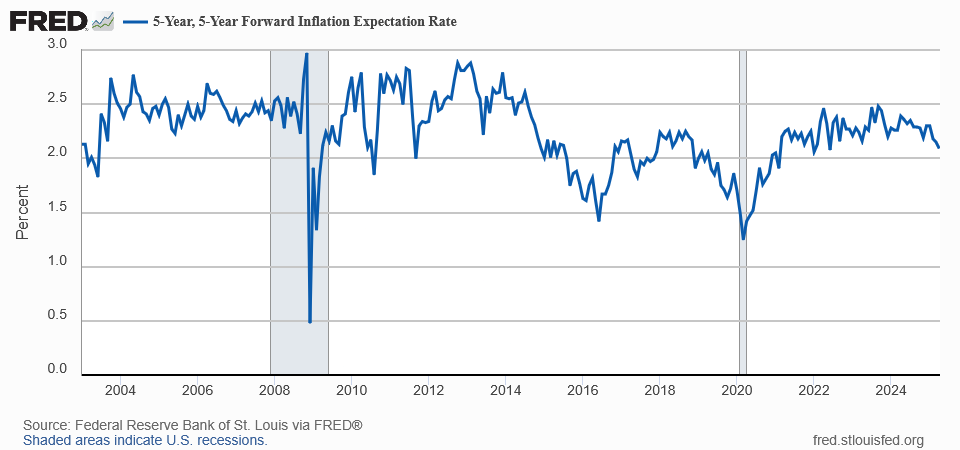
Add it all up, and Powell has to decide whether he believes consumers or investors assessment of future inflation.
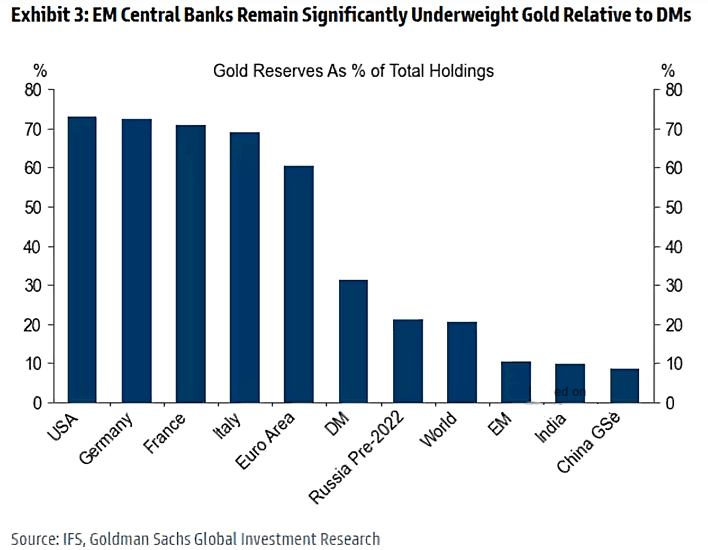
In the meantime, while stocks have gyrated, gold continues to outperform. And while developed-market central banks have large gold reserves, emerging market purchases could be the next catalyst to push prices higher.
The Goldman Sachs chart below shows how EM central banks have relatively small gold holdings. But, if they follow their DM counterparts and increase their allocations, the gold price could shine even brighter in the months ahead.
Are you thinking about diversifying into precious metals? Talk to your financial advisor about initiating a gold IRA account today, allowing you to invest in this red-hot asset on a tax-advantaged basis. Additionally, our complimentary CPI inflation calculator remains at your disposal, enabling you to assess inflation’s impact on your finances. Remember, seek the guidance of a financial advisor before making any investment decision.
In addition, if debt troubles have increased alongside the economic uncertainty, you’re not alone. Speaking with a professional can help you avoid bankruptcy and protect your credit score. To learn more, consult our list of debt management firms that can help get you back on track.

