by Brandi Marcene | Jan 16, 2026 | Definitions
Living in Idaho might feel and sound like an affordable idea, but Idaho debt relief is becoming a very significant service as Idahoans are challenged by rising housing expenses, irregular incomes, and unexpected bills. Whether in Boise, Idaho, or in other parts of the state, the availability of financial advice can be an issue.
For a comprehensive overview of national options, see our Debt Relief Overview.
Why Is Debt Relief Unique in Idaho?
The debt situation in Idaho is not the same as in coastal or expensive states. Even though the overall costs might be lower, the residents still have to deal with some issues, such as:
- Rural and urban access — Online or remote programs are mostly the only way for residents living beyond Boise or Nampa to get access to the services.
- Seasonal employment — There are income fluctuations due to agricultural and tourist jobs.
- Medical and emergency expenses — Limited access to hospitals could cause a patient to incur higher out-of-pocket costs.
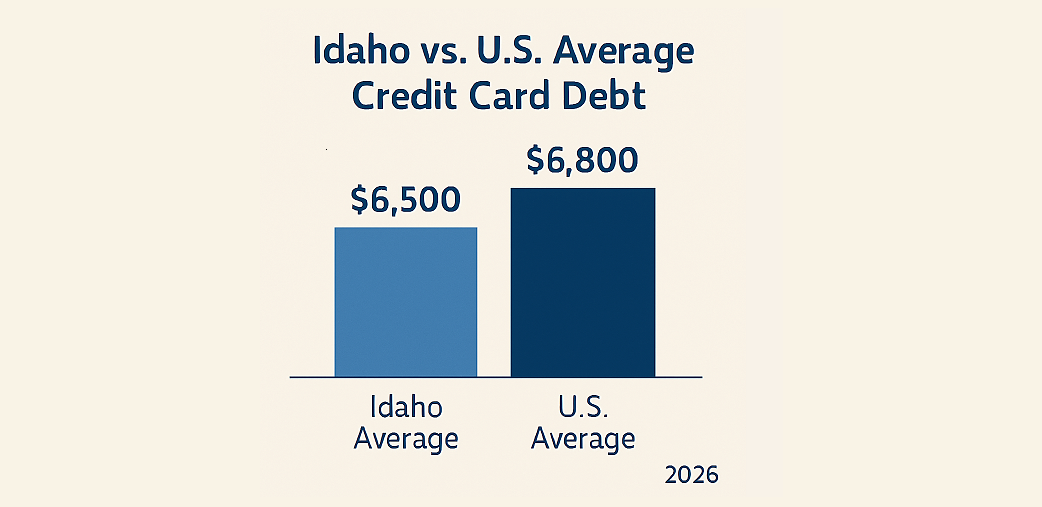
An average Idaho adult holds about $6,500 as credit card debt, and household debt comprising mortgages and personal loans has shown a steady rise over the last five years.

Information taken from Forbes
What Types of Idaho Debt Relief Programs Are Available?
Understanding the types of programs helps Idaho residents choose the right option:
Debt Settlement
Negotiates your unsecured debt for less than what is owed, often used for credit cards, medical bills, and personal loans. Accounts are managed online, and monthly payments typically last 24–48 months.
Debt Management Plans (DMPs)
Offered by nonprofit agencies, DMPs consolidate payments and lower interest rates. They are ideal for residents with a steady income but multiple small-to-mid debt balances. Rural residents may rely on online sessions rather than in-person meetings.
Debt Consolidation Loans
Combines multiple debts into one loan with a lower interest rate. Best for residents with good credit and financial discipline. Local lenders in Meridian or Twin Falls may offer competitive products.
Credit Counseling
Provides education and budgeting guidance, particularly useful for smaller balances. Nonprofit agencies can help Idaho residents plan repayment and avoid future debt traps.
Bankruptcy (Last Resort)
Legal mechanism to discharge debts, but comes with a long-term credit impact. Residents should consult a licensed Idaho attorney before pursuing.
For a detailed comparison of national debt solutions, check out the Top 21 Debt Settlement Companies.
Who Qualifies for Idaho Debt Relief Programs?
Curious if debt relief fits your debt challenges? See if you qualify for a customized plan with New Era’s settlement program using their free assessment tool.
Explore a Free Consultation
Top Idaho Debt Relief Companies Compared
Choosing the right provider significantly impacts your results. The following companies offer programs for Idaho residents:
Idaho Debt Relief Companies Comparison
| Company |
Best For |
Minimum Debt |
Fees |
Serves Idaho |
| New Era Debt Solutions |
Personalized settlement for large unsecured debt |
$10,000 |
Performance-based |
Nationwide |
| Century Support Services |
Nonprofit credit counseling & debt management |
None / Low |
Counseling & DMP fees |
Licensed in Idaho |
| ClearOne Advantage |
Structured repayment plans & debt management |
$5,000 |
Performance-based |
Nationwide |
| Money Management International |
National nonprofit counseling & DMPs |
None / Low |
Counseling & DMP fees |
Online / Idaho |
| Accredited Debt Relief |
Major unsecured debt settlement |
$7,500 |
Performance-based |
Nationwide |
Highlighted Company Insights

New Era Debt Solutions — Best for people who reside in Idaho and have a high amount of credit card debt or personal loan debt. Their negotiation methods can lower balances remotely to help rural clients.
Thinking about choosing New Era for Debt support? Explore our expert review to learn what they offer and if they’re the right fit.

Century Support Services — An Idaho-licensed nonprofit that provides credit counseling and DMPs with reduced interest rates instead of aggressive settlements.

ClearOne Advantage — Offers structured repayment plans, along with flexibility in finding solutions for mixed unsecured debt, so the client can avoid bankruptcy when possible.
Money Management International — National nonprofit specializing in credit counseling and DMPs, with the added value of online accessibility to assure participation by even rural Idaho residents.

Accredited Debt Relief — Major unsecured debt settlement is the focus, with performance-based fees. It is nationwide, ensuring clients have wide access to a broad creditor network.
For additional context on debt settlement providers, see our JG Wentworth Debt Relief Review.
How to Choose the Right Idaho Debt Relief Program
Before signing up, local residents ought to think about:
- Overall unsecured debt sum — Large amounts of debt might require settlements; lesser amounts could be managed through DMPs or credit counseling.
- Monthly affordability — Most programs last 24–48 months.
- Credit impact — A few programs might lower the credit score in the short run.
- Provider reputation — Check customer feedback and verify that the provider is legally compliant.
- Remote access — A must-have for people living in the countryside of Idaho.
If you need further help, our Reprise Financial Review can help in comparisons of program types, fees, and results.
Common Mistakes Idaho Residents Make With Debt Relief
- Enrolling with insufficient debt to justify the program fees
- Looking forward to immediate credit score improvements
- Turning a blind eye to the contracts or disclosures signed
- Still using credit cards while being in the program
- Picking providers who don’t offer online accessibility
Tip: Rural Idaho residents should prioritize providers with robust internet and phone support.
Top Debt Settlement Companies of 2024
Explore top-ranked debt settlement companies and compare ratings, reviews, and key features to find the best fit for your needs.
Compare the 2024 Top Picks
How Does Average Debt Vary Across Idaho Cities?
| City |
Avg. Credit Card Debt |
Avg. Mortgage Debt |
Avg. Total Debt |
| Boise |
$6,800 |
$180,000 |
$186,800 |
| Coeur d’Alene |
$6,200 |
$150,000 |
$156,200 |
| Meridian |
$7,000 |
$175,000 |
$182,000 |
FAQs — Idaho Debt Relief Programs Explained
How long does it usually take for Idaho debt relief programs to work?
The majority of Idaho debt relief programs have a duration of 2 to 4 years, which depends on factors such as the amount of your total debt, how cooperative your creditors are, and your monthly contributions. If you plan your financing properly, you can refer to the Debt Relief Overview information and avoid unnecessary waits.
Are debt relief Idaho services safe and legal for the locals?
Absolutely. All Idaho debt relief businesses are obligated to adhere to federal consumer protection laws. By picking a licensed, well-governed company, you are taking the first step toward financial security and will be assured that the program is run in an open manner.
Does my credit score get negatively affected if I go for Idaho debt relief programs?
Debt settlement might cause your credit score to fall a bit temporarily, but mostly, Idaho debt relief programs that are like DMPs or credit counseling don’t really cause any credit damage at all, other than barely. Keeping up with a payment schedule means your credit is protected over the long haul.
What level of indebtedness does one need to have to be eligible for Idaho debt relief?
Generally, a program requires a minimum of $7,500–$10,000 worth of unsecured debt. Nonprofits can still offer counseling to clients operating with smaller balances. Take advantage of your free assessments, such as See If You Qualify, to guide you in choosing the best program to repay effectively without taking on additional financial risks.
Where do we draw the line of bankruptcy as a solution for Idaho residents?
Bankruptcy is mostly considered a last-ditch solution. In fact, most Idaho debt relief programs offer structured alternatives that have a lower long-term negative impact on one’s credit. You should only consider legal remedies if you are totally overwhelmed with your debts.
by Brandi Marcene | Jan 16, 2026 | Definitions
Although it is paradise on Earth, Hawaii, in 2026, is one of the priciest states to live in in America. Because of high rent and imported goods, many people are in debt from using credit cards and personal loans. This guide breaks down Hawaii-specific debt relief options and explains how they differ from states like Texas and California.
Why Is Debt Relief Different in Hawaii Compared to Other States?
Hawaii’s sky-high living costs—193.3 index—pile on credit card debt faster than mainland states like California or Texas. Remote islands mean fewer local offices, forcing reliance on nationwide programs. Discover tailored debt relief Hawaii options that slash balances 20-50% despite the “paradise tax.”
Here are a few key factors that shape the debt landscape in Hawaii:
Cost of Essentials
Hawaii’s residents are affected by the higher prices of daily necessary goods, which are caused by the long-distance transport of these goods. This practice sometimes compels the people living there to use a credit card to cover their expenses.
Housing Burden
Housing costs take a major part of the monthly salary, and the amount left for paying off debts is therefore less.
Limited Local Access
Maui, Kauai, or the Big Island do not have many physical offices; thus, the majority of the inhabitants depend on remote programs and national providers.
High Use of Credit
Often, using credit cards to pay for basic needs leads to increased balances of unsecured debts, which makes debt settlement or debt management plans (DMPs) more common occurrences.
Before we compare providers in detail, it’s helpful to understand the main types of debt relief programs Hawaii residents use.

Information taken from meric.mo.gov
What Types of Debt Relief Programs Are Available in Hawaii?
Hawaii residents often rely on different debt relief Hawaii options depending on debt type and income. For instance, in the case of high unsecured debt, debt settlement is an appropriate solution where the creditor negotiates the balance for a reduced fee as compared to the original balance.
Debt Management Plans help consumers by consolidating the monthly payments without reducing the balance. Another method is the credit consolidation loan. Credit counseling provides consumers with the knowledge needed. As a final resort, legal debt relief is applicable.
For a deeper overview of options, see our comprehensive guide here: Debt Relief Overview.
Which Debt Relief Program Is Right for Hawaii Residents?
| Program Type |
Best For |
Pros |
Cons |
Typical Duration |
| Debt Settlement |
High unsecured debt |
Reduces total debt owed |
May temporarily lower credit score |
24 to 48 months |
| Debt Management Plan (DMP) |
Medium debt, steady income |
Combines payments, lowers interest |
Balance not reduced |
24 to 60 months |
| Debt Consolidation Loan |
Fair credit, multiple debts |
One monthly payment |
Requires good credit |
12 to 36 months |
| Credit Counseling |
Low debt, budget issues |
Education, financial planning |
No direct debt reduction |
3 to 12 months |
| Bankruptcy (Legal) |
Overwhelming debt |
Stops collection calls, legal protection |
Long-term credit impact |
Varies |
Which Debt Relief Hawaii Companies Are Trustworthy in 2026?
Choosing the right Hawaii debt relief provider is crucial. Top picks serve all islands remotely, tackling high living costs with proven, tailored programs.
Top Hawaii Debt Relief Companies
| Company |
Best For |
Minimum Debt |
Fees |
Availability in Hawaii |
| New Era Debt Solutions |
Personalized debt settlement |
$10,000 |
Performance-based |
Nationwide |
| National Debt Relief |
High unsecured debt balances |
$7,500 |
Performance-based |
Nationwide |
| Accredited Debt Relief |
Multiple debt types |
$10,000 |
Performance-based |
Nationwide |
| Freedom Debt Relief |
Large, established programs |
$7,500 |
Performance-based |
Nationwide |
| CuraDebt |
Tax and business debt |
$10,000 |
Varies |
Nationwide |
Residents in Hawaii might find providers more appealing if their services don’t involve visiting their locations in person. New Era Debt Solutions is a company operating one hundred percent from a remote environment, and it covers all the islands with a customized way of settling debts, which is not common with large companies.
Learn more about New Era by checking out our review. 
Best for:
- $10,000+ in unsecured debt
- Credit card and personal loan balances
- Consumers who want individualized support
Not ideal for:
- Secured debt (auto loans, mortgages)
- Very small debt balances
If you’re weighing different debt relief options and want to see how New Era’s settlement program could work for your situation, you can use their free assessment tool to get a clear picture.
Explore a Free Consultation
2. National Debt Relief
One of the largest service providers in the country, National Debt Relief has both the scale and creditor relationships that benefit Hawaii residents dealing with large balances and multiple creditors.

Best for:
- High total unsecured debt
- Consumers needing a structured, long-term plan
- Those comfortable with a standardized program model
Not ideal for:
- Consumers seeking highly customized strategies
- Low-debt situations
3. Accredited Debt Relief
Accredited Debt Relief provides its users with flexibility across different debt types, which can be helpful for Hawaii residents who have to manage a mix of credit cards, medical bills and personal loans.

Best for:
- Mixed unsecured debt portfolios
- Residents want multiple settlement options
- Mid-to-high debt balances
Not ideal for:
- Individuals who only need budgeting help
- Secured or student loan debt
4. Freedom Debt Relief
With an infrastructure that spreads nationwide and years of experience, Freedom Debt Relief offers continuous support for Hawaii residents who prefer a well-established provider with extensive resources.

Best for:
- Large credit card balances
- Consumers seeking brand recognition
- Long-term settlement programs
Not ideal for:
- Those wanting short-term solutions
- Very small debt amounts
5. CuraDebt
CuraDebt is a practical option for Hawaii residents dealing with tax-related or business debt areas where many standard debt settlement companies do not specialize.

Best for:
- Tax debt or IRS obligations
- Small business owners
- Complex debt situations
Not ideal for:
- Credit card–only debt
- Consumers seeking nonprofit counseling
How Do I Choose the Best Debt Relief Hawaii Program?
To determine which debt reset option is best for you, there are considerations in relation to total unsecured debt, affordability, and future goals, which are significant and include:
- Type and amount of debt — High amounts may require settlement, and smaller amounts can use debt management plans or credit counseling.
- Program length and tuition — Know the costs and durations before pursuing.
- Credit effect — Some programs lower credit scores, while others do not. Provider reputation can be analyzed by reading the company reviews and checking the provider’s legal compliance.
For a full comparison of top-rated companies, see: 21 Best Debt Settlement Companies Ranked.
FAQ’s — Debt Relief Hawaii Programs Explained
How effective is debt relief for Hawaii residents given the high cost of living?
Debt relief Hawaii programs have the potential to bring great results, but careful planning is unavoidable, considering the “paradise tax” and the expensive housing in Hawaii. The citizens usually count on national companies that provide remote structured programs. The outcome is determined by the kind of debt, the total amount, and what one can afford to pay monthly.
Is Hawaii debt relief a legal and reputable option?
Yes. There are federal laws that the providers are to follow regarding consumer laws and protection. Always check for legitimacy and state approval if there are local offices involved via an authoritative review like our JG Wentworth Debt Relief review.
How long do Hawaii debt relief programs usually take?
Programs typically last 24 to 48 months, depending on debt amount, creditor cooperation, and monthly contributions. Planning for Hawaii’s higher living costs can help avoid delays or program dropouts.
How much debt do I need to qualify for Hawaii programs?
The majority of programs necessitate $7,500 to $10,000 in unsecured debt. Individuals with lesser amounts may get help from nonprofit counseling or debt management programs.
When is bankruptcy the right choice for Hawaii residents?
Filing for bankruptcy is the final option in the legal solutions. Credit is preserved, and long-term financial risk is lowered when residents go through structured programs first. Legal ways out are very important in situations of wage garnishment, lawsuits, or tax debts with the IRS.
by Brandi Marcene | Jan 16, 2026 | Definitions
Iowa locals are feeling the pinch from the rising costs, growing credit card balances, and medical bills that pile up faster than a monthly income.
According to recent data, the consumer price index rose again, with prices climbing both month-over-month and year-over-year, highlighting how inflation continues to strain household budgets. The Consumer Price Index Rises 0.3% In September and Hits 3.0% Annually.
Personal loans, student debt, and daily expenses are stressing household budgets, leaving many struggling to stay afloat. As per a survey, an average household carries an average total debt of $46,130, including credit of about $30,420, student loans, credit cards, and other debt.
This guide breaks down the top programs, how they operate, and which providers are most trusted in Iowa for 2026.
How Does Iowa Debt Relief Work for Residents?
Iowa residents can access programs tailored to different financial situations, just as residents in Arizona and Alabama, with most focusing on unsecured debt such as credit cards, medical bills, personal loans, and lines of credit.
Generally, the Iowa debt relief program aims to:
- Reduce what you owe through negotiation
What Debt Relief Programs Are Available for Iowa Residents?
Iowa locals have multiple debt relief options, depending on the debt type, amount, and personal financial stability. Each of the programs serves a different need and comes up with unique benefits and tradeoffs. Here’s a clear breakdown:
-
- What they do: Negotiate directly with customers to reduce the total amount owed.
- Who they’re for: Individuals with high unsecured debt who can’t repay the entire balance.
- How they work: Clients usually fund a specific account, and the settlement company negotiates with creditors. Fees are usually performance-based, which means they’re charged only after a successful settlement.
- Nonprofit Credit Counseling & Debt Management Plans (DMPs)
- What they do: Consolidate debt numbers into one manageable payment and often reduce interest rates.
- Who they’re for: Households having a stable income who want a structured repayment support without ever reducing balances.
- How they work: Clients get financial counseling, budgeting guidance, and may be enrolled in a DMP. Nonprofit fees are typically low, and the primary focus is on education and long-term financial health.
- Hybrid or National Programs
- What they do: Combine negotiation, counseling, and account management.
- Who they’re for: Locals in rural areas or those who are in need of services that aren’t locally available.
- How they work: Such programs offer a flexible solution that includes settlement, repayment plans, or a mix of both. They often scale nationwide, providing a broader support infrastructure.
Iowa Debt Relief Providers Worth Comparing
| Company |
Best For |
Minimum Debt |
Fees |
Availability in Iowa |
| New Era Debt Solutions |
Personalized debt settlement |
$10,000+ unsecured debt |
Performance-based |
Nationwide (Iowa included) |
| National Debt Relief |
High unsecured debt balances |
$7,500+ unsecured debt |
Performance-based |
Nationwide |
| Accredited Debt Relief |
Multiple unsecured debt types |
$10,000+ unsecured debt |
Performance-based |
Nationwide |
| Freedom Debt Relief |
Large, established settlement programs |
$7,500+ unsecured debt |
Performance-based |
Nationwide |
| Century Support Services |
Iowa-focused negotiation support |
Varies by case |
Performance-based |
Serves Iowa residents |
| APFSC (Nonprofit) |
Credit counseling & DMPs |
No strict minimum |
Low nonprofit fees |
Available in Iowa |
| InCharge (Nonprofit) |
Budgeting & debt management |
No strict minimum |
Low nonprofit fees |
Available in Iowa |
New Era Debt Solutions is seen as a leading option for Iowa debt relief, especially for residents seeking a hands-on, negotiation-focused approach. With more than two decades of experience in debt settlement, New Era focuses on reducing unsecured debt balances by negotiating directly with creditors to accept less than the full amount owed.
![]()
Is This Debt Relief Option Right for You?
Not every debt solution works for every situation. A free consultation can help determine whether New Era’s debt settlement approach aligns with your financial goals.
See If You’re Eligible
Ideal For
Iowa residents who are carrying more than $10,000 in unsecured debt and who want individual negotiation rather than a rigid, standard program.
How It Works
After a free financial evaluation, New Era designs a customized settlement strategy based on the client’s debt profile and cash flow. Clients fund a dedicated account over time, and negotiations begin once ample funds are available.
What Makes It Unique
New Era has built up a solid reputation; they have received great customer feedback and are recognized by the Better Business Bureau as a reputable debt relief company in Iowa.
![]()
Know How New Era’s Program Works?
If you’re exploring New Era’s debt settlement approach, which aligns with your financial situation, this in-depth review explains typical timelines, real-world outcomes, and key considerations to understand before enrolling.
See If You’re Eligible
National Debt Relief
National Debt Relief is one of the largest debt settlement providers in the country and serves many Iowa residents with significant unsecured debt balances.
Best For
Iowa residents with $7,500 or more in unsecured debt, including credit cards, medical bills, and personal loans.
How It Functions
Following a no-cost evaluation, National Debt Relief devises a structured payment plan and begins communicating with creditors on the client’s behalf.
How It Distinguishes Itself
Its scale, established systems, and large customer support infrastructure provide reassurance to clients who prefer a nationally recognized name when looking for national debt relief in Iowa.
Accredited Debt Relief
Accredited Debt Relief focuses on settlement-based solutions for clients when dealing with a range of unsecured debt types.

Best For
Iowa residents are managing multiple unsecured accounts, such as credit cards, personal loans, and revolving credit lines.
How It Works
The process begins with an in-depth consultation and financial review, followed by the creation of a customized settlement plan.
Why It Stands Out
Accredited Debt Relief’s commitment to transparency and consumer-focused practices makes it a reassuring option for individuals seeking clarity as they navigate Iowa debt relief programs.
Explore more about Accredited Debt Relief here.
Freedom Debt Relief
Freedom Debt Relief is one of the most well-known debt settlement companies in the United States and maintains a strong presence in Iowa debt relief searches. It’s structured for individuals dealing with large debt loads.

Best For
Iowans living with high unsecured debt balances who are searching for a trustworthy partner with a good track record.
How It Works
Once the complimentary evaluation is complete, clients are then assigned a certified debt consultant who can negotiate directly with creditors to secure reduced payoff amounts.
Why It Stands Out
Its nationwide footprint, extensive experience, and structured negotiation process make Freedom Debt Relief a common consideration within Iowa debt relief programs.
Century Support Services
Century Support Services offers debt settlement assistance with a focus on negotiation strategy and client education. While national in scope, it serves Iowa locals looking for the right balance between structure and flexibility.

Best For
Iowa residents seeking settlement support with ongoing guidance throughout the negotiation process.
How It Works
After evaluating the client’s unsecured debt, Century develops a settlement roadmap and negotiates with creditors as funds become available in the program account.
Why It Stands Out
The century’s emphasis on education and clear expectations helps clients better understand the mechanics of debt settlement while working toward resolution.
To better understand how leading providers stack up, explore our ranking of debt settlement companies based on customer feedback and industry credibility.
Frequently Asked Questions About Iowa Debt Relief
What does Iowa debt relief really consist of?
Iowa debt relief refers to a range of structured programs designed to help residents manage or resolve unsecured debt, such as credit card, medical bill, and personal loan debt.
Are debt relief programs in Iowa safe to use?
Legitimate Iowa debt relief programs operate in accordance with state and federal regulations, use transparent pricing, and clearly disclose fees. Most reputable providers charge performance-based or nonprofit fees only after progress is made.
What amount of debt is required to qualify for an Iowa debt relief program?
Most settlement-based Iowa debt relief programs require at least $7,500–$10,000 in unsecured debt to qualify. Nonprofit credit counseling and debt management plans often accept lower balances, especially for households with stable income seeking structured repayment rather than balance reduction.
Would debt relief in Iowa negatively affect my credit?
Some Iowa debt relief options, particularly settlement programs, may temporarily impact credit scores. However, many residents pursue relief to avoid defaults, collections, or legal action, which can cause more severe long-term damage.
Can I access national debt relief programs while living in Iowa?
Yes, many nationally recognized debt relief companies legally serve Iowa residents. These programs provide access to large support teams and multiple relief options.
by Brandi Marcene | Jan 16, 2026 | Definitions
For many residents in Kansas, debt problems don’t rise overnight. Credit cards pile up, medical bills linger, and short-term loans often stretch into long-term obligations. When monthly payments start competing with groceries, choosing the right Kansas debt relief program becomes essential. Solutions like New Era Debt Solutions, National Debt Relief, and Freedom Debt Relief offer residents options to reduce balances, reorganize repayment, or access legal guidance, helping Kansans take control of their finances before debts spiral further.
Locals face numerous debt levels, with an average person carrying almost $45,300 in total debt, which includes mortgages, student loans, credit cards, and auto financing as of 2024.
This guide explains how debt relief in Kansas works, compares the most common programs and companies, and helps you decide which route makes the most sense for your situation before costly mistakes are made.
Why Do Debt Relief Options Work Differently in Kansas?
The unique financial characteristics of Kansas include a very high percentage of families with middle-class incomes (the median income is approximately $52,081), meaning many families earn enough to be self-sufficient, but not enough to financially weather periodic downturns in the economy.
Due to these financial challenges, Kansans have two types of debt relief programs available to them:
- “Programs that offer assistance through negotiation to reduce outstanding balances” and
- “Programs that provide assistance to restructure the way payments are made to the lender of record without reducing the principal.”
What Types of Debt Relief Options Are Available in Kansas?
Before comparing providers, what types of debt relief are available in Kansas? Among many options, here are the ones that you can consider based on their approach.
| Debt Type |
Recommended Relief Approach |
Why It Works |
Notes / Considerations |
| Credit Card Debt |
Debt Settlement |
Diminishes the total balance with negotiations |
Ideal for $7,500+ unsecured debt |
| Personal Loans |
DMP or Settlement |
Negotiates a lower payoff |
Depends on repayment ability |
| Medical Bills |
Settlement |
Reduces bills, usually with nonprofit assistance. |
Check for hospital or clinic-specific programs |
| Payday or Title Loans |
Nonprofit / Legal Assistance |
Restructures high-interest loans. |
Catholic Charities Loan Pool Project |
| Legal Action |
Legal Debt Relief |
Protects assets and ensures compliance |
Requires attorney involvement. |
Debt Relief Programs Available to Kansas Residents
Below is a comparison of reputable programs and services commonly used for Kansas debt relief.
Kansas Debt Relief Provider Comparison
| Company / Program |
Best For |
Minimum Debt |
Fees |
Availability in Kansas |
| New Era Debt Solutions |
Personalized debt settlement |
Ten thousand dollars in unsecured |
Performance-based |
Nationwide (Kansas included) |
| National Debt Relief |
Large unsecured balances |
Seven thousand five hundred dollars |
Performance-based |
Nationwide |
| Accredited Debt Relief |
Multiple unsecured debt types |
Ten thousand dollars |
Performance-based |
Nationwide |
| Freedom Debt Relief |
Established settlement programs |
Seven thousand five hundred dollars |
Performance-based |
Nationwide |
| APFSC (Nonprofit) |
Credit counseling & DMPs |
No strict minimum |
Low nonprofit fees |
Kansas residents |
| InCharge Debt Solutions |
Budgeting & DMPs |
No strict minimum |
Low nonprofit fees |
Kansas residents |
| Catholic Charities Loan Pool Project |
Payday & title loan relief |
Varies |
Program-based |
Local Kansas programs |
| Debt Relief Attorney (Kansas City) |
Legal & bankruptcy solutions |
Varies |
Attorney fees |
Kansas City metro |
New Era Debt Solutions is a well-reputed provider offering Kansas debt relief through customized debt settlement strategies. Rather than enrolling clients into templates, New Era assesses every individual profile to determine a realistic settlement target. For an enhanced review, timelines, and the real-world outcomes. 
![]()
Check If You Qualify
Wondering if New Era’s debt settlement program fits your situation? A free consultation can help you assess eligibility with no obligation.
Check Your Eligibility
Best For
For the locals having more than $10,000 in unsecured debt, who need structured negotiations with support rather than repayment-based plans.
How It Works
Once after a free consultation, clients then fund a specific account while the New Era negotiates with the creditors to reduce their balances. Fees are charged after a successful settlement.
Why It Stands Out
New Era’s focus on personalization and transparency makes it the best-suited option among major debt relief programs in Kansas, where residents consider reducing their debt balance as the priority.
![]()
See How New Era Could Impact Your Debt
Curious if New Era’s debt settlement approach is right for you? Our detailed review breaks down timelines, real-world results, and what to expect before enrolling.
Read the full New Era review.
National Debt Relief
National Debt Relief Kansas, as the biggest settlement company, has the most favorable services for people who are ineligible for large loans but have considerable unsecured debt.
Best For
Homeowners who are trying to refinance their homes and don’t mind paying slightly higher APRs.
How It Works
Clients complete a free assessment, then follow a structured settlement plan as funds accumulate and negotiations occur.
Why It Stands Out
Scale, experience, and a clear performance-based fee structure make it a familiar option for many households.
Explore more about National Debt Relief here.
Accredited Debt Relief
Accredited Debt Relief focuses on helping clients to resolve multiple types of unsecured debt through negotiated settlements.
Best For
For the local managing multiple unsecured accounts with different lenders.
How It Works
Once enrolled, an accredited negotiator directly negotiates with creditors while clients set aside monthly funds.
Why It Stands Out
Its emphasis on ethical communication and transparency appeals to those cautious about settlement programs.
Further read about Accredited Debt Relief for more clarification.
Freedom Debt Relief
Freedom Debt Relief is one of the longest-running settlement providers in the U.S and remains a common option for debt relief for Kansas residents.
Best For
Individuals with large debt balances who prefer an established provider with extensive resources.
How It Works
Certified debt consultants manage negotiations once clients complete a financial review.
Why It Stands Out
Nationwide reach and structured processes make Freedom a familiar name in settlement-based relief.
Read more about Freedom Debt Relief here.
Nonprofit Debt Relief Options in Kansas
APFSC (American Personal Financial Services Council)
APFSC offers nonprofit credit counseling and debt management plans designed to simplify repayment and reduce interest costs.
Best For: Residents who can repay principal but need relief from high interest and late fees.
InCharge Debt Solutions
InCharge provides counseling, budgeting assistance, and DMPs for Kansas residents seeking structured repayment without settlement.
Best For: Households looking for predictability and education-based financial recovery.
Catholic Charities Loan Pool Project
This Kansas-based initiative focuses on refinancing predatory payday and title loans into manageable repayment plans.
Best For: Residents are trapped in high-interest short-term lending cycles.
If you’d like to explore more options and see how they compare, start with our guide to the top debt settlement companies, ranked by ratings and reviews.
How to Choose the Right Debt Relief Path in Kansas
Before enrolling in any program, ask yourself:
- Is my debt mostly unsecured?
- Can I realistically repay the principal, or do I need a reduction?
- Am I facing legal action?
- How stable is my income?
FAQs
Is Kansas debt relief real?
Yes, Kansas debt relief is legitimate when provided by reputable companies or nonprofit organizations that follow state and federal regulations. These programs are designed to help residents manage, negotiate, or consolidate their debt. Always verify credentials before enrolling.
How much debt do I have to have to qualify?
Debt settlement programs in Kansas generally require $7,500–$10,000 in unsecured debt, such as credit cards, personal loans, or medical bills. Nonprofit counseling or debt management plans may accept lower balances. The eligibility depends on your financial situation, income, and the type of debt relief program you are considering.
Will my credit score go down because of debt relief?
Some debt relief methods, especially settlements, can temporarily lower your credit score. However, many residents opt for these programs to prevent defaults, collections, or lawsuits that could cause long-term credit damage.
Are national programs also available in Kansas?
Yes, several nationally recognized debt relief companies operate legally in Kansas. These programs provide nationwide services, often including settlement, counseling, and debt management
Can I apply a debt relief service to my medical bills?
Absolutely. Medical debt is one of the most common types of unsecured debt addressed through both settlement and nonprofit counseling programs. Hospitals, clinics, and lenders may participate in negotiated repayment or reduction programs, helping residents manage balances without derailing monthly budgets or causing additional financial stress
by Brandi Marcene | Jan 16, 2026 | Definitions
Rising credit card balances, creeping up medical bills, and unexpected personal loans are putting increasing pressure on Indiana households. Locals in Indianapolis, Fort Wayne, or smaller towns are feeling the squeeze, struggling to keep up with the payment while managing day-to-day expenses.
Fortunately, reputable providers like New Era Debt Solutions offer structured programs to help locals reduce balances, restructure payments, and regain control of their finances. Whether you need settlement negotiations, debt management support, or nonprofit assistance, Indiana debt relief programs offer options tailored to your situation.
What Is the Indiana Debt Relief Program?
Indiana debt relief is a great way for residents to manage and reduce debt through structured programs approved or known in the state. It’s not just about negotiating with the creditors; it’s about working within Indiana’s legal structure to protect consumers while providing real applications.
People typically seek Indiana debt relief programs when facing:
- Mounting credit card debt with high interest rates
- Medical bills that have grown unmanageable
- Personal loans or payday loans with escalating fees
Types of Indiana Debt Relief Programs
Here’s a breakdown of the most common options available and offered to Indiana residents:
1. Debt Settlement Programs
Debt settlement programs negotiate with creditors to reduce the total balance owed. Participants in Indiana debt relief programs save money by settling debts for less than what’s owed, usually paying a lump sum after a structured savings plan. Such programs are ideal for those who have unsecured debt and can temporarily set some funds aside for negotiations.
See how the top 21 debt settlement companies compare, based on ratings, reviews, and real-world performance.
2. Debt Management Plans (DMPs)
Certified Credit Counselling Agencies provide a consolidated payment plan known as a Debt Management Plan. The DMP consolidates all debts into a single payment and reduces interest rates, making payments easier to manage.
3. Credit Counseling Services
Credit couseling focuses primarily on education and planning. Individuals receive guidance on budgeting, repayment strategies, and avoiding future debt pitfalls. Most of these programs foster counselling with optional DMPs, letting participants have knowledge and the practical solutions.
4. Bankruptcy Options
For some, bankruptcy is the most viable form of Indiana debt relief; chapter 7 and chapter 13 filings in Indiana comply with state-specific rules, which offer legal protection from creditors. While it should be seen as a last resort for debt consolidation loans, bankruptcy can give a new start and shield participants from ongoing collection actions.
How Can I Apply for an Indiana Debt Relief Program?
Applying for an Indiana debt relief involves preparation, research, and careful decision-making. Residents should follow these steps:
- Analyze Your Financial Status – Collect statements from credit cards, loans, and all bills in order to gain a comprehensive perspective of your credit history.
- Find Service Providers – Research and locate any Indiana debt relief companies that provide services and are licensed or accredited through the State of Indiana.
- Look at Types of Programs – Determine which option(s) would work best for your specific situation and how you want to handle your debt (settlement, management, counseling, or bankruptcy).
- Complete an Application – In order to create a customized debt management plan based on your unique financial position, submit an application with all relevant details regarding your current financial condition.
- Read All Terms – Before signing any contract with an Indiana Debt Relief Company, review all the terms and conditions carefully to make sure you fully understand what you are signing and agree with all aspects of the contract.
Indiana Debt Relief Providers at a Glance
| Company |
Best For |
Minimum Debt |
Fees |
Availability in Hawaii |
| New Era Debt Solutions |
Personalized debt settlement |
$10,000 |
Performance-based |
Nationwide (HI included) |
| National Debt Relief |
High unsecured debt balances |
$7,500 |
Performance-based |
Nationwide |
| Accredited Debt Relief |
Multiple debt types |
$10,000 |
Performance-based |
Nationwide |
| Freedom Debt Relief |
Large, established programs |
$7,500 |
Performance-based |
Nationwide |
| CuraDebt |
Tax & business debt |
$10,000 |
Varies |
Nationwide |
New Era Debt Solutions is widely known as a strong option for Indiana debt relief due to its personalized approach to negotiating with creditors. With more than two decades of experience, New Era focuses mainly on debt settlement, helping clients to reduce what they actually owe by negotiating with their creditors to accept a smaller amount as complete payment.
![]()
Understand New Era’s Debt Settlement Process
This detailed overview walks you through how the program works and important factors to consider before deciding if it’s the right solution for your financial needs.
Ideal for
Locals with an unsecured debt looking for individualized negotiation support rather than a standard program.
How it works
After getting a free evaluation, New Era creates a specific plan and works directly with creditors, usually without upfront fees. You fund a dedicated account over time, and then negotiations take place.
What makes it unique
They are recognized by the Better Business Bureau and have received lots of positive feedback from their clients.
National Debt Relief
National Debt Relief is one of the largest debt settlement companies in the United States, known for handling clients with high unsecured debt balances. It’s based on a performance-based program, which means you pay fees once the negotiation is settled.

Best For
Indiana locals have $7,500 or more in unsecured debts, such as credit cards or personal loans.
How it functions
Once after a free debt assessment is completed, National Debt Relief creates a plan, negotiates with your creditors, and settles debts once the funds are available.
How it distinguishes
Its experience and expertise in the sector have built trust in its procedures among a large number of users. The combination of clear-cut pricing and a vast customer support team makes this the first choice for those who value tried-and-tested settlement systems.
Explore more about National Debt Relief here.
Accredited Debt Relief
Accredited debt relief focuses on helping clients with different types of unsecured debts, offering settlement negotiation that focuses on lowering balances and reducing the overall repayment burdens.
Best For
Indiana residents who are looking for settlement support across a mix of credit cards, personal loans, and lines of credit.
How It Works
Initial consultation and assessment, followed by plan creation and direct negotiation with creditors.
Why It Stands Out
As the name suggests, Accredited Debt Relief emphasises ethical practices and transparent communication, which can be reassuring when exploring debt relief options.
Freedom Debt Relief
Freedom Debt Relief is one of the largest and most commonly known debt settlement companies in the country. Their process is performance-based, and they work with clients who have significant unsecured debt.
Best for
Individuals who are stuck with large unsecured debt balances are looking for an established provider with a long track record.
How it works
Once a complimentary evaluation is completed, Freedom assigns certified debt consultants who work with your creditors to negotiate for the reduced payoff amounts.
Why It Stands Out
Its nationwide footprint, extensive experience, and free initial evaluations make Freedom a strong consideration in Indiana debt relief programs, especially for people who need significant negotiation support.
CuraDebt
CuraDebt specializes in handling tax debt and business‑related liabilities in addition to unsecured consumer debt. Unlike some performance‑based companies that focus only on personal credit card debt, CuraDebt can be a go‑to for residents dealing with more complex financial situations.
Best For
Indiana residents with tax debts or business‑related arrears, alongside traditional unsecured debt.
How It Works
CuraDebt offers personalized consultations, often followed by tailored strategies that can include negotiation, settlement, or structured repayment.
Why It Stands Out
Its ability to address tax debts and business liabilities sets it apart when individuals face a mix of financial obligations beyond standard consumer debt.
FAQ
Can I qualify for an Indiana debt relief program if I’m behind on bills?
Many Indiana debt relief programs widely accept applicants who are behind on their payments, including credit card bills, personal loans, and medical debt. Each of the program assess your financial situation individually, so even when you’re struggling, you can still access a structured solution to reduce and manage your debt responsibly
What kinds of debts are suitable for Indiana debt relief programs??
Indiana debt relief programs typically address unsecured debts such as credit cards, personal loans, medical bills, and certain lines of credit. Settlement programs focus on reducing balances, while debt management plans may help restructure payments.
How long does it take to complete debt relief in Indiana?
The timeline varies depending on the program. Debt management plans usually take 3–5 years, debt settlement programs typically last 2–4 years, and bankruptcy timelines depend on whether it’s Chapter 7 or Chapter 13.
Are there any free Indiana debt relief programs?
Yes. Some nonprofit organizations, such as GreenPath Financial Wellness, offer free or low-cost credit counselling and debt management services in Indiana. These programs focus on budgeting guidance, repayment planning, and education.
by Alex Demolitor | Jan 13, 2026 | Definitions
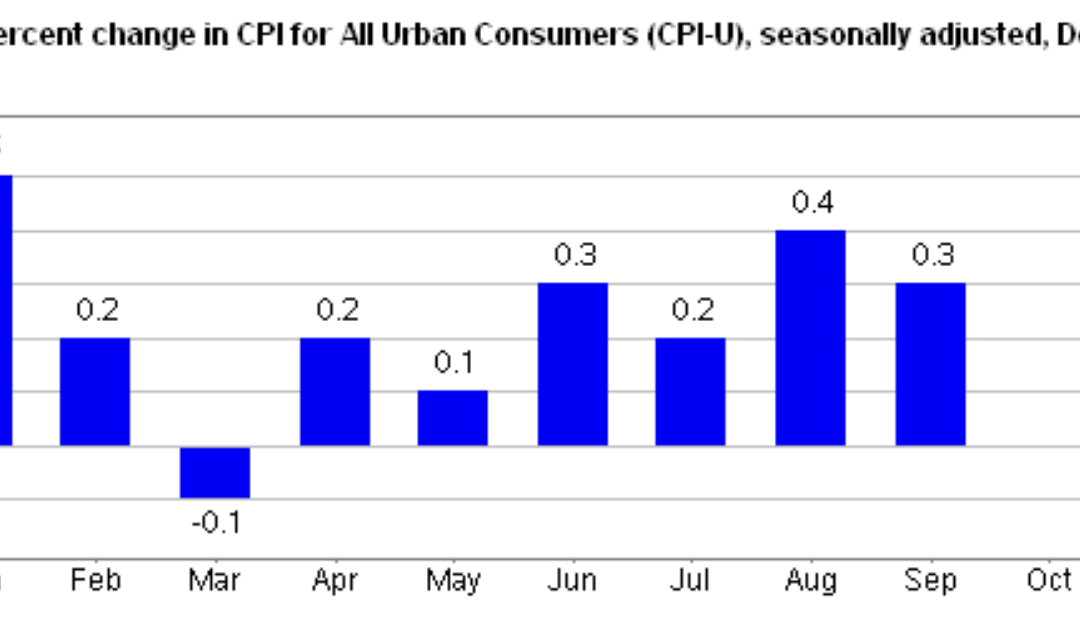
The December 2025 Consumer Price Index of All Urban Consumers (CPI-U) report indicates that inflation increased by 0.3% this month, up from the 0.2% average over the last two months. These data were released at 8:30 am EST on January 13, 2026, by the Bureau of Labor Statistics (BLS). Before seasonal adjustment, the year-over-year (Y-o-Y) inflation rate in the all-items index grew by 2.7%, matching the recent two-month average.
Today’s core results also missed economists’ consensus estimates. The table below is courtesy of Investing.com. The left column represents December’s figures, while the right column represents forecasters’ expectations. As you can see, the red metrics highlight how core inflation was weaker than anticipated.

With Fed Chairman Jerome Powell still leading the FOMC until his term ends later this year, he reiterated in December that he’s in no hurry to cut rates. And with investors pricing in little to no chance of a rate cut in January, Bloomberg reported on Jan. 9 that “Bond traders maintained an outlook for two rate cuts overall in 2026, with the first seen by mid-year.”
As a result, disappointing economic data will likely be required for accelerated easing over the next few months.

Food Prices
The food index rose by 0.7% MoM in December, and five of the six major grocery indices increased this month.
- Cereals and bakery products (+0.6%)
- Meats, poultry, fish, and eggs (-0.2%)
- Dairy and related products (+0.9%)
- Fruits and vegetables (+0.5%)
- Nonalcoholic beverages (+0.4%)
- Other food at home (+1.6%)
The food away from home index also jumped by 0.7%, as restaurant inflation kept pace with grocery prices in December.
Energy Prices
The energy index increased by 0.3% MoM in December, with gasoline prices down by 0.5%, electricity down by 0.1%, and natural gas rising by 4.4%.
Core CPI
The December core CPI rose by 2.6% Y-o-Y, matching the average figure from the previous two months. As a reminder, the October CPI report was cancelled due to the government shutdown, so the metrics don’t have comparable MoM data from November.
- Shelter index: (+0.4%)
- Rent index: (+0.3%)
- Owners’ equivalent rent: (+0.3%)
- Motor vehicle insurance: (NA)
- Medical care services: (+0.4%)
- Physician services: (+0.3%)
- Hospital services: (+1.0%)
- Airline fares: (5.2%)

Seasonally Unadjusted CPI
Before seasonal adjustments, the CPI-U for December 2025 increased by 2.7% Y-o-Y to an index level of 324.054. Since these figures are unadjusted, they include regular seasonal price fluctuations that can create volatility in the results.
Let the Good Times Roll
With solid economic data pointing to steady economic activity, the FOMC can continue its wait-and-see approach and not rush further rate cuts.
For example, the BLS released its Employment Situation report on Jan. 9. The U.S. economy added 50,000 net new jobs, and the unemployment rate declined to 4.4%. Furthermore, average hourly earnings (a proxy for wage inflation) increased from 3.6% Y-o-Y in November to 3.8% Y-o-Y in December. Consequently, the labor market remains on solid footing for the time being.

As further evidence, the BLS released its Job Openings and Labor Turnover Summary (JOLTS) on Jan. 7. And with more than seven million job openings still available, the metric (the blue line below) has stabilized near its pre-pandemic baseline. Likewise, layoffs and discharges (the green line below) also remain in a healthy range and highlight how most employers continue to retain staff.

Finally, the Atlanta Fed updated its Q4 GDPNow model on Jan. 9. And while the results can be skewed by fluctuating imports and exports, and the data is lagged, the latest reading pegs growth at 5.1% (the green line below). If realized, the results would be well above 2% trend growth and economists’ consensus estimates (the blue line below).

Add it all up, and the recent data is strong enough to suppress any rate-cut calls, and the FOMC should continue to preach the same message until weaker data forces its hand.
Turning to the financial markets, gold had a tremendous 2025, and the fundamentals support more strength in 2026.

To explain, the orange line above tracks the 5-year rolling percentage change in the gold price, while the blue line above tracks the 5-year rolling percentage change in global military spending. As you can see, the yellow metal lives up to its safe-haven reputation when the geopolitical outlook becomes more treacherous.
To that point, U.S. President Donald Trump has advocated for a 50% increase in the U.S. military budget, in what he called “very troubled and dangerous times.” As a result, the spending trend should continue, and the developments are bullish for gold.
Are you thinking about diversifying into precious metals? Talk to your financial advisor about initiating a gold IRA account today, allowing you to invest in this red-hot asset on a tax-advantaged basis. Additionally, our complimentary CPI inflation calculator remains at your disposal, enabling you to assess inflation’s impact on your finances. Please seek the guidance of a financial advisor before making any investment decision.
Furthermore, if you’re looking to diversify your portfolio or strategically exit a business, there are several strategies to help realize the best valuation. Our extensive guides for company owners in Illinois, Michigan, and Ohio provide insights into compliance issues, tax plans, demand assessments, and much more.
In addition, please consult our list of debt management firms for other financial services in your area.