Andrew
Andrew McCarthy is an expert in all things inflation. He has a Bachelors in Economics and has been working in the finance industry for over two decades.
by Andrew | May 22, 2015 | Definitions
CPI for April came in broadly inline with market expectations with core inflation (ex Food and Energy) rising +0.3% MoM vs expectations of +0.2%. Broader CPI rose +0.1% bang inline with market forecasts. Annualized figures show a persistent deflationary trend, declining -0.2% YoY inline with analyst forecasts. Weekly earnings may well draw the Fed’s attention, with the data showing significant signs of improvement rising +2.3%. Combined with the positive jobs numbers of late, the employment situation does seem to be gathering steam.
Energy prices declined across the board, falling -1.3% MoM and -19.4% YoY. Gasoline fell -1.7% and Fuel Oil posted a decline of -8.4% MoM.
In a worrying continuation of last month’s data, medical prices surged +0.7% MoM and was the highest contributor to the Core inflation figure.
The slightly than higher Core CPI numbers are causing a sharp spike in the Dollar Index post announcement, however the relatively benign number combined with the slowdown in nearly all major economic indicators over the past month are likely to reduce the possibility of any potential rate hike at the Fed’s upcoming June policy meeting. Markets are awaiting Fed chief Yellen’s commentary later today for any revised signal in rate expectations.
Economic Indicators have been weak across the board
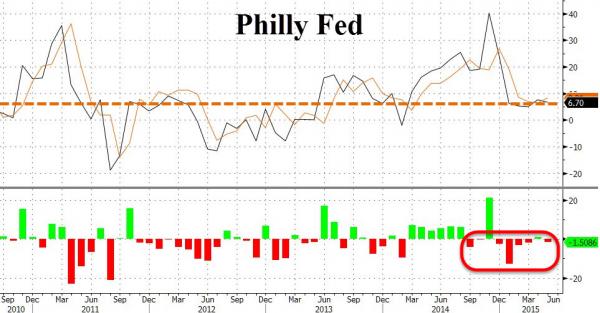
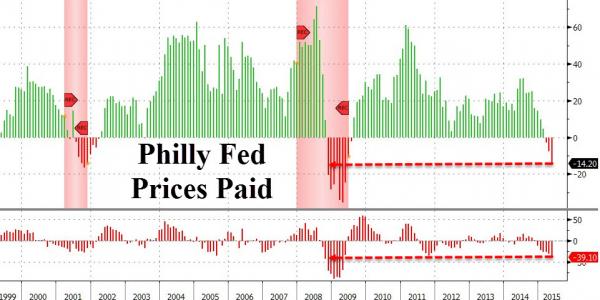
Philly Fed
Recent data from the Philly Fed indicate a slowdown in the manufacturing sector with the index posting further declines in May, posting a 6.7 print versus 8.0 consensus estimates. Despite a brief bounce in April, the index has now missed expectations for 7 out of the past 9 months and is growing reflection of the malaise starting to creep into the real economy. Prices paid for new orders plunged at an alarming pace, with declines also present in the average workweek.
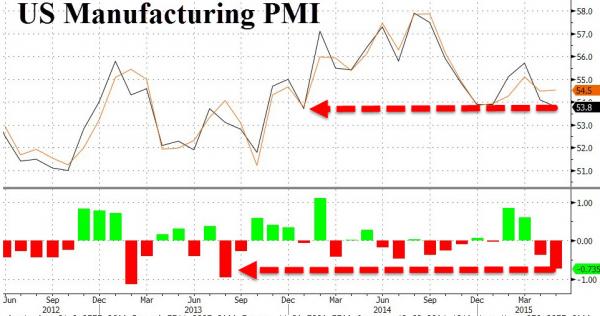
PMI
The Markit US Manufacturing PMI survey released earlier this week reinforces the evidence of further weakness creeping into the manufacturing sector. May PMI data slowed to 53.8 versus expectations of 54.5, and extends the weakness of the April data which registered the biggest miss of expectations on record. Manufacturing PMI is now at it lowest level in over a year when the US was gripped in the middle of severe winter weather. PMI weakness is a growing trend across the world, with European, and Chinese surveys all pointing in a similar direction.
The strong dollar has been attributed with causing most of the headwinds for the manufacturing sector and is likely to be a concern for policy makers going forward. Declining export sales highlight further problems with the strong dollar, with US data falling for the past two consecutive months. April also saw the first rise in input costs for 2015, as the rebounding crude oil price began creeping into production costs.
Given the impact the stronger dollar is having on the broader economy, the Fed is likely to adopt a cautious approach going forward, and will likely increase commentary around the impact the relative strength of the currency is having going forward. Rate hikes in the near future would likely exacerbate problems in the export and manufacturing sector, and the Fed will be keeping this in mind at the June policy meeting.
FOMC Minutes paint a mixed picture for rate hikes going forward
The minutes from the last policy meeting released earlier this week reflected growing concern about current bond market volatility, and over extended valuations in the stock market. Examining the minutes in detail reveals a more proactive stance by the Fed in trying to jawbone the equity markets onto a more sustainable path without having to use the threat of an actual rate hike.
Some of the more noteworthy commentary includes:
In their discussion of financial market developments and financial stability issues, policymakers highlighted possible risks related to the low level of term premiums. Some participants noted the possibility that, at the time when the Committee decides to begin policy firming, term premiums could rise sharply—in a manner similar to the increase observed in the spring and summer of 2013—which might drive longer-term interest rates higher. In this connection, it was suggested that the tendency for bond prices to exhibit volatility may be greater than it had been in the past, in view of the increased role of high-frequency traders, decreased inventories of bonds held by broker-dealers, and elevated assets of bond funds.
A few anticipated that the information that would accrue by the time of the June meeting would likely indicate sufficient improvement in the economic outlook to lead the Committee to judge that its conditions for beginning policy firming had been met. Many participants, however, thought it unlikely that the data available in June would provide sufficient confirmation that the conditions for raising the target range for the federal funds rate had been satisfied, although they generally did not rule out this possibility. Participants discussed the merits of providing an explicit indication, in postmeeting statements released prior to the commencement of policy firming, that the target range for the federal funds rate would likely be raised in the near term. However, most participants felt that the timing of the first increase in the target range for the fed-eral funds rate would appropriately be determined on a meeting-by-meeting basis and would depend on the evo-ution of economic conditions and the outlook. In keeping with this data-dependent approach, some participants further suggested that the postmeeting statement’s description of the economic situation and outlook, and of progress toward the Committee’s goals, provided the appropriate means by which the Committee could help the public assess the likely timing of the initial increase in the target range for the federal funds rate.
On balance, April CPI has gone some way in postponing any imminent rate hike which could have some bearing on the USD in the coming days and weeks. Yellen’s commentary later today will prove crucial for market sentiment. We stay tuned.
by Andrew | May 17, 2015 | Definitions

Aggressive monetary policies focused on stimulating economic growth in the face of the deflationary environment which has been in full swing since the financial crisis of 2008 have been the bedrock of the current economic system for nearly a decade. The Federal Reserve initiated its QE program with the direct aim of averting the severe deflationary effects which were occurring throughout the American economy and as a last gasp measure to help shore up the banking system which was teetering on the brink of failure following the multi billion dollar losses incurred from subprime mortgages. 7 years on, the Fed has only just exited from its bond buying program leaving a considerable growth in both its balance sheet and the overall money supply within the economy.
How does QE work?
Despite QE being such a prominent component of the financial landscape it is still a relatively misunderstood concept. Although most investors are aware of the consequences QE has had on the investment environment, many still remain unclear on the internal mechanics of how the QE process works.
QE is often referred to as a “money printing” program – and in some ways this image remains the best way to understand what the central bank is trying to do.
Firstly it’s important to clarify, money printing does not refer to the physical printing of cash or bank notes which the central bank is then tasked with arbitrarily dropping from helicopters or delivering to commercial banks via armored delivery trucks. In the modern economy – quantitative easing occurs through a more subdued digital form. Central banks create money by purchasing assets from the private sector in order to inject more money into the economy. The most conventional form of asset purchases is buying government bond portfolios from commercial banks. In the United States, there are several “Primary Dealers” which are responsible for dealing in bonds directly with the government. These dealers comprise of the usual big banks including Citibank, JP Morgan, Morgan Stanley, Goldman Sachs and Bank of America. The primary dealers are in effect, middlemen who buy bonds issued directly from the US Treasury, and then in turn selling them to investors both domestically and internationally – primary dealers in this respect are an important cog in the government’s spending machine. Besides selling these bonds to investors, commercial banks also hold government bonds on their own books as interest generating assets as part of their overall portfolio. These three actors, the government, the Fed, and the primary dealers then engage in a series of transactions in order start the QE ball rolling.
The QE Transmission Mechanism

The transmission of QE throughout the economy happens in a series of steps between all of the relevant institutions including the Fed, Treasury, commercial banks, and investors.
- Step 1: Government issues debt in the form of treasury bonds (the proceeds are used to finance various government spending)
- Step 2: Primary Dealers purchase this debt directly from the government with the aim of selling it onto both domestic and international investors. The primary dealers will also hold bonds on their books as part of their own investment portfolios.
- Step 3: As part of their commitment to inject more money into the economy – the Federal Reserve will buy bonds back off the primary dealers. Having depleted their bond inventory by selling to the Federal Reserve, the Primary Dealers are then free to purchase more bonds from the government. The money created during this process is known as “Base Money”. The Fed can directly control the creation of base money but the commercial banks control how this money enters the economy through a process known as fractional reserve banking.
- Step 4: Commercial banks have a dual function of accepting deposits and making loans. The amount of loans banks can offer depends upon the reserve ratio requirement of the Federal Reserve. At the moment the reserve requirement is set at 10% which means that for every $1 dollar the bank has on its books as deposits,it can lend $9 to individuals and businesses. Commercial bank lending therefore, has huge potential to boost the money supply within the economy.
By analyzing the 4 steps of QE in detail, we can see that the system is a complex series of transactions and interactions between the Government, the Federal Reserve and commercial banks. One of the main criticisms of QE so far has been the failure commercial banks to provide enough loans for productive parts of the economy. Loan growth has been primarily centered in areas such as education, and refinancing loans to large corporations. The transmission mechanism has failed in providing a large enough jolt in consumer and small business credit growth capable of boosting economic growth. Although the Federal Reserve has been in taper mode since October 2014, other central banks around the world have stepped in to make up the slack. The ECB and Bank of Japan are engaged in sizeable QE programs of their own and the concept looks set to be part of the economic and investment landscape for the foreseeable future.
by Andrew | May 5, 2015 | Definitions

Financial commentary and analysis is usually heavily peppered with “since Lehman” or “Post-Lehman” comparison statistics and conjecture. 2008 were some of the darkest days ever for financial markets; the losses worldwide were truly staggering and we are still wrestling with the consequences of this epic event to this day.
The world has changed a great deal since Lehman closed its doors – the financial world in particular has changed. The policy response from governments and monetary authorities around the world were amongst the most aggressive monetary policy moves of the modern era. As a result, we are now living in the midst of a giant financial experiment with all the theories, uncertainty, fear, greed and hope associated with finance jostling for equilibrium.
The Federal Reserve and other central banks throughout the world have been engaged in loose monetary policy, quantitative easing, ZIRP, and NIRP without issue despite the dire warnings of opponents who see the surge in the money supply as the precursor to rampant inflation and a hyperinflationary currency collapse. These fears for the most part have not transpired. Inflation has remained subdued through this period, and a lot of head scratching has ensued.
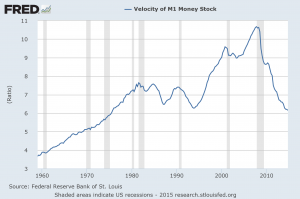
We are in uncharted territory, but there can be no argument about some of the major economic themes that have transpired “Post-Lehman” – the most astounding of which has been a complete collapse in the velocity of money throughout the economy. This metric above all others, helps explain why the expansionary monetary policy regimes throughout the world have managed to avoid triggering bouts of high inflation. The low velocity of money statistics also reveal just how fractured the economic recovery has been in the United States – where the exuberant valuation levels of financial markets are not borne out by developments in the real economy.
What is the velocity of money?
The velocity of money refers to how fast money circulates within the economy from one person to the next. Velocity of money is an important tool for gauging the rate at which money within the economy is used for purchasing goods and services. Analysts will often take the velocity of money as part of their consideration when determining how well the overall economy is performing. A high velocity of money indicates an active economy, and by consequence, is likely performing well. A low velocity of money will usually cause alarm bells to start ringing for economists. Low velocity of money is usually the precursor of slower growth and the onset of deflationary conditions.
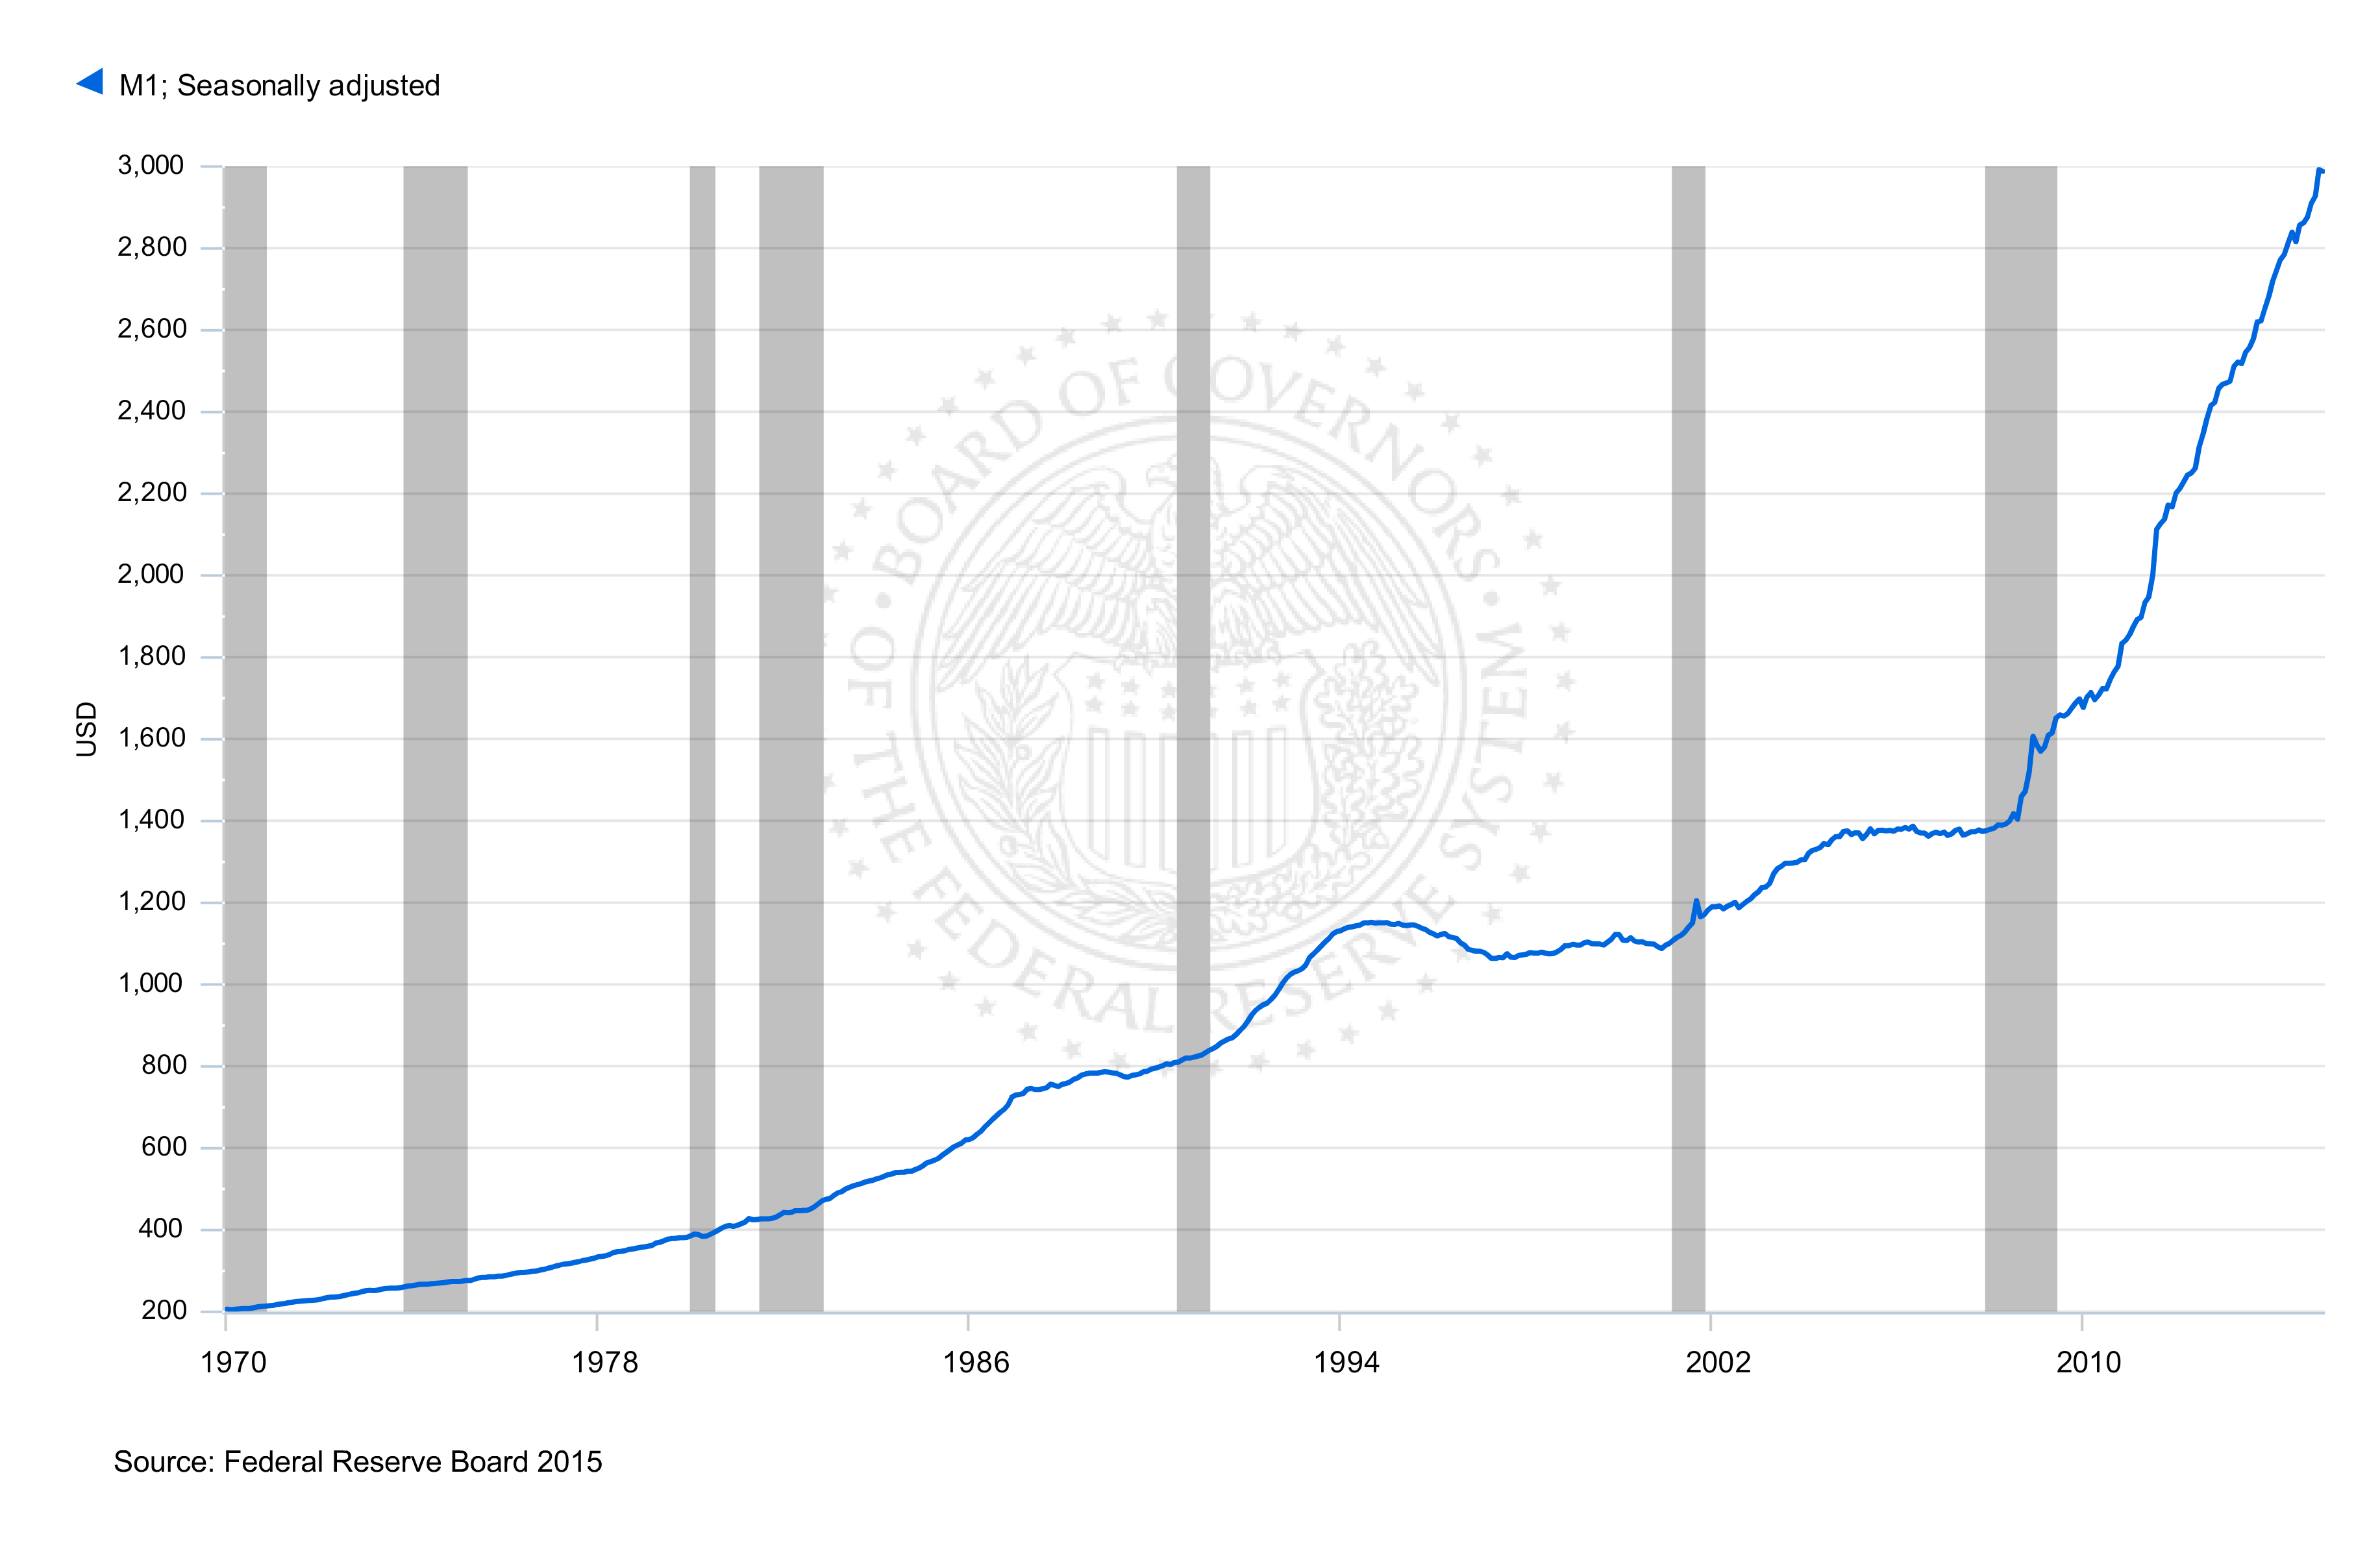
Another element we need to take into consideration is the overall money supply of the economy. The money supply has many different measures, but economists usually narrow these down into two distinct measures known as M1 and M2.
The M1 definition refers to the most liquid assets in the economy, namely cash and checking deposits. M2 broadens the definition of the money supply by also including “near cash” assets such as savings deposits, time deposits, and other money market mutual funds which can be converted into cash relatively quickly.
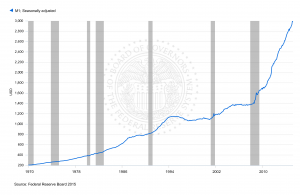
How much has money supply increased since the start of QE?
As a consequence of the Federal Reserve’s QE program, the money supply of the United States as measured by M1 has increased by over 100% since September 2008. Increasing the money supply on this scale has never occurred before – the exponential nature of the M1 chart illustrates this well.
Despite the dramatic increase in the overall money supply – we are still concerned about deflationary pressures within the economy. So what has been happening with all of this extra money? Banks for the large part, have been hoarding this cash as excess reserves within the system. The transmission mechanism through credit growth has been sluggish at best – and therefore the velocity of money has been crashing.
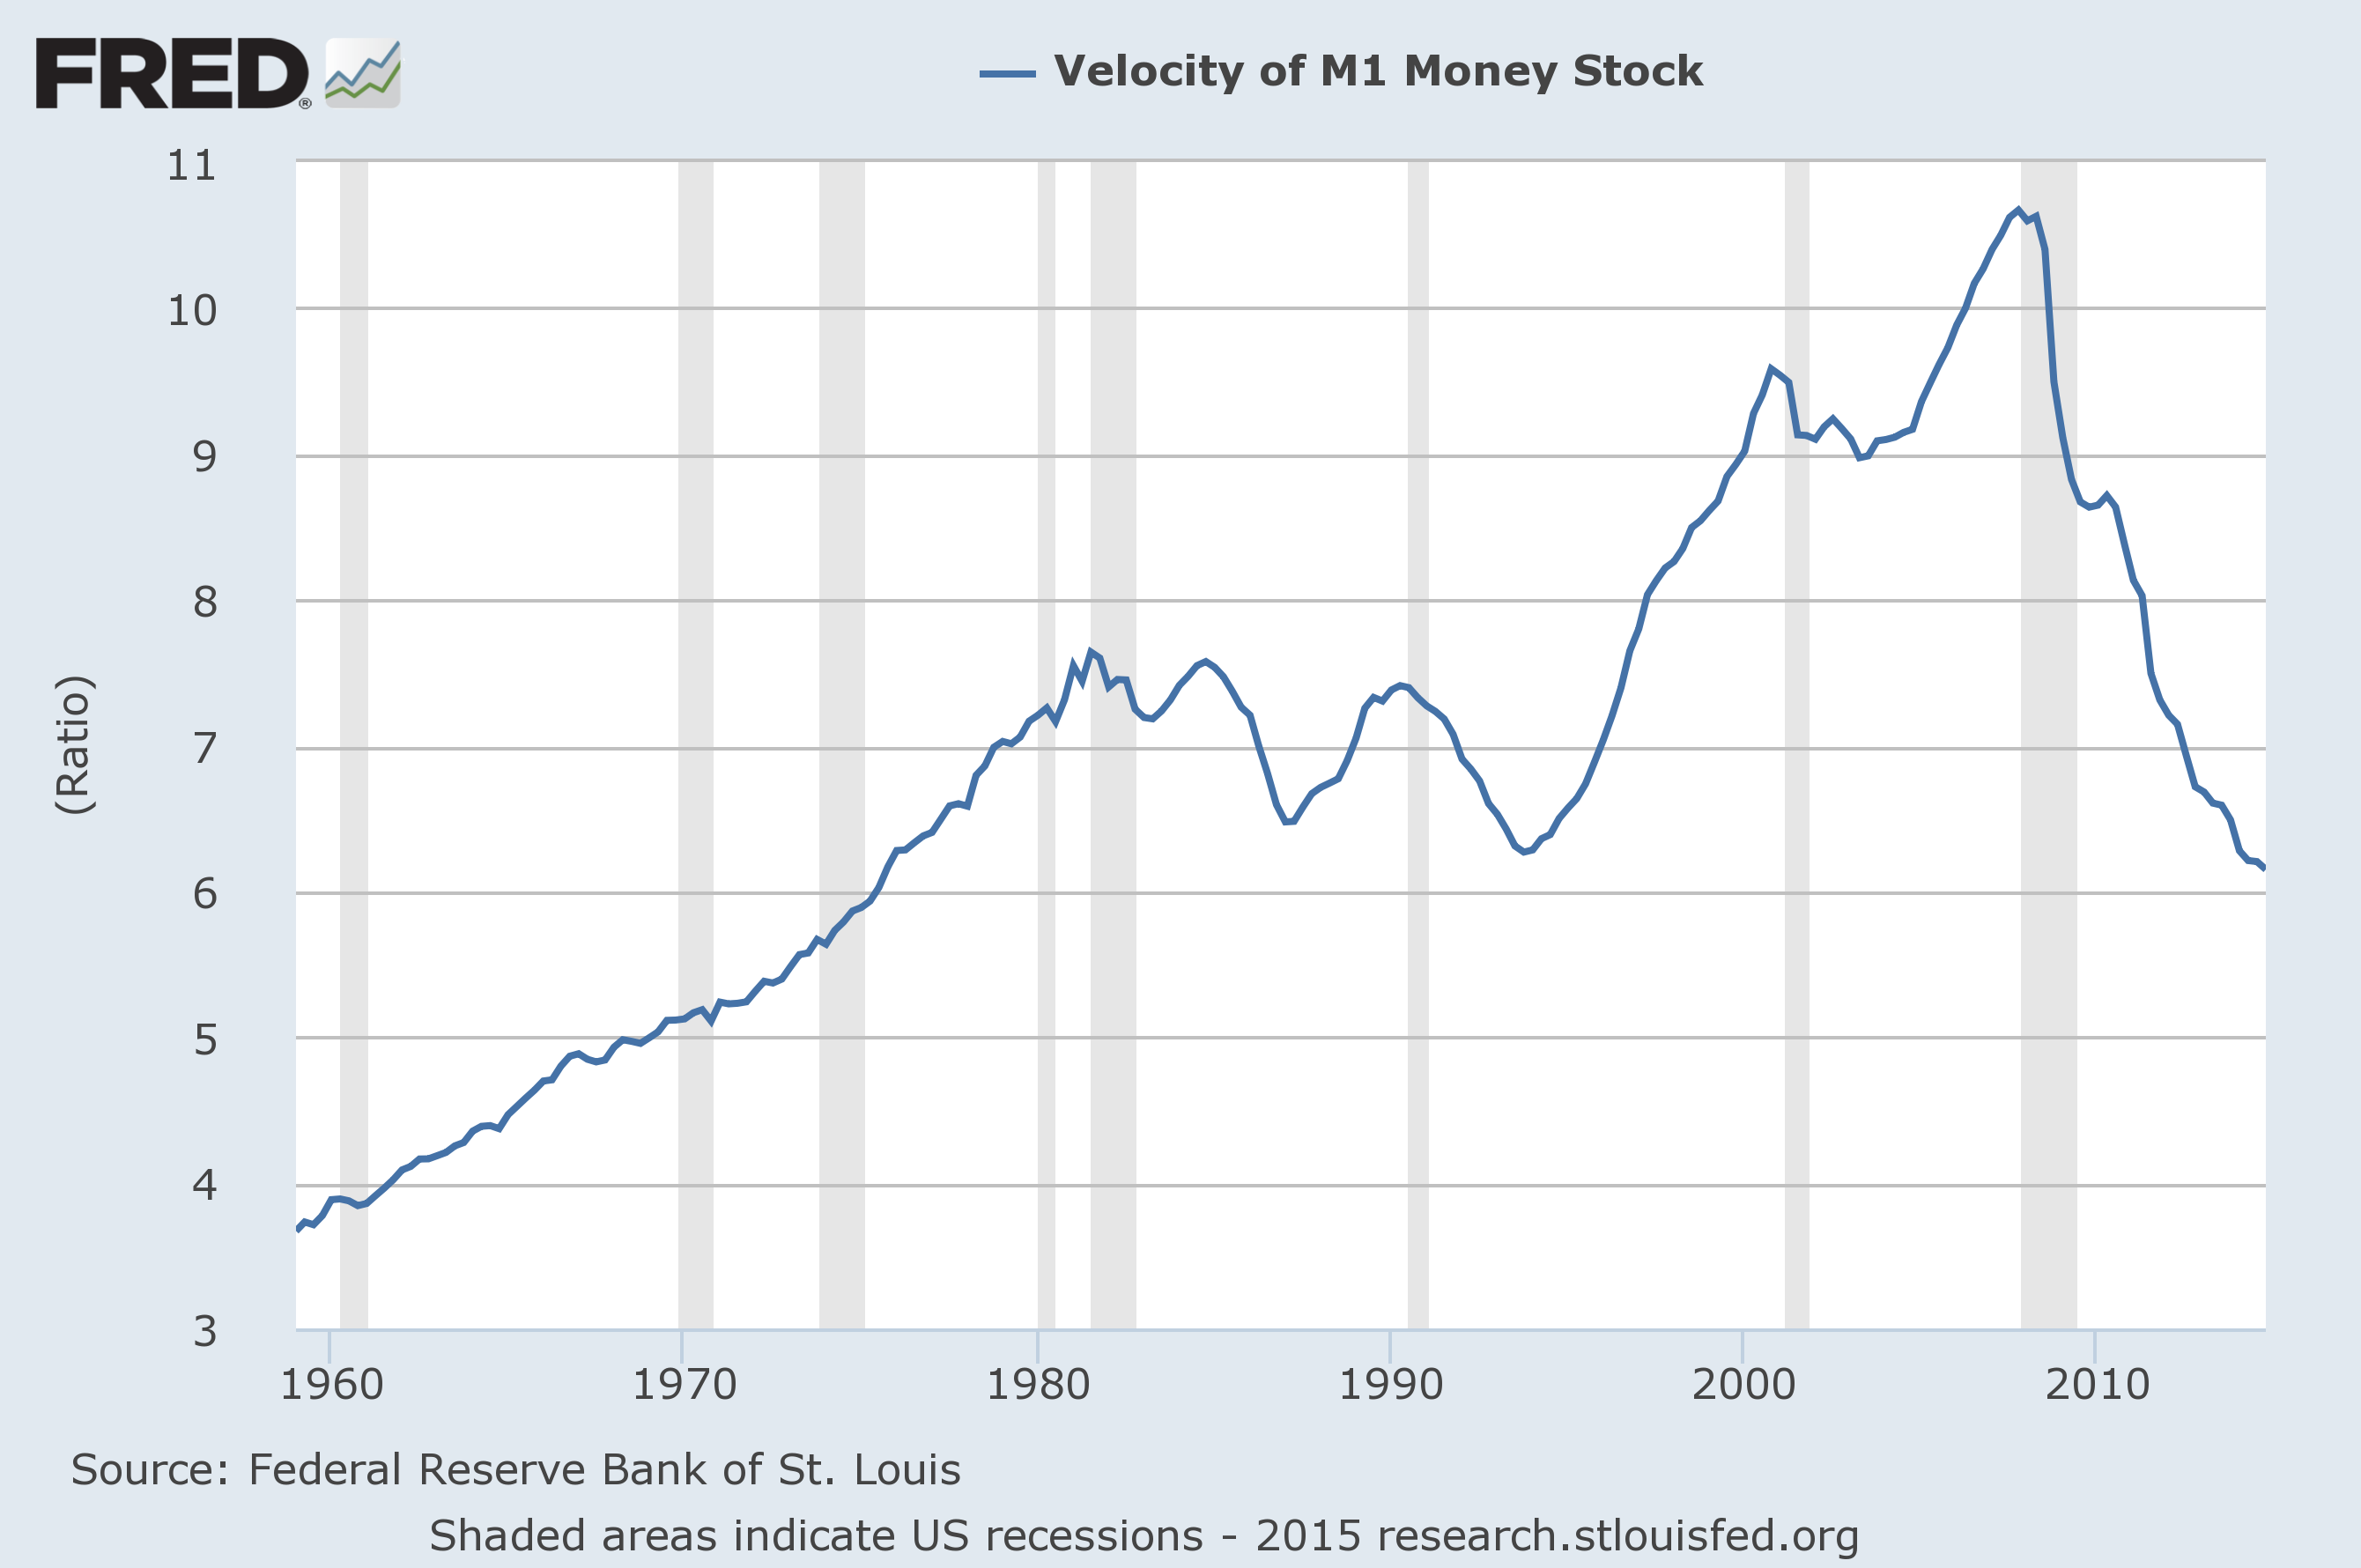
The Velocity of Money has been in freefall since 2008
The velocity of money has crashed “Post-Lehman” – the chart below shows by just how much! The implications of this are obvious. Money has been tied up in the financial sector – banks have been unwilling to lend to the “real sector” and the recovery has been going at a snail’s pace as a consequence. Financial markets by contrast, have been soaring with various markets around the word frequently taking out all time highs.
What happens next?
Looking forward from our current position is difficult. On one hand, the deflationary pressures weighing down the economy are still at large but the massive increase in the money supply has the potential to stoke serious inflationary pressures going forward. Central bank around the world have all squeezed the toothpaste tube and the contents are out. The next chapter in the “Post-Lehman” story will undoubtedly be dominated by how to get the money supply genie back into the bottle. Time will tell.
by Andrew | Apr 26, 2015 | Definitions, Inflation, inflation measure

Central banks around the world have been consistent in their policy response to the 2008 financial crisis; aggressive quantitative easing and zero interest rate policies have formed the backbone of policy responses for nearly a decade. The initial effectiveness of these policies was a huge feather in the cap of these central banks, most notably the Fed who managed to avert one of the biggest financial catastrophes of the modern era. Now into the seventh year post-lehman however, it is becoming less clear what exit strategy is in place for the numerous QE programs in place throughout the world, and what consequences these policies will have for the global economy in the long run.
Since the Fed tapered its bond purchases in October 2014, other central banks have stepped in aggressively to pick up the slack. Japan has been printing an unrivaled amount of money as part of Shinzo Abe’s stimulus package for the Japanese economy, and the ECB has been on the QE trail since January, promising to buy up to 1.1 trillion euros up until September 2016.
The ECB kickstarted its bond purchase program due to the threat of deflation taking root across the Eurozone much like the Fed’s initial fear of a deflationary spiral emerging in the aftermath of the credit crisis. With deflation now at the forefront of most investors minds given the falling oil price and subdued CPI over the past few months, it seems increasingly likely that these stimulus programs will be in place for the foreseeable future. In the long run however, what are the unintended consequences of these QE programs from the world’s central banks?
Fundamentals are becoming increasingly irrelevant: A rising tide lifts all boats
One of the most dangerous side effects of QE is the impact it has had on investment analysis. Monetary policy, above all else, has become the primary driving force behind markets globally. Fundamental analysis has become, by and large, irrelevant in the face of an ever expanding amount of liquidity chasing a finite amount of assets. Earnings reports are still dissected and talked about in depth, but increasingly these traditional forms of analysis are becoming less and less relevant.

Market valuations across the globe are stretched, bond valuations are at multi century highs, and high end real estate has been bid up to unbelievable levels. The exuberant valuations are overlooked in the belief that a steady flow of liquidity will continue to boost prices going forward.
Savers have been crushed during this whole process
The effect QE has had on interest rates globally has led to a very rough road for savers during this period. Returns have been cut to almost nothing, and in more recent years, the threat of negative interest rates and deposit taxes in certain parts of the world have added to the malaise confronting savers. In the long run, this will turn out to be one of the biggest failures of QE. For new entrants into the labor market since 2007 there has been very little yield available from conventional saving accounts. As a consequence, an entire new investment paradigm is starting to take root, formed primarily on more speculative and riskier investment principles. Savings and capital formation are an essential component of any well functioning economy. Destroying the incentive for people to save is perhaps the biggest regret we will have about QE when the pigeons eventually come home to roost.
Global Missallocation of Capital
Interest rates within the United States have always acted as the bellwether for risk on a global scale. The yield on 10 year treasury bonds has always been the traditional “risk free” rate of return. With US interest rates at near zero, evaluating risk has become an increasingly difficult result. As a result, risk premiums have been contracting around the world and yield starved capital has been flowing into markets and countries which historically would have been avoided. Emerging Markets have seen an unprecedented increase in capital flows which has resulted in some spectacular misallocation of capital within both commercial real estate, residential real estate and financial markets within these countries. We are starting to see some of these investment excesses start to unwind – and these markets look ripe for sustained weakness should interest rates begin to normalize in the near future.
What happens next?
The exit strategy for many of the various QE programs remains a great uncertainty. The Fed has officially tapered its bond purchase program since October 2014 but has held rates at near zero ever since. The challenge facing policy makers going forward is how to unwind the ultra stimulative policies of the last decade without causing a full fledged market crash.
For now, the proceeds of these policies have been pretty well confined in financial assets, creating a two speed economic system where inflation and growth appear to be occurring at a different paces within the real economy and the financial world. There really is no way of knowing what will result as a consequence of pulling QE from under the feet of the financial system. If some of the excess of the financial system starts to manifest itself within the CPI, then there is no way of telling where this will end. 2015 is shaping up to be an important chapter in the whole post-lehman story.
by Andrew | Apr 23, 2015 | CPI
Deflationary signals are beginning to crop up all over the world and investors need to sit up and take notice of these trends to ensure their portfolios are positioned to effectively deal with the potential onset of such an environment. Deflation is characterized by slumping demand, slower growth, and decreased credit growth which lead to falling prices throughout the economy. There are several investment strategies to help investors during periods of deflationary stress – here are some of the most popular strategies available.
Cash is King
Cash is one of the sure fire investment strategies during the onset of a deflationary cycle. The old cliche “Cash is King” definitely holds its own in these situations. Deflation triggers a mass scramble for cash in anticipation of crashing prices and slumping demand. Its often said that “He who panics first panics best” and this is definitely true in an increasingly overcrowded investment landscape. Having physical cash on hand can be a life saver during extreme periods such as government debt defaults, bank failures and widespread credit market collapse. Having cash can help you remain liquid during tough economic conditions. It means you aren’t overspending on goods that will have lower prices in the future, and you will have capital on hand to buy discounted assets.

There is increasing concern about the value of fiat currencies globally and the unsustainable deficit and debt positions which most countries currently find themselves in. Many investors are turning to gold and precious metals in order to remain hedge against inflation and deflation – precious metals in this instance are acting like a currency and may also be of interest to certain investors.
Control Credit Risk with Municipal Bonds
Muni bonds generally have decent rates of return and are often backed by tax raising powers of the state or county issued – this leads to low default probabilities which is a highly sought after quality during periods of deflationary stress. Longer term bonds in general are a good investment strategy but you need to be careful about the credit ratings of certain companies. Companies which currently enjoy “A” rated debt securities can deteriorate quickly in a slow economy.
Avoid big ticket purchases
Large ticket items, especially if bought on credit like household goods, cars, trailers, and boats are unlikely to be wise purchases during the onset of a deflationary environment. Leverage as a general should be avoided during such periods. The problem with such purchases is that prices are likely to fall during an episode of deflation within the economy. This results in debt repayments on a depreciating asset over a potentially long time horizon. Under such a scenario you are effectively paying back dollars that are worth more than the ones you borrowed.
Reduce Debt

Paying off your existing debt can be one of the most important forms of investment during a periods of sustained deflation. As prices fall throughout the economy, the purchasing power of money increases which ultimately leads to your debt becoming more expensive. By increasing your debt repayments every month, you are effectively investing for the longer term by decreasing the value of your debt burden.
Invest in companies with large stockpiles of cash
The stock market is generally a place to avoid investing when facing the threat of an oncoming deflationary shock. Some stocks however will provide a level of security. Companies with large cash stockpiles are the most likely to benefit, as they face less pressure to deleverage. In a deflating environment such companies may be able to pick up cheap assets, as their competitors struggle with high debt burdens, solidifying their position within the market.
If history is any judge, stock markets tend to get hammered during the initial phases of a deflationary shock no matter how much cash or liquid assets they have on their books. With current stock market valuations at record highs, it’s unlikely that any stock would hold up to the violent selling pressure that a deflationary shock would create. The value of such stocks tend to come into their own during the second phase of a deflationary environment when the overall market has had time to adjust to the new economic realities, and rational investment allocation decisions begin to resume.
Overall, deflationary economic environments require investors to position their portfolios into more liquid, easily transferred securities. Deleveraging while there is still some semblance of market normality is often prudent as once a full scale deflationary spiral starts to unravel its often hard to avoid being caught up in increasingly irrational market moves.