-v3")

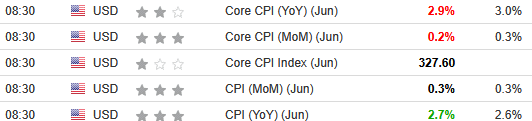
The June 2025 Consumer Price Index of All Urban Consumers (CPI-U) report indicates that inflation rose by 0.3% for the month, up from 0.2% in May. These data were released at 8:30 am EST on July 15, 2025, by the Bureau of Labor Statistics. Before seasonal adjustment, the year-over-year (Y-o-Y) inflation rate in the all-items index grew by 2.7%, a jump from 2.4% Y-o-Y in May.
The mixed results aligned near economists’ consensus estimates. The table below is courtesy of Investing.com. The left column represents June’s figures, while the right column represents forecasters’ expectations. As you can see, core was cool, while the headline figure was somewhat hot.
Despite that, fresh tariff threats could increase the FOMC’s inflation concerns. Chairman Jerome Powell said recently that resurgent inflation “is a risk. As the people who are supposed to keep stable prices, we need to manage that risk. That’s all we’re doing…. It is just something you want to approach carefully. If we make a mistake people will pay the cost for a long time.”
Thus, today’s data may not have done enough to alleviate those concerns.
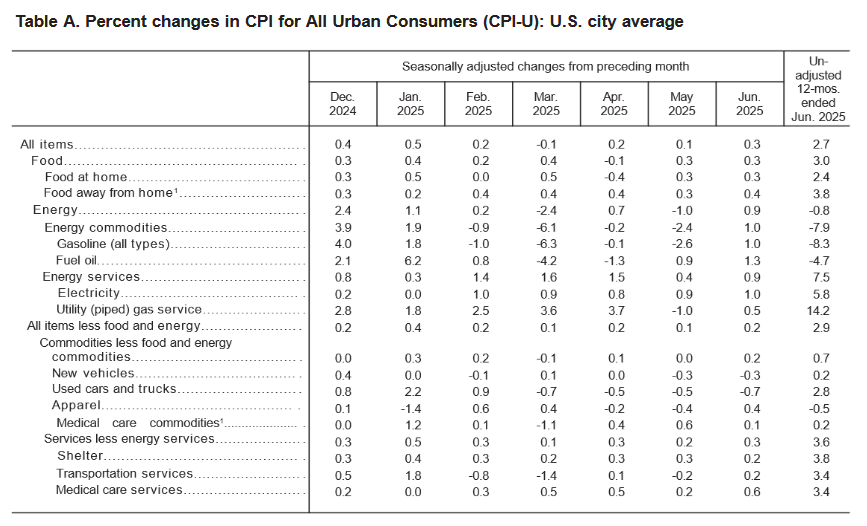
Electricity, gasoline, and fuel oil led the headline increase, as the metrics rose by 1% or more MoM . Core inflation (which excludes the impacts of food and energy), rose by 0.2% in June, up from 0.1% in May.
Food Prices
The food index jumped by 0.3% MoM in June, matching May, and three of the six major grocery store food indexes realized deflation once again:
- Cereals and bakery products (-0.2%)
- Meats, poultry, fish, and eggs (-0.1%)
- Dairy and related products (-0.3%)
- Fruits and vegetables (+0.9%)
- Nonalcoholic beverages (+1.4%)
- Other food at home (+0.2%)
Maintaining its momentum, the food away from home index rose by 0.4%, as restaurant inflation accelerated in June.
Energy Prices
The energy index increased by 0.9% in June after falling by 1.0% in May. Gasoline prices rose by 1.0%, natural gas by 0.5%, and electricity by 1.0%.
Core CPI
The June core CPI rose by 0.2% month-over-month and 2.9% Y-o-Y. Below is an itemized breakdown of the main price fluctuations seen in the core CPI reading:
- Shelter index: (+0.2%) [May: +0.3%]
- Rent index: (+0.2%) [May: +0.2%]
- Owners’ equivalent rent: (+0.3%) [May: +0.3%]
- Motor vehicle insurance: (+0.1%) [May: +0.7%]
- Medical care services: (+0.6%) [May: +0.2%]
- Physician services: (+0.2%) [May: -0.3%]
- Hospital services: (+0.7%) [May: +0.4%]
- Airline fares: (-0.1%) [May: -2.7%]

Seasonally Unadjusted CPI
Before seasonal adjustments, the CPI-U for June 2025 increased by 2.7% Y-o-Y to an index level of 322.561. Since these figures are unadjusted, they include regular seasonal price fluctuations that can create volatility in the results.
Trump’s Tariff Threats
After a three-month tariff reprieve, U.S. President Donald Trump ignited trade war fears again by threatening new levies on Canada, Mexico, Brazil, and the EU. And while most of the dues don’t come into effect until Aug. 1, and he could announce another pause when the deadline arrives, the uncertainty is another headache for the FOMC.
With the committee largely adopting a wait-and-see approach to interest rate cuts, the longer the uncertainty lingers, the more time and data they need to assess the situation. Consequently, while inflation remains above their 2% target and the labor market looks solid on the surface, the tariff diversion could distract from the underlying warning signs.
For example, U.S. nonfarm payrolls came in at 147,000 on Jul. 3, and the unemployment rate declined from 4.2% to 4.1%. However, ADP reported on Jul. 2 that private employers cut 33,000 jobs in June, which was a rare negative print from the payrolls provider. So, while government job gains helped bolster the former, the corporate sector could be signaling that tariff uncertainty is hurting business prospects.
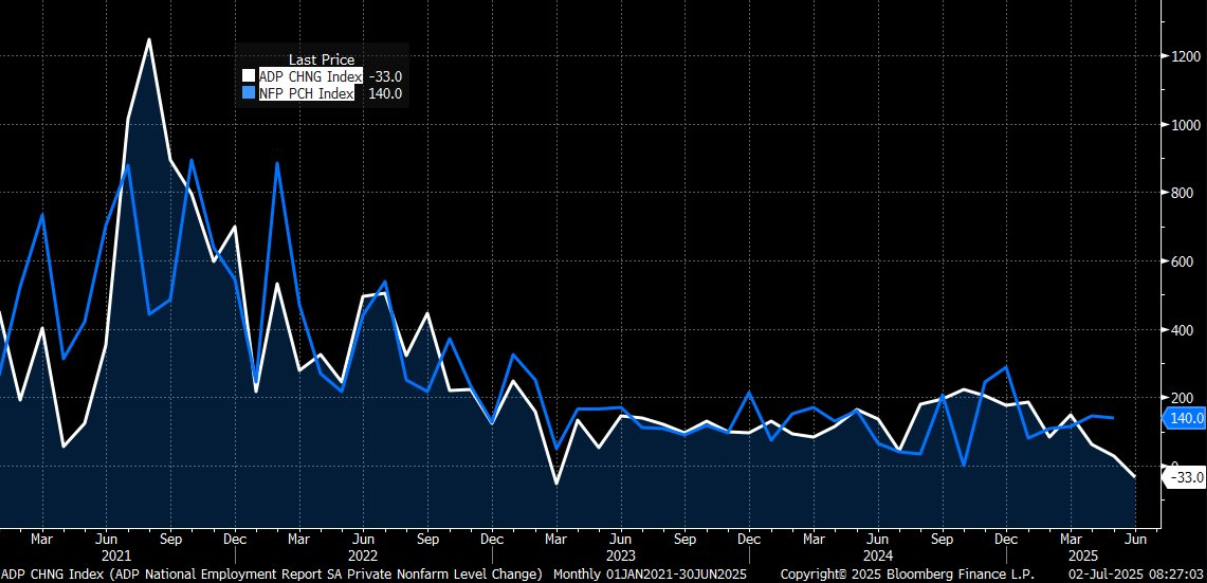
To explain, the blue line above tracks the monthly change in the private component of U.S. nonfarm payrolls, while the white line above tracks the monthly change in ADP’s figures. If you analyze the connection, you can see the pair often moves in a similar direction.
More importantly, the gap on the right side of the chart shows how negative ADP payrolls (the white line) contrast the strength of the NFP number (the blue line). As such, the U.S. labor market may be weaker than it appears.
To that point, the NFIB released its latest Small Business Optimism Index on Jul. 8. The report noted that 10% of respondents cited poor sales as their single most important problem, the highest reading since March 2021.
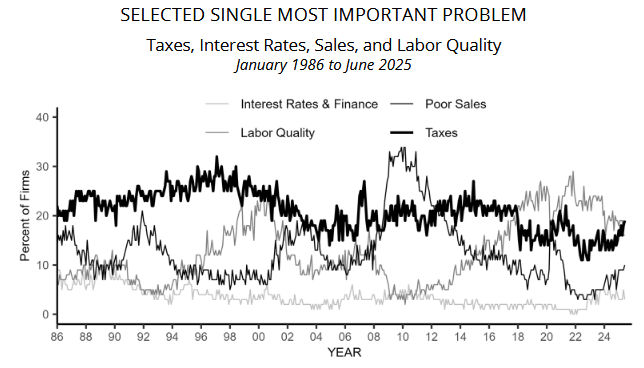
To explain, the second-darkest line on the chart above tracks the poor sales component. If you analyze the right side of the chart, you can see that it continues to trend higher and is unlikely to reverse until the macroeconomic clouds clear. Furthermore, if a sales slump continues to plague U.S. small businesses, they may respond by reducing headcount and further weakening the labor market.
All in all, while tariffs will likely exacerbate the growth and employment slowdown, the economic turmoil is bullish for gold. The yellow metal remains in an uptrend and concerns about the U.S. dollar and its safe-haven status have investors and central banks allocating more capital toward gold.
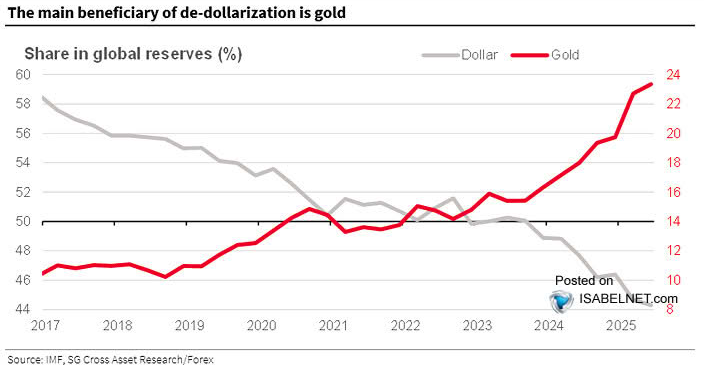
To explain, the gray line above tracks the share of U.S. dollar reserves held by global central banks, while the red line above tracks the share of gold reserves held by global central banks. If you analyze the post-COVID shift, you can see that U.S. debt and spending concerns caused global institutions to reduce their USD exposure and increase their gold assets. And with the trend poised to continue, flows and fundamentals should keep gold elevated for the foreseeable future.
Are you thinking about diversifying into precious metals? Talk to your financial advisor about initiating a gold IRA account today, allowing you to invest in this red-hot asset on a tax-advantaged basis. Additionally, our complimentary CPI inflation calculator remains at your disposal, enabling you to assess inflation’s impact on your finances. Please seek the guidance of a financial advisor before making any investment decision.
In addition, if credit concerns have increased alongside the economic uncertainty, you’re not alone. New Era Debt Solutions is a top-rated debt settlement company that can help alleviate unsecured claims in as little as 24 to 48 months. Similarly, Family Credit Management is an excellent nonprofit credit counseling agency that provides the education and resources necessary to determine the optimal path to financial well-being.
For debt consolidation, Mariner Finance is a reputable personal loan provider that caps its APRs at 35.99%. You can borrow $1,000 to $25,000 (up to $50,000 in select states) and solutions are available for applicants that often don’t qualify at traditional banks.
Remember, speaking with a professional can help you avoid bankruptcy and protect your credit score. To learn more, please consult our list of debt management firms that can help get you back on track.

Alex Demolitor is a Canadian financial writer hailing from Halifax, NS. Alex has a Bachelors Degree from King's College and passed the CFA Exam Level III. He specializes in fundamental analysis of the stock, bond, commodity, and FX markets. He also covers US & Canadian economic indicators.
