-v3")

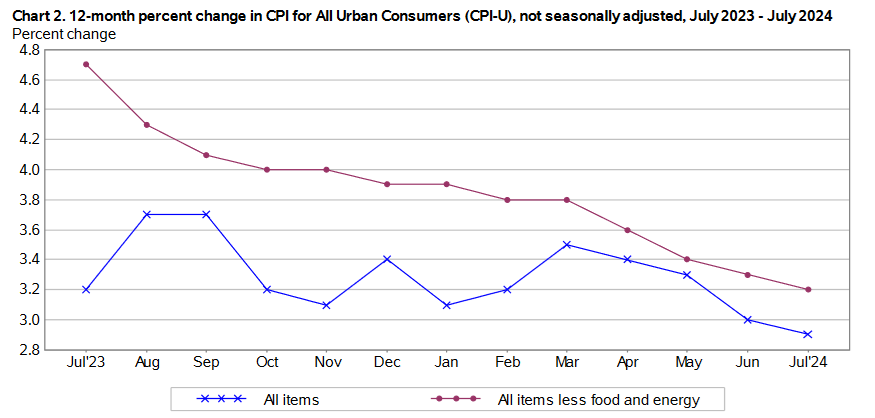
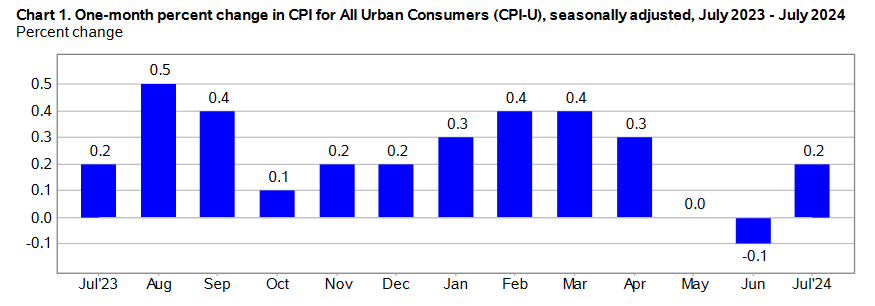
The July 2024 Consumer Price Index of All Urban Consumers (CPI-U) report indicates that inflation increased by 0.2% for the month, a rise from June’s 0.1% decline. These data were released at 8:30 am EST on Wednesday, August 14, 2024, by the Bureau of Labor Statistics. Before seasonal adjustment, the year-over-year (Y-o-Y) inflation rate in the all-items index grew by 2.9%, decelerating from June’s 3.0% Y-o-Y CPI print.
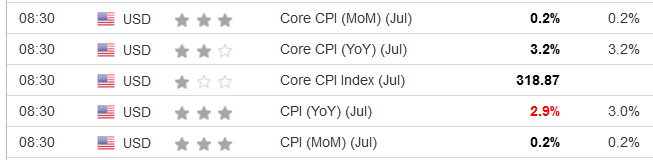
Doing little to derail the chances of future rate cuts, most of the CPI metrics matched economists’ consensus estimates. The table below is courtesy of Investing.com. The left column represents July’s figures, while the right column represents forecasters’ expectations. As you can see, the Y-o-Y CPI (marked in red) was weaker than expected, while the others (marked in black) met expectations.
To that point, while Fed Chairman Jerome Powell said on Jul. 31 that “we’re not quite at that point” where a lower overnight lending rate is justified, he added, “We’re getting closer to the point at which it’ll be appropriate to reduce our policy rate.”
Moreover, the FOMC’s latest Monetary Policy Statement noted that “The Committee judges that the risks to achieving its employment and inflation goals continue to move into better balance.” In other words, the FOMC has become more attentive to a slowing U.S. labor market, which may pave the way for less emphasis on inflation and foster monetary easing.
Global markets had a mixed response to the CPI release, with American and European indices largely remaining range-bound. Likewise, Treasury bonds, precious metals, and the U.S. dollar had mostly small reactions since the as-expected CPI data wasn’t much of a surprise.
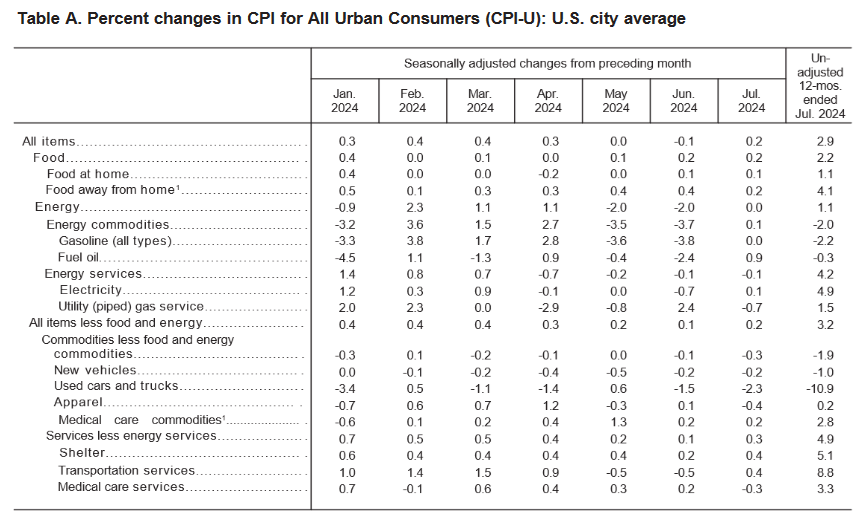
July’s headline inflation deceleration was driven by lower used cars and trucks prices (-2.3%), utility gas (-0.7%), and apparel (-0.4%). Core inflation (which excludes the impacts of food and energy), rose 0.2% in July, a small increase from June’s 0.1% rise. The shelter index rose 0.4% and accounted for nearly 90% of the headline CPI’s rise.
Food Prices
The food index increased by 0.2% in July, matching the 0.2% print from June. Three of the six major grocery store food indexes showcased inflation, while three realized deflation.
- Cereals and bakery products (-0.5%)
- Meats, poultry, fish, and eggs (+0.7%)
- Dairy and related products (-0.2%)
- Fruits and vegetables (+0.8%)
- Nonalcoholic beverages (+0.5%)
- Other food at home (-0.5%)
In addition, the food away from home index rose by 0.2% in July, a noticeable slowdown from the 0.4% recorded in May and June. Consequently, restaurants pared back some of their pricing practices this month.
Energy Prices
The energy index was flat in July after falling 2.0% in June. Electricity and fuel oil prices rose by 0.1% and 0.9%, respectively, while natural gas prices fell by 0.7%. Gasoline prices were also flat in July on a seasonally adjusted basis and up by 0.8% excluding adjustments.
Core CPI July 2024
The July core CPI rose by 0.2% month-over-month, which is within the Fed’s range of expectations. On a Y-o-Y basis, the metric rose 3.2%. Below is an itemized breakdown of the main price fluctuations seen in the core CPI reading:
- Shelter index: (+0.4%) [June: +0.2%]
- Rent index: (+0.5%) [June: +0.3%]
- Owners’ equivalent rent: (+0.4%) [June: +0.3%]
- Motor vehicle insurance: (+1.2%) [June: +0.9%]
- Medical care services: (-0.3%) [June: +0.2%]
- Physician services: (+0.1%) [June: +0.1%]
- Hospital services: (-1.1%) [June: +0.1%]
- Airline fares: (-1.6%) [June: -5.0%]
Seasonally Unadjusted CPI Data for July 2024
Before seasonal adjustments, the CPI-U for July 2024 increased (+2.9%) Y-o-Y, rising to an index level of 314.540. Since these figures are unadjusted, they include regular seasonal price fluctuations that can create volatility in the results.
Growth Concerns Overshadow Inflation?
Because price stability is only one-half of the Fed’s dual mandate, investors always worry that too much emphasis on inflation could slow economic growth and derail the other half of the dual mandate — maximum employment.
As a result, while the financial markets have stabilized in recent days, last week’s ‘flash crash’ and calls for emergency rate cuts highlight the anxiety that occurs alongside rate-cutting cycles. Historically, rate cuts have sometimes preceded recessions, so investors are looking for clues that a hard landing can be avoided. Thus, weaker data is good for financial assets as long as it’s not too weak.
Consequently, 2024 winners like Bitcoin and Ethereum have suffered recently, as have U.S. stocks. And while silver has fallen below the important $30 level, gold has largely maintained its strength. Therefore, the yellow metal has shown an ability to perform during good and bad periods throughout 2024.
Are you thinking about diversifying into precious metals? Talk to your financial advisor about initiating a gold IRA account today, allowing you to invest in this red-hot asset on a tax-advantaged basis. Additionally, our complimentary CPI inflation calculator remains at your disposal, enabling you to assess inflation’s impact on your finances. Remember, seek the guidance of a financial advisor before making any investment decision.

Alex Demolitor is a Canadian financial writer hailing from Halifax, NS. Alex has a Bachelors Degree from King's College and passed the CFA Exam Level III. He specializes in fundamental analysis of the stock, bond, commodity, and FX markets. He also covers US & Canadian economic indicators.
