
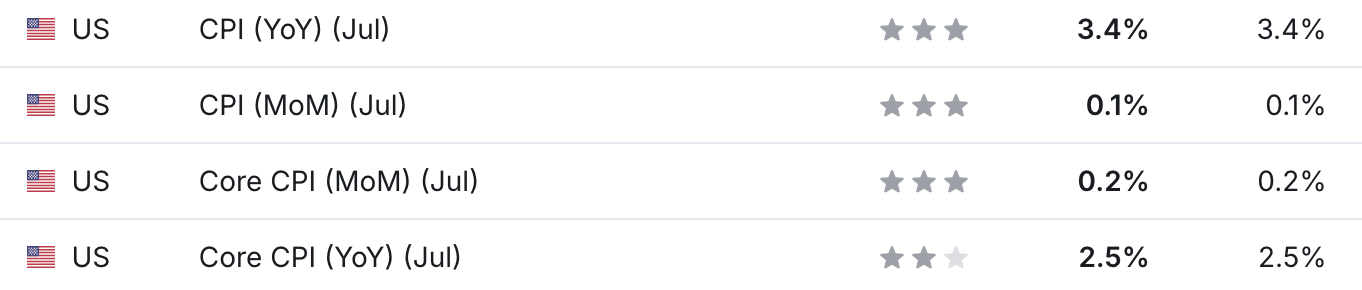
The July 2026 Consumer Price Index of All Urban Consumers (CPI-U) report indicates that inflation rose by 0.1% this month, up from a 0.4% decline in June. These data were released at 8:30 am EST on August 12, 2026, by the Bureau of Labor Statistics (BLS). Before seasonal adjustment, the year-over-year (Y-o-Y) inflation rate in the all-items index grew by 3.4%.
This month’s results matched economists’ consensus estimates. The table below is courtesy of Investing.com. The left column represents July’s figures, while the right column represents forecasters’ expectations. As you can see, there weren’t any surprises.
Yet, as inflation concerns fester among the investing public, Fed Chair Kevin Warsh said after the latest Monetary Policy Meeting on Jul. 29 that the bond market has already done much of the heavy lifting.
“Nominal and real yields are materially higher across the Treasury curve. In fact, some of the increases in market interest rates between FOMC meetings are among the most significant in the last two decades, ranking around the top decile or so,” he said.
“If I were to try to break down—just aggregate the Treasury market signals—I wouldn’t be able to do it perfectly. But the bond market’s saying many of those same things, and that’s why we’re seeing a tightening both in nominals and in reals, even while, at some level, we haven’t done much in 42 days. The markets have done quite a bit.”
Thus, while investors debate the merits of rate hikes, Warsh believes higher interest rates have already been priced into the U.S. economy.
Food Prices
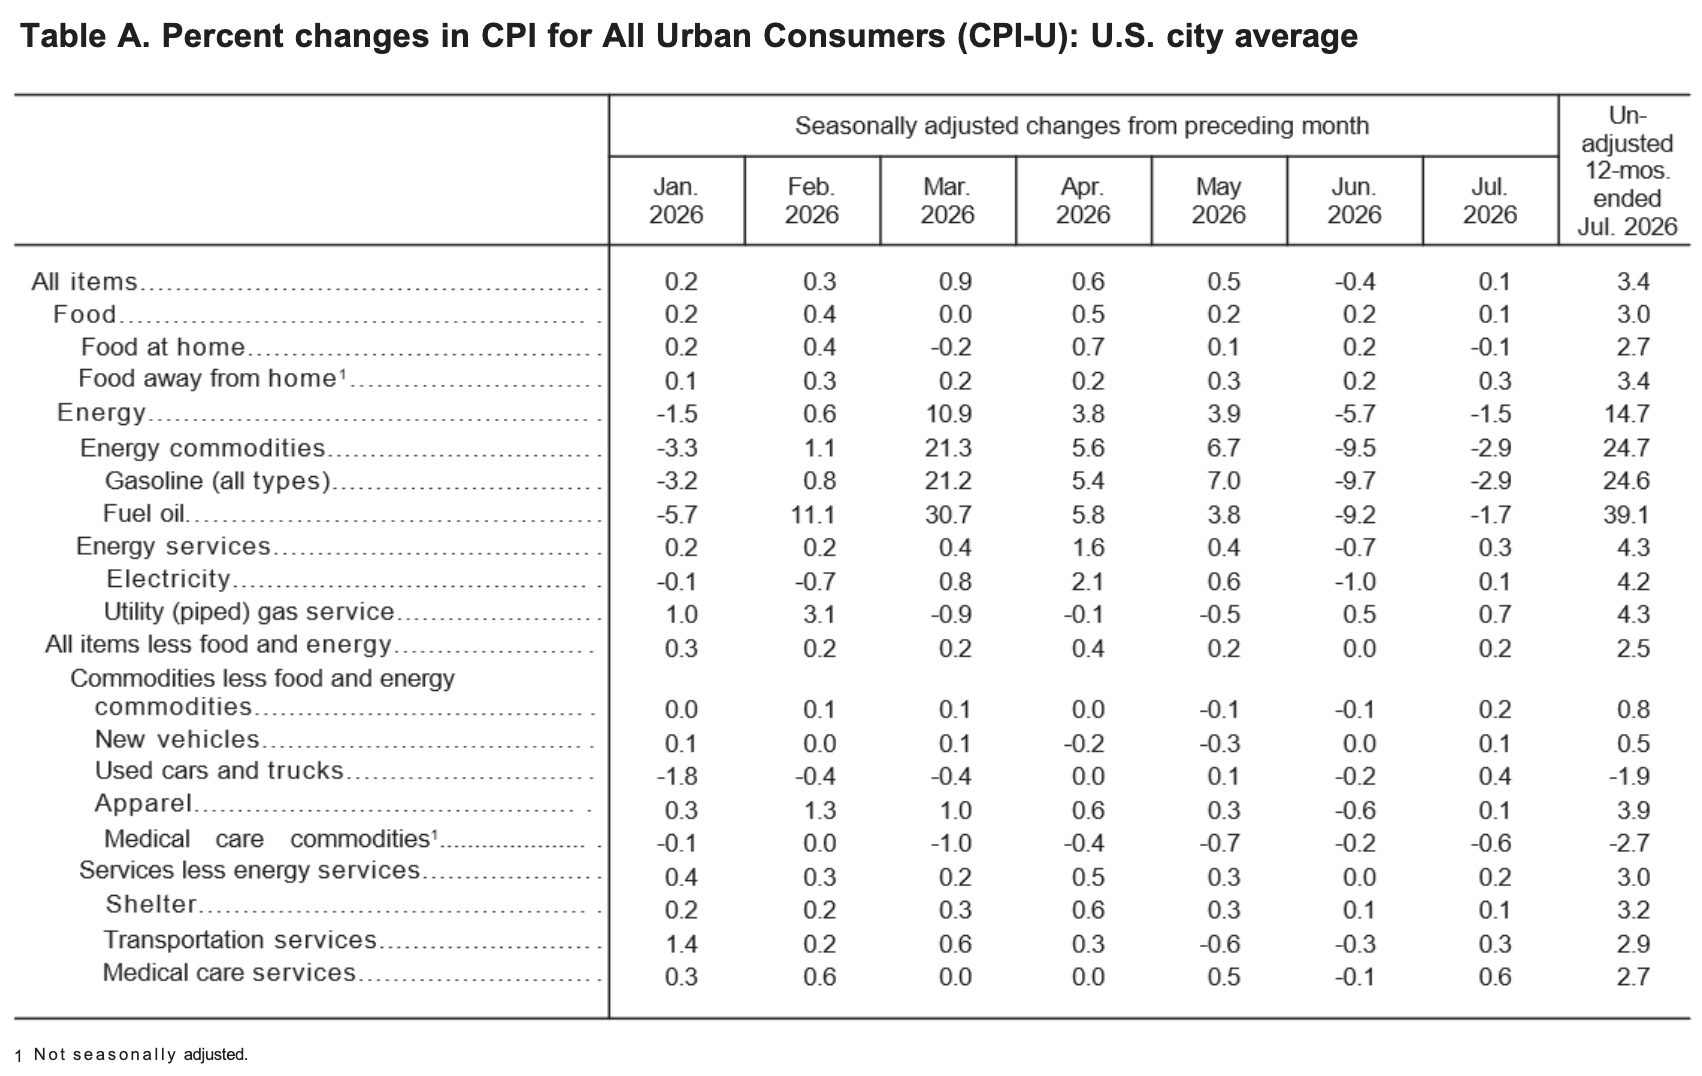
The food index increased by 0.1% in July, decelerating from the 0.2% rise in June. Four of the major grocery indices increased this month, while two decreased.
- Cereals and bakery products (+0.2%)
- Meats, poultry, fish, and eggs (-0.7%)
- Dairy and related products (-0.1%)
- Fruits and vegetables (-0.1%)
- Nonalcoholic beverages (+0.9%)
- Other food at home (+0.0%)
In addition, the food away from home index increased by 0.3%, as restaurant inflation surpassed grocery inflation.
Energy Prices
The energy index fell by 1.5% MoM in July after dropping by 5.7% MoM in June — the largest monthly drop since April 2020. Gasoline prices fell by 2.9%, while electricity rose by 0.1%, and natural gas by 0.7%.
Core CPI
The July core CPI rose by 2.5% Y-o-Y, down from 2.6% in June. Below is an itemized breakdown of the various components:
- Shelter index: (+0.1%) [June: +0.1%]
- Rent index: (+0.3%) [June: +0.1%]
- Owners’ equivalent rent: (+0.3%) [June: +0.1%]
- Motor vehicle insurance: (-0.3%) [June: -2.0%]
- Medical care services: (+0.6%) [June: -0.1%]
- Physician services: (+0.2%) [June: -0.2%]
- Hospital services: (+0.5%) [June: +0.1%]
- Airline fares: (+2.2%) [June: +0.2%]
Seasonally Unadjusted CPI
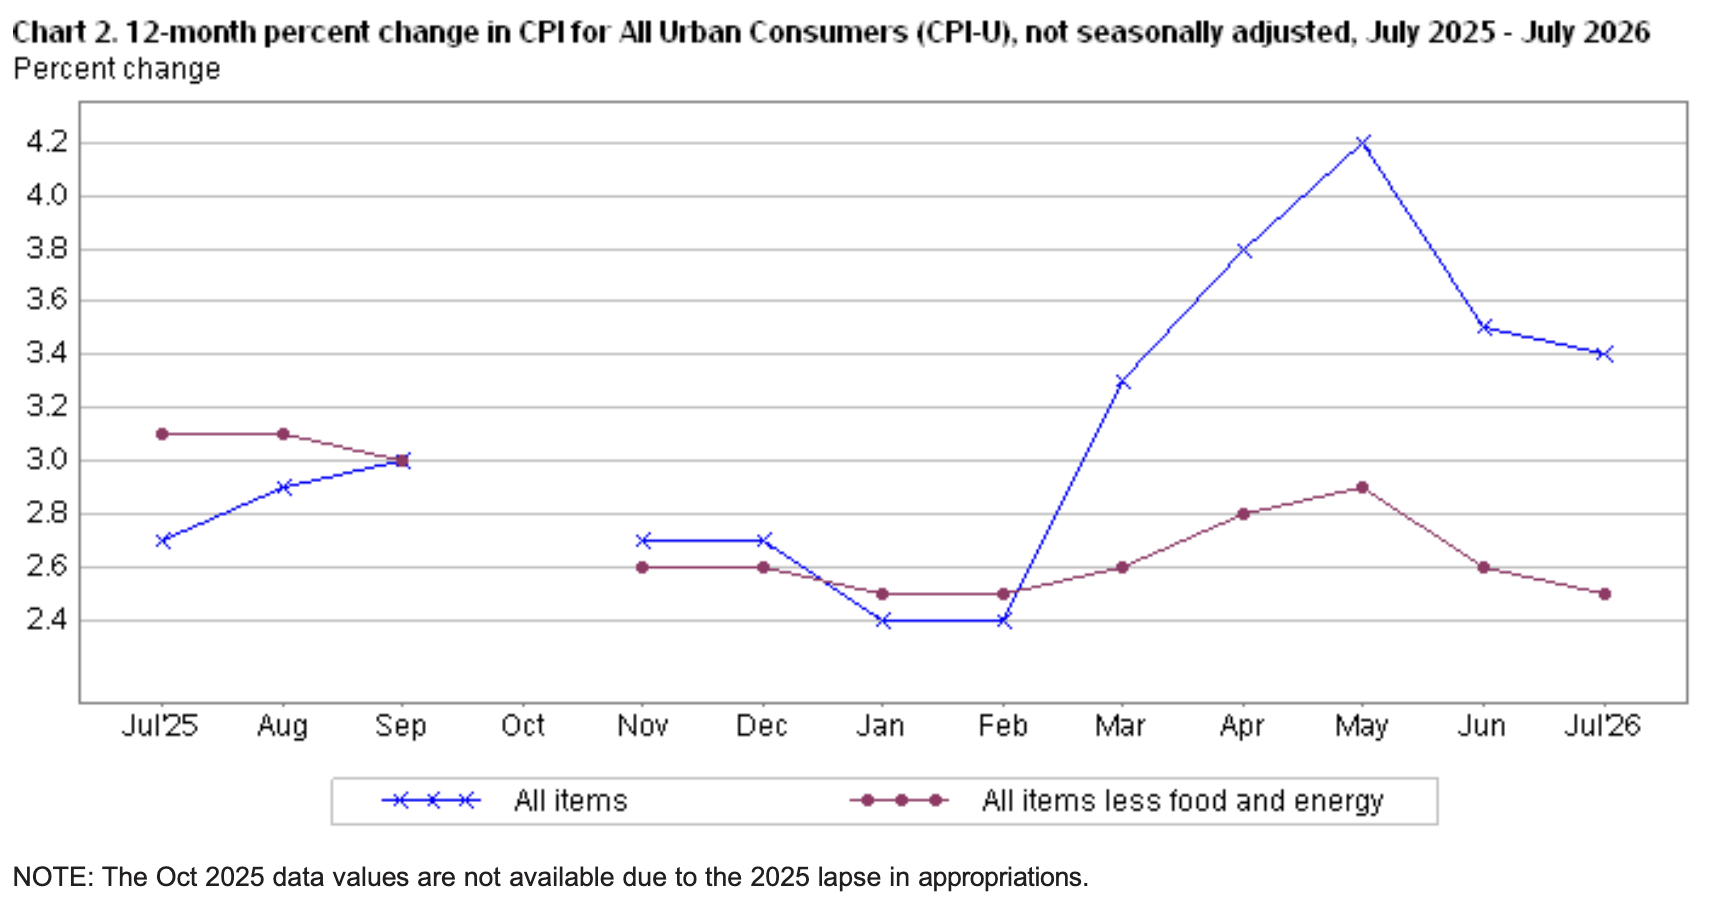
Before seasonal adjustments, the CPI-U for July 2026 increased by 3.4% Y-o-Y to an index level of 333.918. Since these figures are unadjusted, they include regular seasonal price fluctuations that can create volatility in the results.
A Juggling Act
While interest rates have risen dramatically in recent months, investors seem keen on encouraging a rate hike from the Fed. However, recent data signals that tighter financial conditions may already be impacting the real economy.
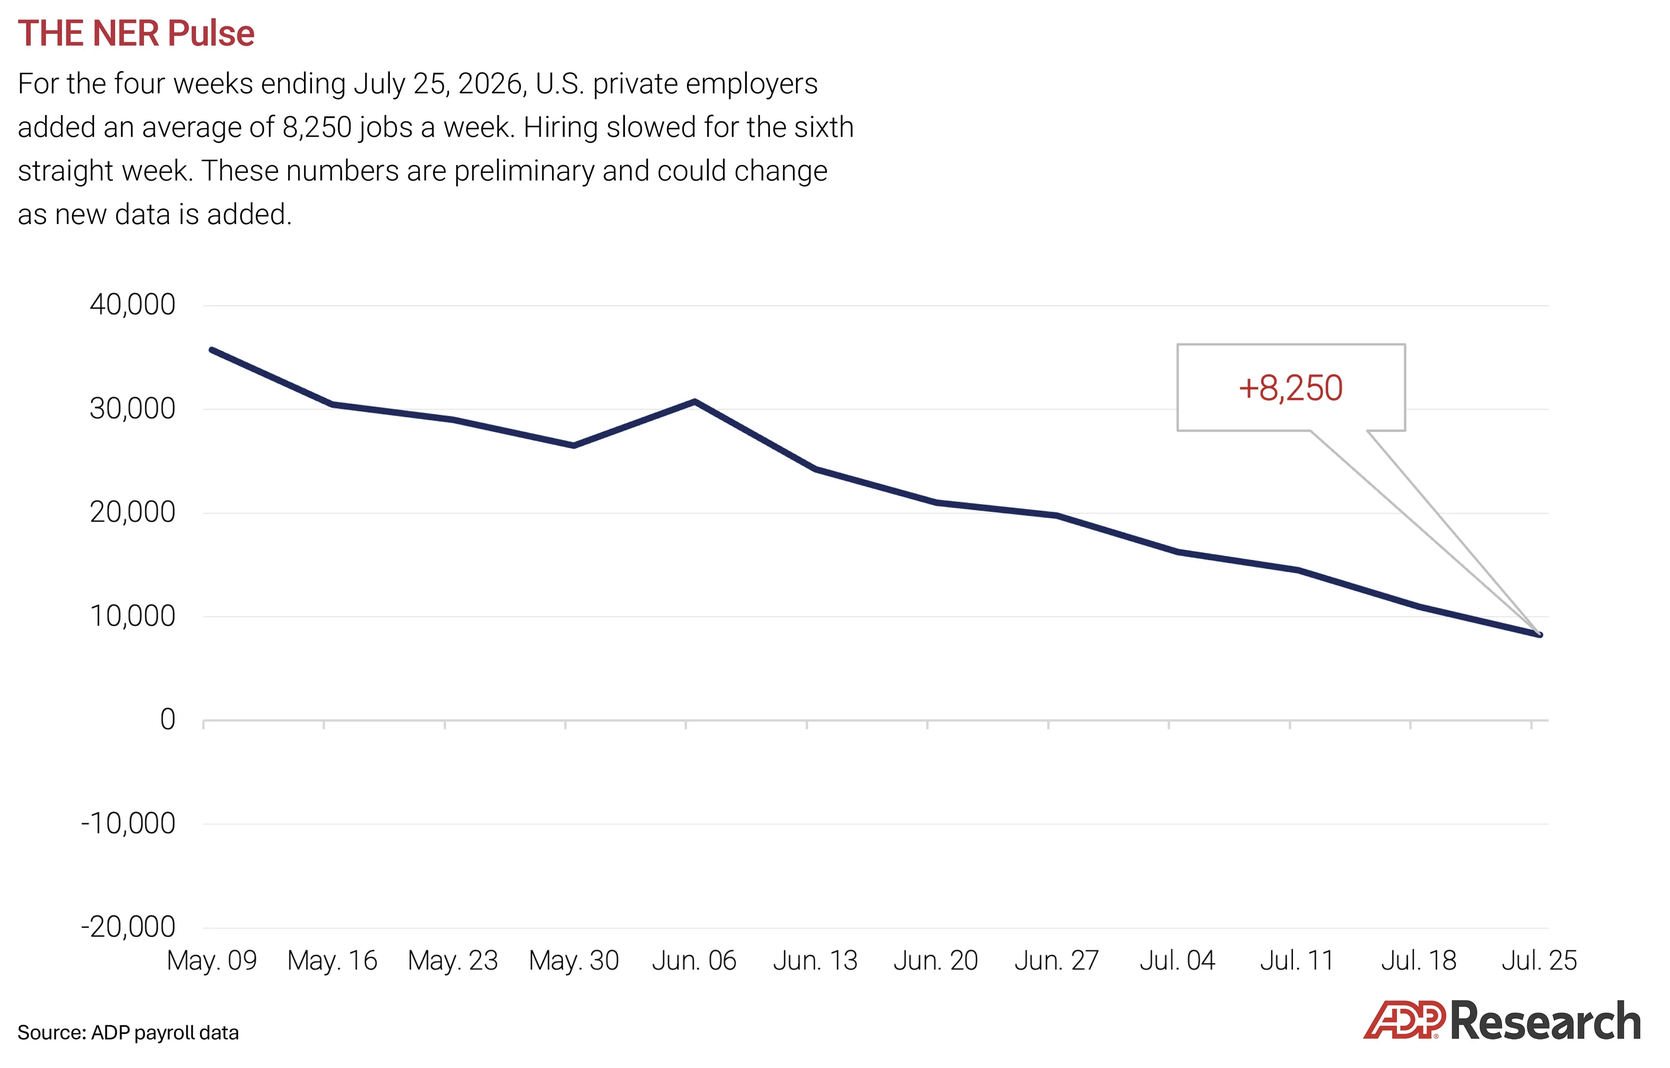
For example, ADP private payrolls underperformed expectations last week, and the firm noted on Aug. 11 that its Weekly NER Pulse has slowed for six straight weeks. Consequently, weakening labor market metrics have become increasingly common.
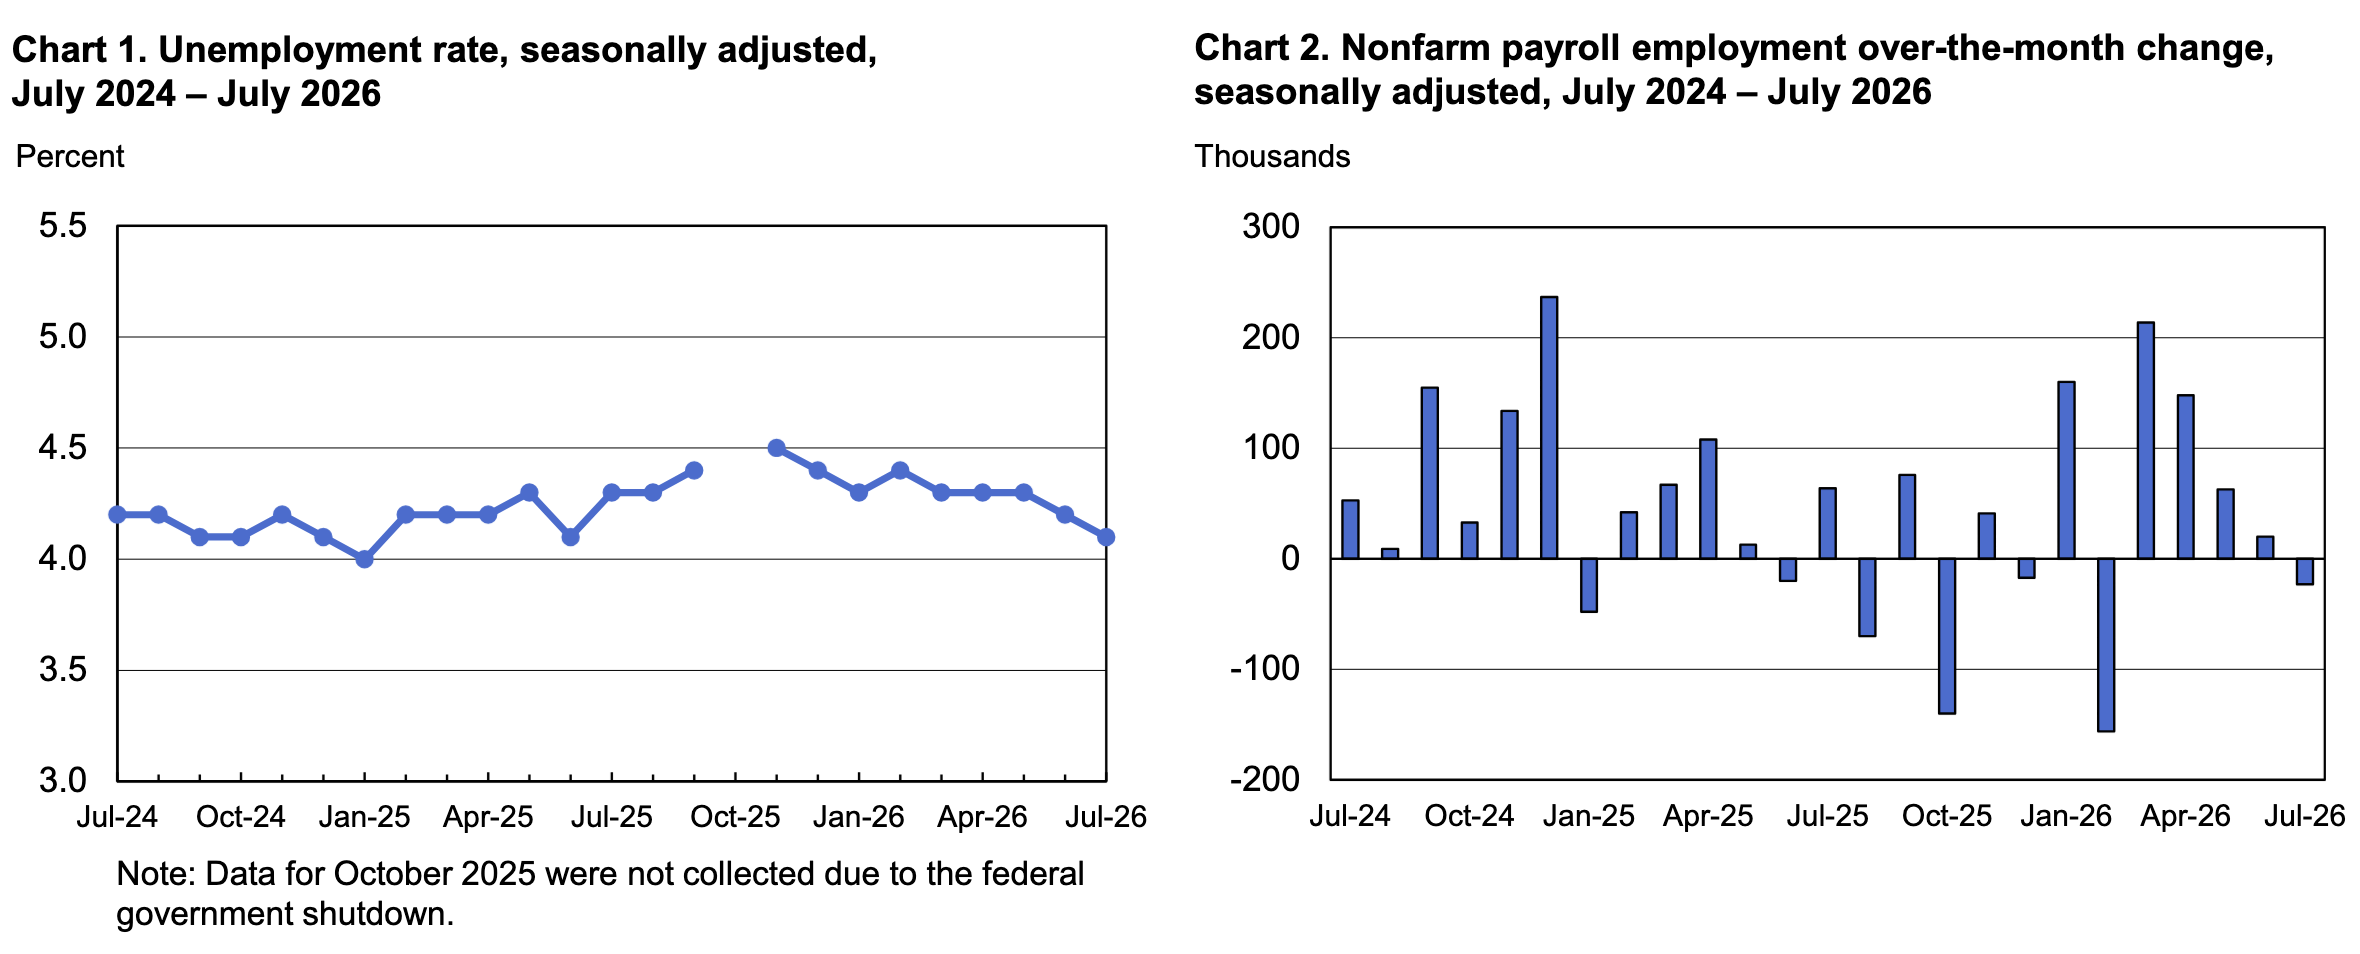
Speaking of which, the BLS reported on Aug. 7 that U.S. nonfarm payrolls fell by 23,000 in July. And if you analyze the trend on the right side of the chart below (the one on the right), you can see that monthly payroll growth had declined over the last few months before turning negative in July. As a result, the slowdown is similar to the results from ADP.
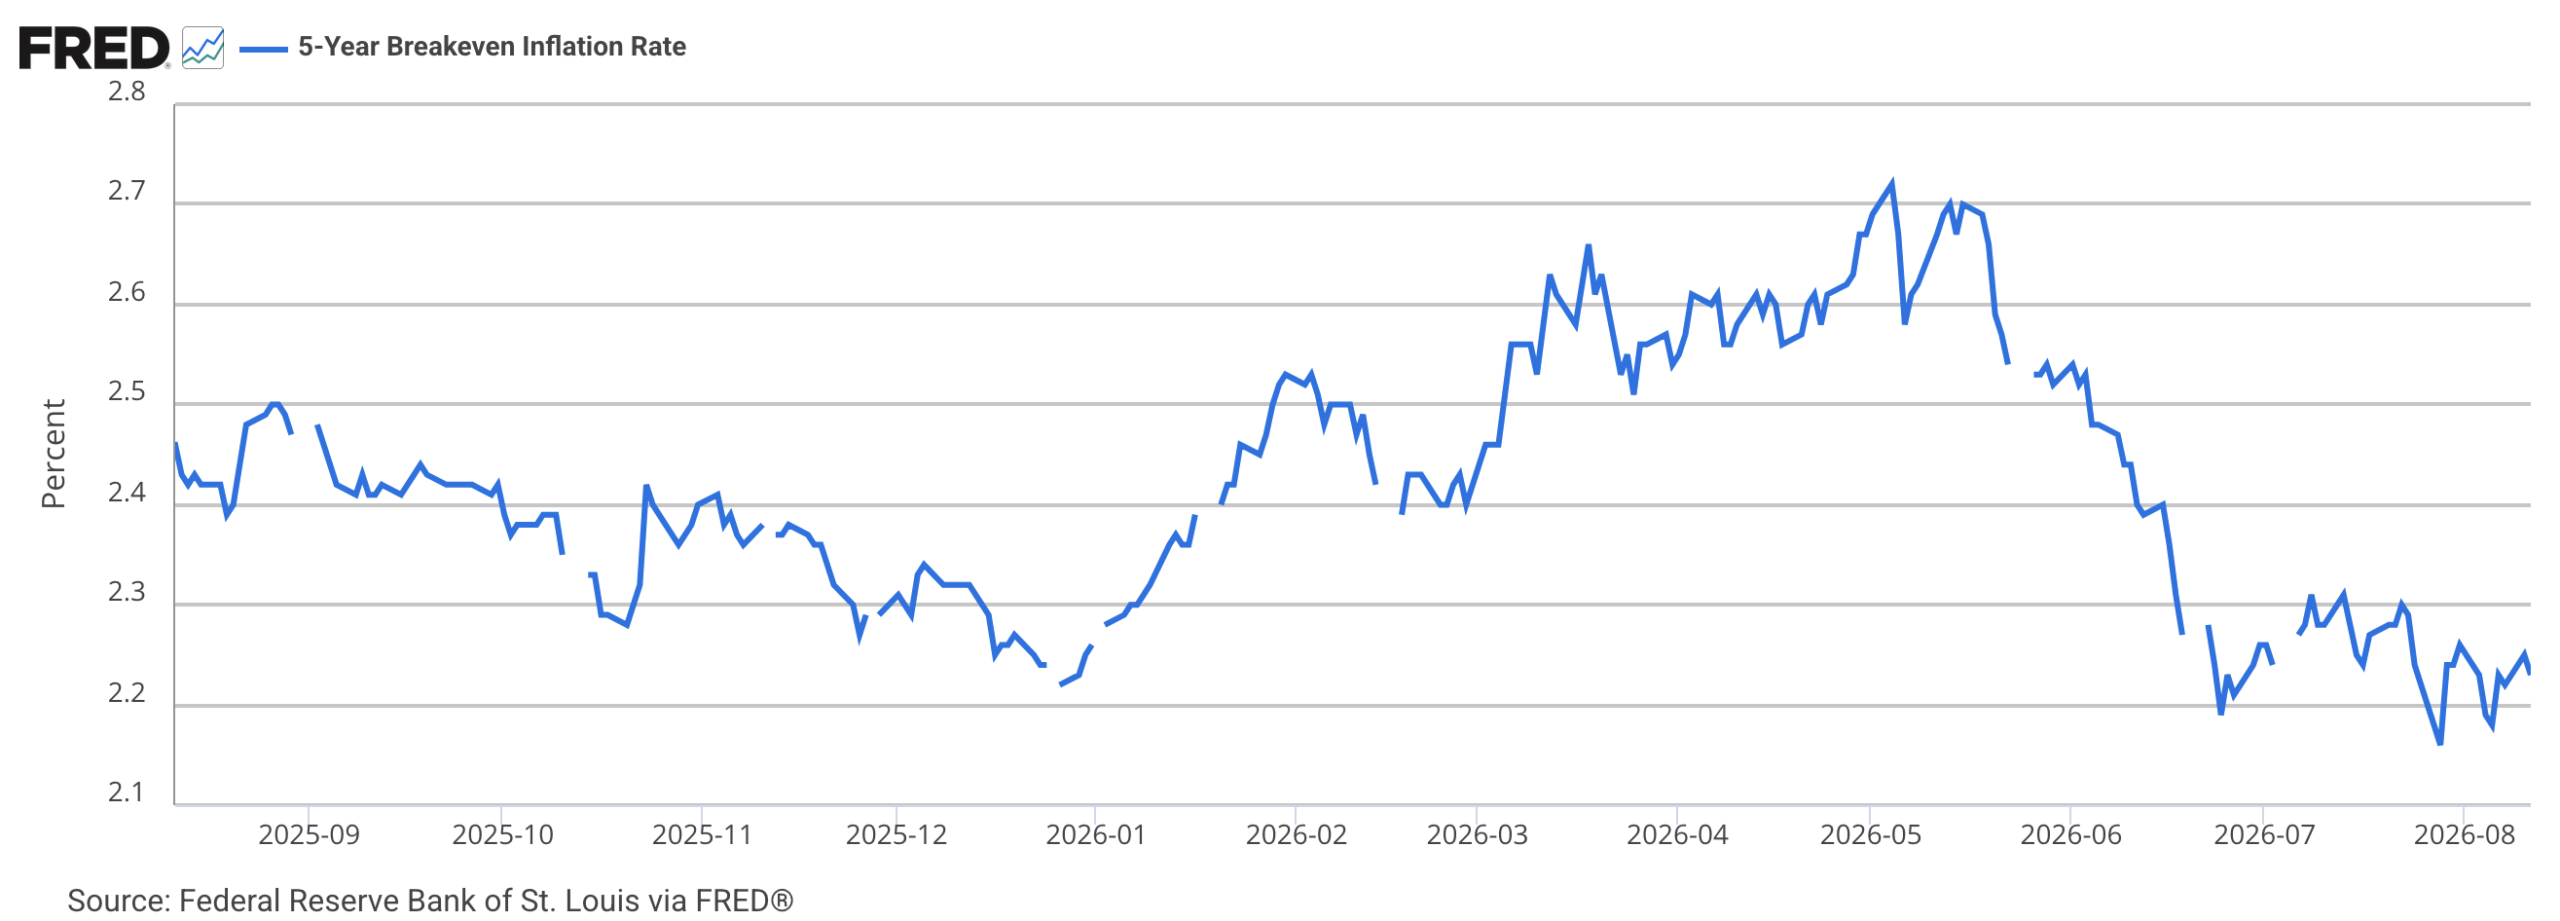
Finally, while inflation is top of mind among the investing public, institutions are less concerned about the pricing pressures. The blue line below tracks the U.S. 5-Year breakeven inflation rate — a gauge of institutions’ annual inflation expectations over the next five years. And with the metric standing at 2.23% as of Aug. 11, it shows much less apprehension than the narrative suggests.
Turning to the financial markets, gold has found its footing in recent days and could be poised for a substantial comeback into year-end.
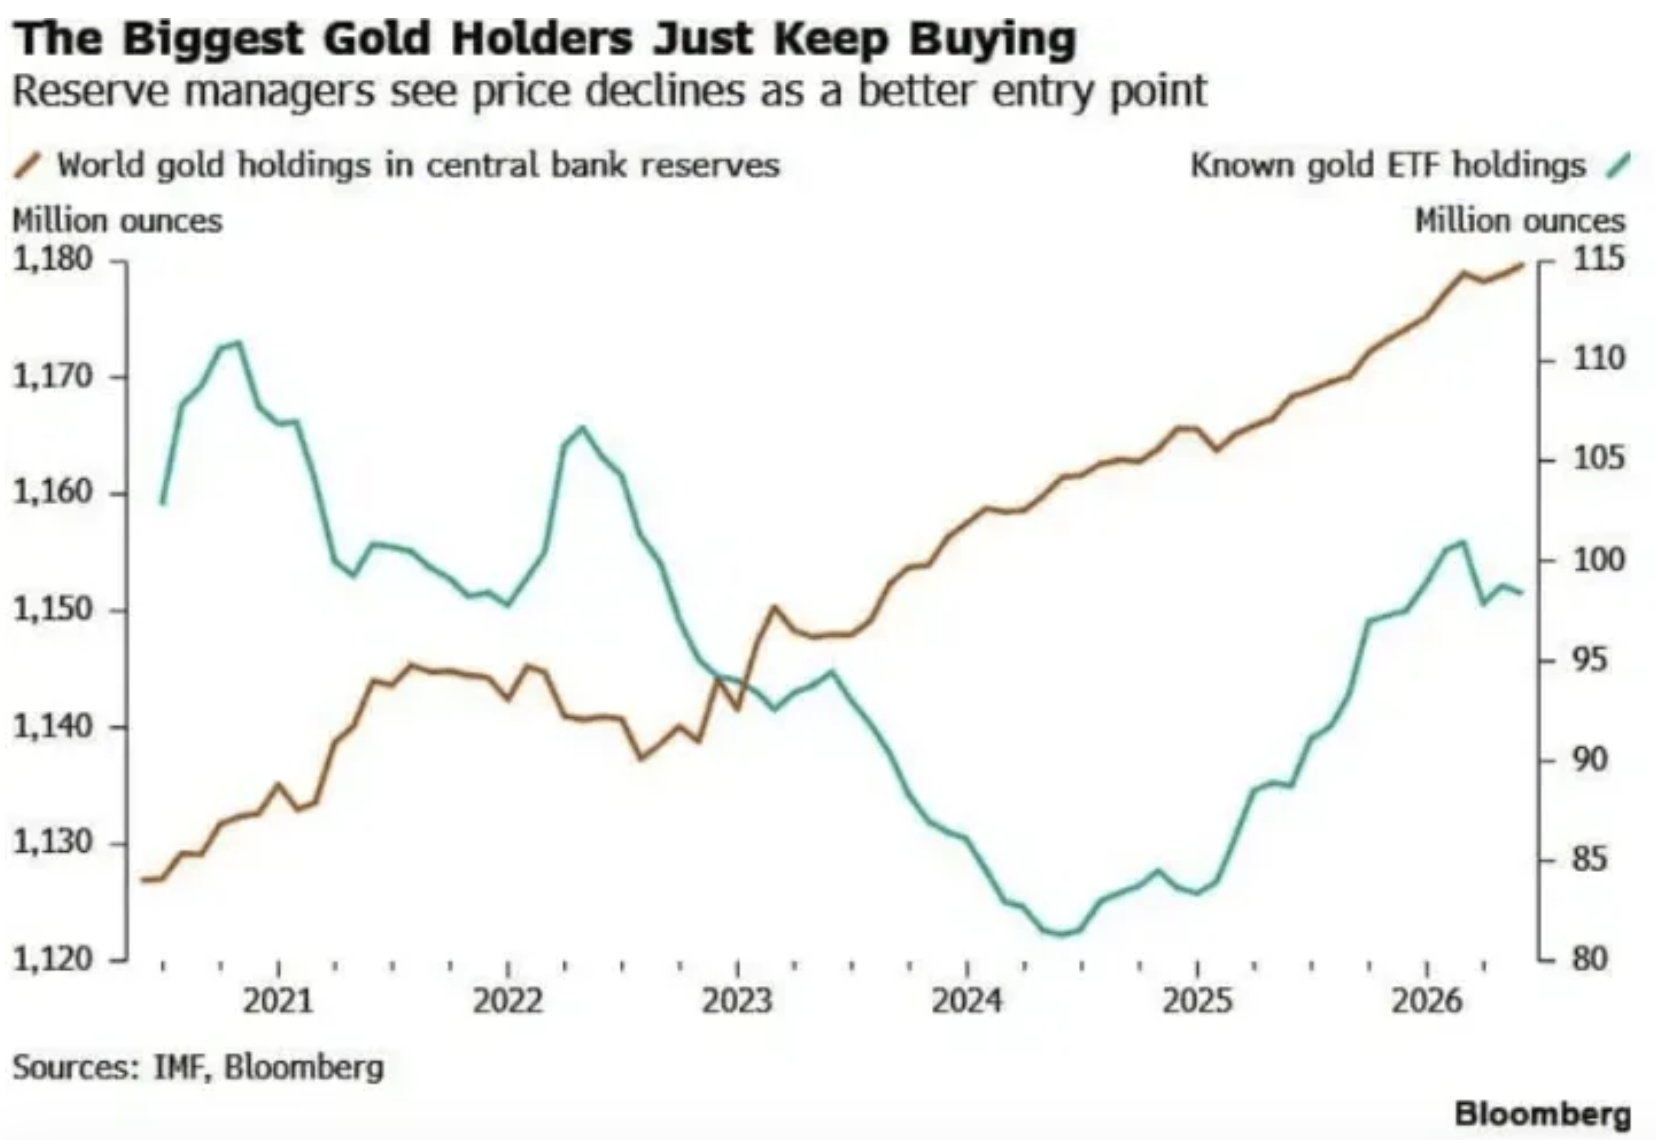
To explain, the green line above tracks known gold ETF holdings, while the brown line above tracks world gold holdings in central bank reserves. If you analyze the performance of the latter, you can see that the recent price slump didn’t deter the largest buyers in the market.
As such, the recent dip has only emboldened the bullion bulls, and when combined with oversold conditions and strong fundamentals, the activity could help propel gold higher over the next several months.
Are you thinking about diversifying into precious metals? Talk to your financial advisor about initiating a gold IRA account today, allowing you to invest in this red-hot asset on a tax-advantaged basis. Additionally, our complimentary CPI inflation calculator remains at your disposal, enabling you to assess inflation’s impact on your finances. Please seek the guidance of a financial advisor before making any investment decision.
As a worthwhile option, Augusta Precious Metals specializes in precious metal IRAs, helping to roll your existing retirement accounts, such as a 401 (k), into IRAs backed by physical gold or silver. You can also purchase bullion directly, and the company has an exceptional reputation, with either AAA or 4.5 to 5-star reviews across multiple ratings agencies.
For more alternatives, our guide on the Top 12 Best Gold Investment Firms covers the pros and cons of the top dealers available. You can compare items like product availability, investment minimums, and buyback policies to determine the right option for you.
Furthermore, if you need a financial reset but are unsure which company and path are right for you, several reputable options are available.
Up first, CuraDebt has been in business since 1996 and helps Americans struggling with unsecured claims like credit cards, personal loans, medical bills, and tax obligations. The company helps negotiate with creditors on your behalf and has roughly 300 positive reviews. The only downside is that service is not available in all states.
Second, Americor sets itself apart by providing counseling and consolidation services, but also offers in-house loans through its affiliate lender, Credit9. The firm has nearly 25,000 positive reviews, but may not be the best fit if you have a low credit score.
Similarly, we created an extensive guide covering the 23 Best Debt Relief Companies that deserve consideration. Comparing the various options helps identify their strengths and weaknesses, and often makes it easier to find the best option for your unique situation.


Alex Demolitor is a financial writer and cross-asset analyst who completed the CFA Program, passing all three levels of the CFA exams. He has a Bachelors degree from King's College in Ontario and specializes in the fundamental analysis of stocks, bonds, commodities, and FX, with a focus on U.S. and Canadian economic indicators like CPI and inflation. His market analysis has appeared on major publications such as FXEmpire, Investing.com, and AdvisorPedia.