-v3")
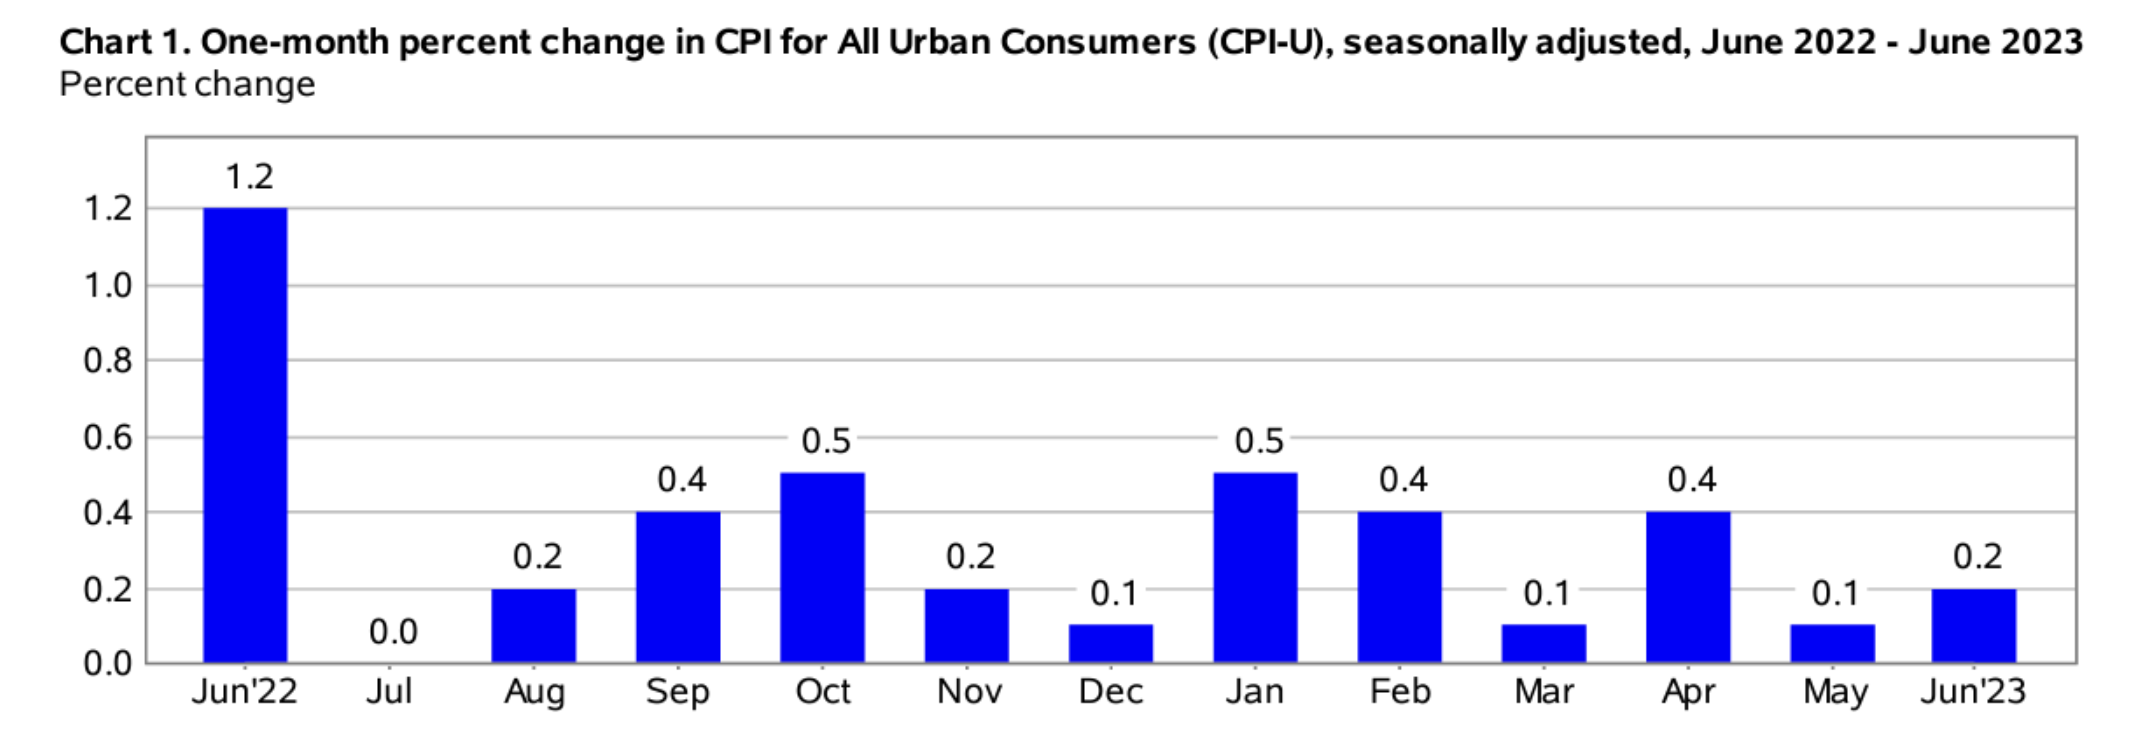
The Consumer Price Index for All Urban Consumers (CPI-U) increased by 0.2% on a seasonally unadjusted basis in June 2023, according to the Bureau of Labor Statistics report published July 12. Year-over-year, before seasonal adjustment the all-items index grew by 3.0%, constituting a major deceleration in the CPI-U from May’s 4.0% reading.
June’s rosy CPI report is the lowest in two years, when March 2021’s CPI report came in at 2.6% year-over-year. This month’s CPI report fared better than economists and investors expected, causing an immediate surge in the benchmark stock market indices on the morning of July 12. The rapid deceleration of the inflation rate in the U.S. is being taken by many as evidence that the Federal Reserve’s hawkish interest rate policy is performing as intended by successfully reining in inflation.
Nonetheless, the June 2023 CPI numbers are still 50% higher than the Fed’s target inflation rate of 2%—a figure that some doubt is possible to achieve without future rate hikes from the central bank.
Source: Bureau of Labor Statistics
June’s monthly CPI figure (0.2) came in higher than the previous month’s (0.1). The previous month’s “blip” in the monthly CPI report can be largely explained by the base-year effect seen between April 2021 and 2022 due to the Russian invasion of Ukraine, an event that saw immediate and large-scale price increases in oil, gas, and certain natural resources. These prices then partially settled in the subsequent months.
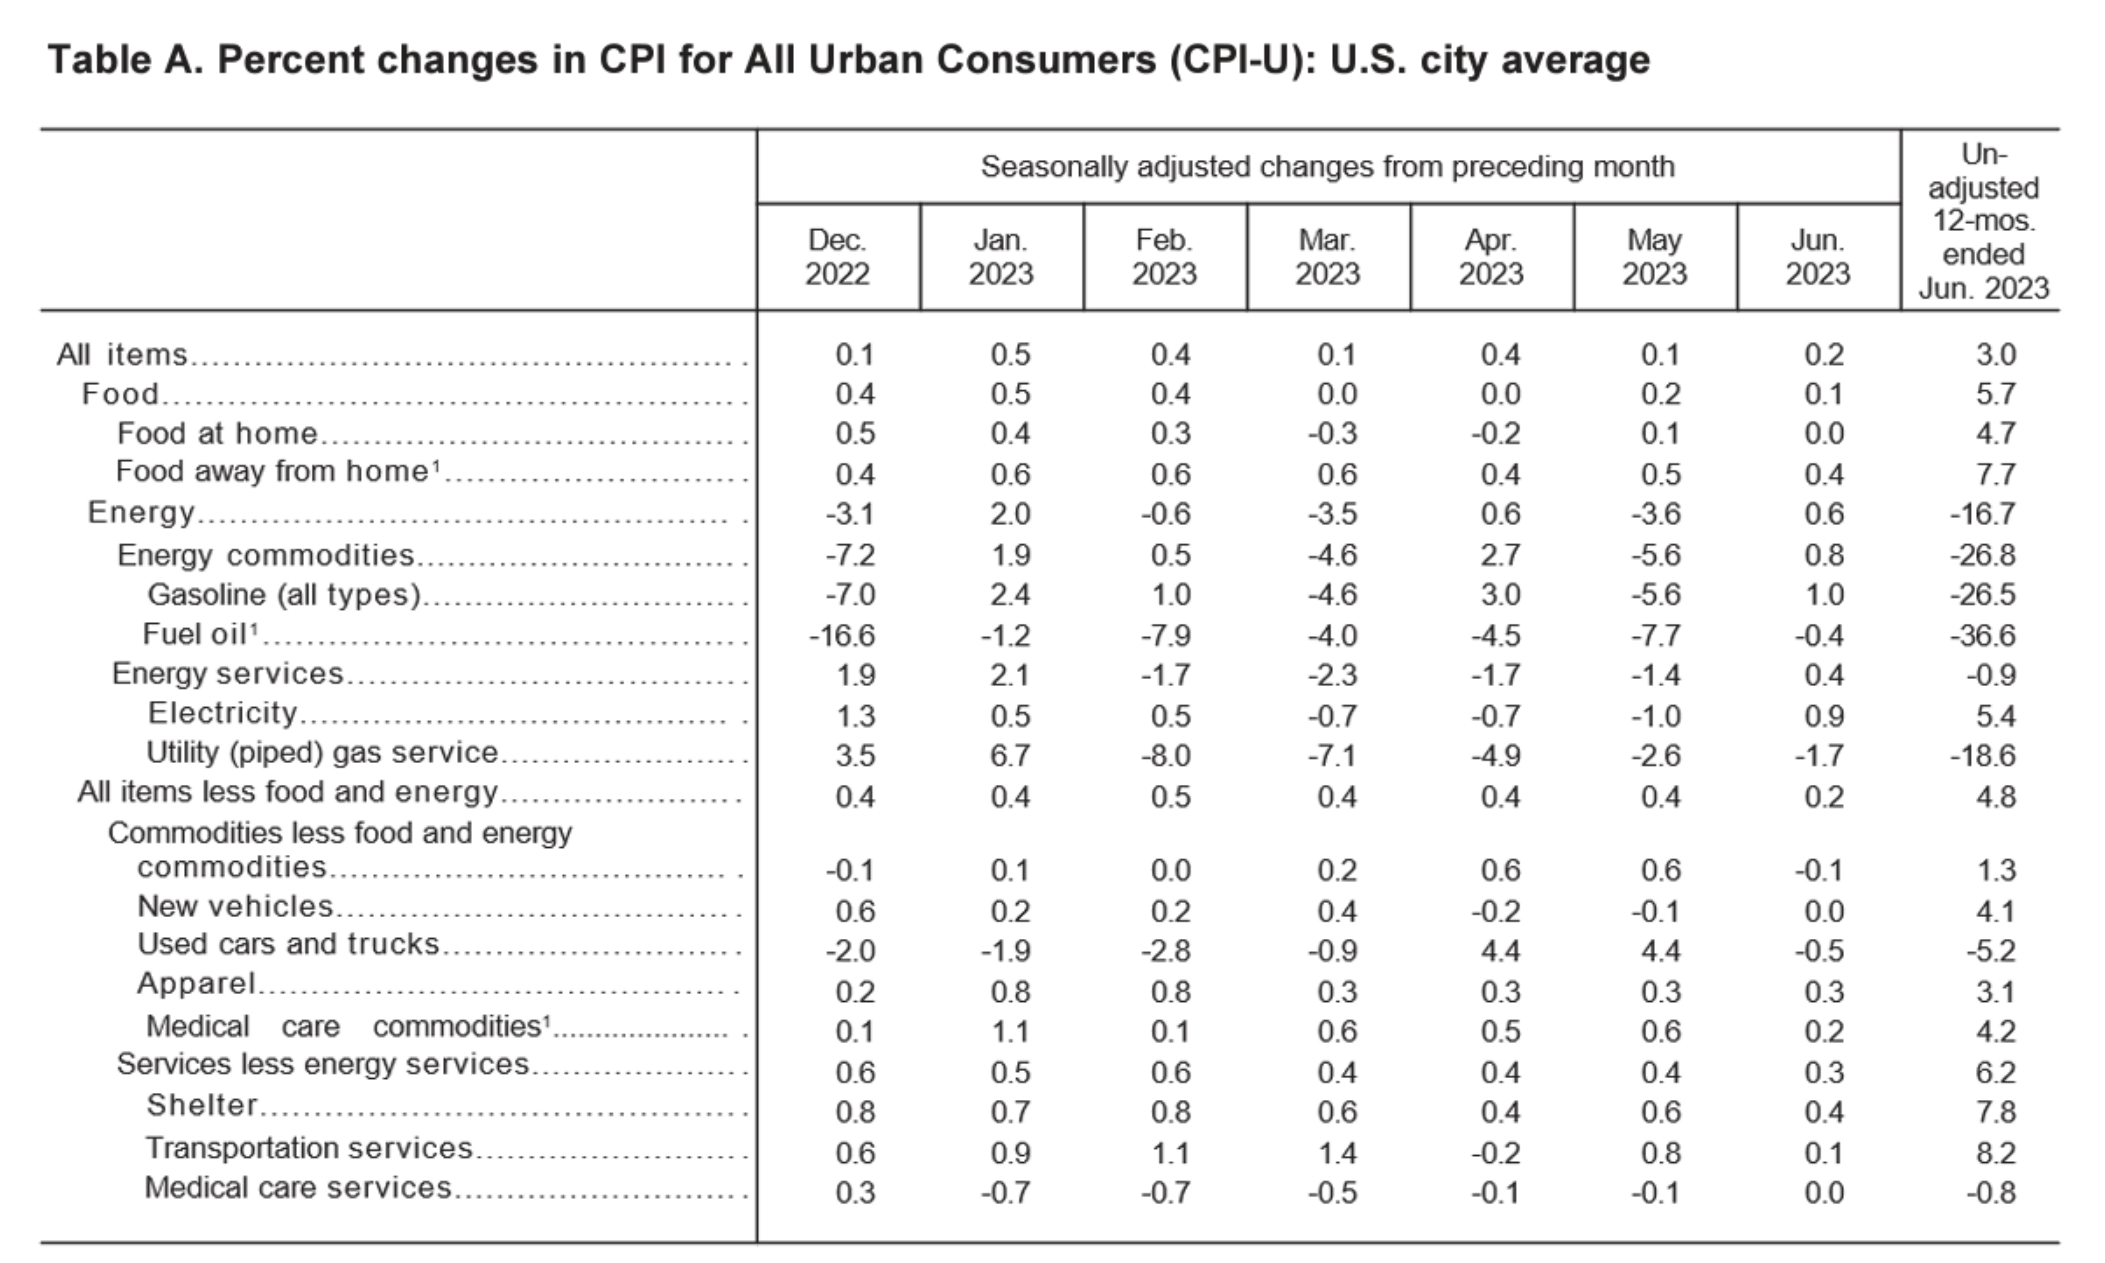
As depicted in the table above, the June 2023 CPI figure was largely driven by increases in consumer energy commodities and overall energy price increases.
Food Prices
The food index rose 0.1 percent in June after going unchanged in April and increasing 0.1 percent in May, representing a core market segment where consumer prices stagnated compared to the month prior. Notably, egg prices fell 7.3 percent in June after falling significantly in May—in total, egg prices have fallen by nearly half since the start of the year following a devastating avian flu outbreak that killed 43 million hens in 2022.
The meats, poultry, and eggs index dropped by 0.4 percent in June on the heels of an even large 1.2 percent decrease in May(-1.2%). However, year-over-year, the food at home index has risen by 4.7 percent, meaning your total grocery bill today compared to June 2022 is nearly 5 percent higher on average.
Energy Prices
The energy index rose in June May (0.6%) after falling in May. Notably, gasoline prices increased by 1.0 percent after dropping 5.6 percent in May. Concurrently, natural gas fell by 1.7 percent in June, marking the third consecutive month of natural gas price cuts. Fuel oil prices also fell, by about 0.4 percent in June.
Overall, energy costs inched up in June, constituting a minor deviation in the general trendline of falling energy prices ongoing since March. Year-over-year, energy prices are up 16.7 percent over 12 months.
Core June 2023 CPI
Regarding the core CPI data for June 2023 (inflation less food and energy), the index rose 0.2% month-over-month in June, down from a 0.6 percent acceleration in May. Below is an itemized breakdown of the main price fluctuations seen within June’s core CPI reading:
- Shelter index: +0.4% (+0.6% in May)
- Used cars and trucks: +4.4 (+4.4% in May)
- Lodging away from home: (-2.0%) (+1.8% in May)
- Medical care index: +0.1% (unchanged from May)
- Household furnishings: +3.6%
- Airline fares: (-8.1%) (-3.0% in May)
Source: Bureau of Labor Statistics
Seasonally Unadjusted CPI Data for June 2023
Before seasonal adjustments, the CPI-U for June 2023 increased (+0.3%) for the month, rising to an index level of 305.109. Since these figures are unadjusted, they include regular seasonal price fluctuations that generally occur by the same margins every year.
Now Is The Time to Protect Your Wealth
Although June’s CPI report may seem rosy, the U.S. dollar is only continuing to lose value by the day. The result? Millions of American families with less purchasing power than they had the month prior, making it that much harder to make ends meet. While inflation is beginning to enter familiar territory, the average American household has lost the equivalent of $7,400 in annual wages due to inflation and rate hikes since 2021.
Luckily, we can mitigate the adverse effects of inflation. Consider speaking to your financial advisor about diversifying your investment portfolio with alternative assets that may help insulate your savings from the devaluation of the U.S. dollar.
Gold and silver have historically outperformed traditional securities during most recessions and economic crises, including the 2020 stock market crash and the 2008 global financial crisis. For many, gold functions as an inflation hedge, providing a much-needed store of value when fiat assets depreciate. No wonder why it’s sought after by many successful investors like Ray Dalio and Kevin O’Leary as a risk management tool.
Want to get started investing in silver or gold? Open an account today with one of the best-rated gold IRA service providers. While you’re at it, stay up-to-date on inflation news in the months ahead. You can easily keep tabs on how inflation is holding back your household’s purchasing power by using our free CPI inflation calculator tool that tracks the wealth-eroding effects of inflation.

Liam Hunt, M.A., is a writer specializing in finance and international affairs. His articles have appeared in the Toronto Star, Ottawa Citizen, and Vancouver Sun, and his expert commentary has been featured in Forbes, Bloomerg, Barron's, and the New York Post.
