-v3")
This morning the Bureau of Labor Statistics released consumer price data for November that was marginally ahead of expectations. For the year, prices measured by the Consumer Price Index for All Urban Consumers (CPI-U) climbed 1.7%, compared to an anticipated 1.6%. This is good news for the US economy as inflation has remained stubbornly low while jobs and other economic indicators have been more positive. Today’s report comes in the shadow of yesterday’s much anticipated FOMC decision to tighten monetary policy by raising rates by 0.25%.
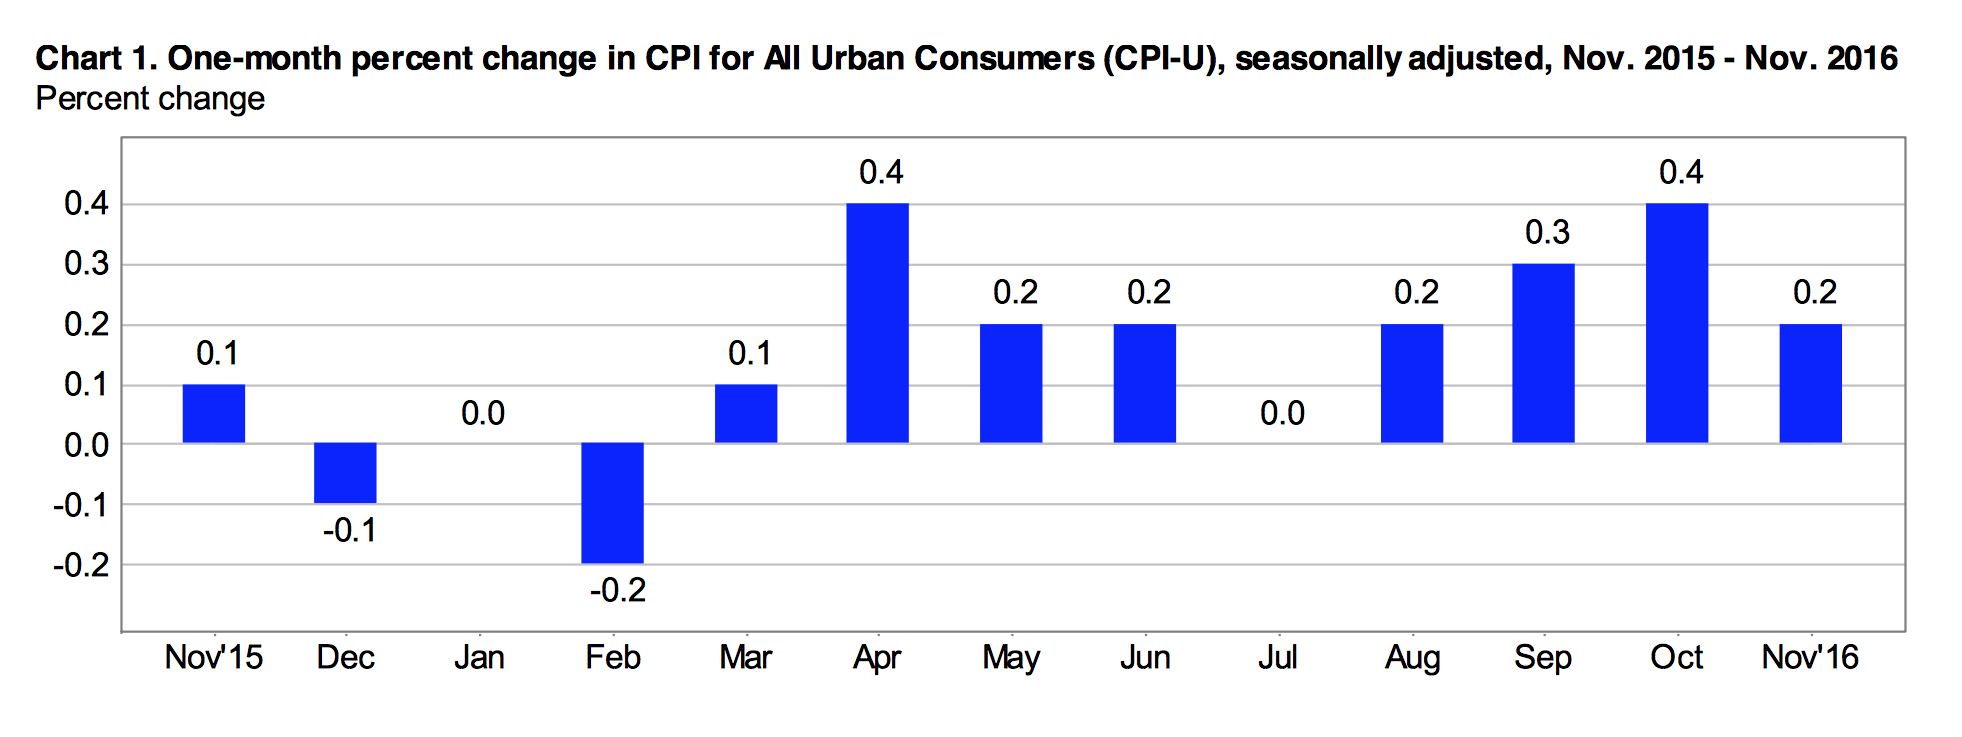
The 0.2% decline in prices in November reflects a seasonal phenomena, which when corrected for, yields a 0.2% increase in the all items index. In October, seasonally adjusted prices climbed 0.4%. Core inflation, which excludes food and energy, was flat in November but after seasonal adjustments, rose 0.2%, compared to 0.1% in October. Over the relevant year, the core index climbed a healthy 2.1%.
Monthly Inflation
The 0.2% seasonally adjusted increase in the all items index in November can be largely attributed to a 1.2% jump in the energy index. The price of gas rose 2.7% in November on a seasonally adjusted basis. Prior to adjustments, prices were down 2.4% at the pump. Energy service prices fell 1% year-over-year, while energy commodity prices were 2.5% higher.
Food prices (seasonally adjusted) were flat for the month including a 0.1% dip in prices at the grocery store, adding to a streak of declines over the previous six months. The cost of meat declined 0.1% in November, following a 0.7% decline in October. Also significant, a 1.1% decline in the price of milk in November after falling a 0.9% in October. The price of fruits and vegetables slipped 0.2% in November canceling out an equal gain in October. Meanwhile, the index for food away from home inched up 0.1% in November.
Shelter, which accounts for 33.5% of the all items indexed, was 0.4% more expensive in November as rent prices grew 0.3% and the index for owners equivalent of rent was up 0.4%. Medical care commodities added 0.6% on a seasonally adjusted basis in November and the price of medical care services reportedly added 0.3 to match October’s growth. The index for airline fares slid a notable 1.3% in November after also diving 2.2% in October.
Annual Inflation
The core index, up 2.1% for the year ending in November was greatly impacted by increasing rental prices. The shelter index posted 3.6% annual growth, with the subindex for rent of primary residence growing 3.9% year-over-year (the shelter index accounts for over 42% of the core index). Medical care costs also climbed through the year as the index for medical care commodities added 4.3% and the indexed for medical care services was up 3.9%. The most significant change was in the price of hospital services, up 4.3% annually.
The transportation services index reportedly added 2.5% for the year. Within this index, motor vehicle insurance prices were 6.7% higher while Airline fares declined 6.6%.
Weighting on annual inflation numbers, the price of food fell 0.4% over the relevant year. At the grocery store prices were down 2.2% and lower in every component of grocery store spending. The most significant decline was posted by the index for meat, poultry, fish and eggs, down an annual 6% in November.
The energy index increased 1.1% over the 12-months ending in November, including higher costs for both energy commodities and energy services, up 0.8% and 1.5% respectively. At the pump, consumers paid 1% more for gas in November compared to November of 2015.
Regional Inflation
Monthly inflation was strongest in the Northeast where prices remained flat prior to seasonal adjustments compared to a 0.2% decline for the country as a whole. Prices were most sluggish in the Midwest, down 0.3% for the month. Also, inflation was most robust in larger cities, those with populations over 1.5 million posted a net monthly decline of only 0.1%.
On an annual basis, inflation was also highest in bigger cities. In Western urban areas the all items index climbed 2.3% compared to a national average of 1.7%. Prices growth was slower in the Midwest and the South, up only 1.2% and 1.6% annually.
Economic Outlook
On Wednesday, the Federal Reserve upped its benchmark interest rate by 0.25% to 0.5%-0.75%, recognizing the “considerable progress” the economy has made in terms of job growth and price stability. The Fed voted unanimously to raise rates, marking the second hike since the financial crisis of 2008.
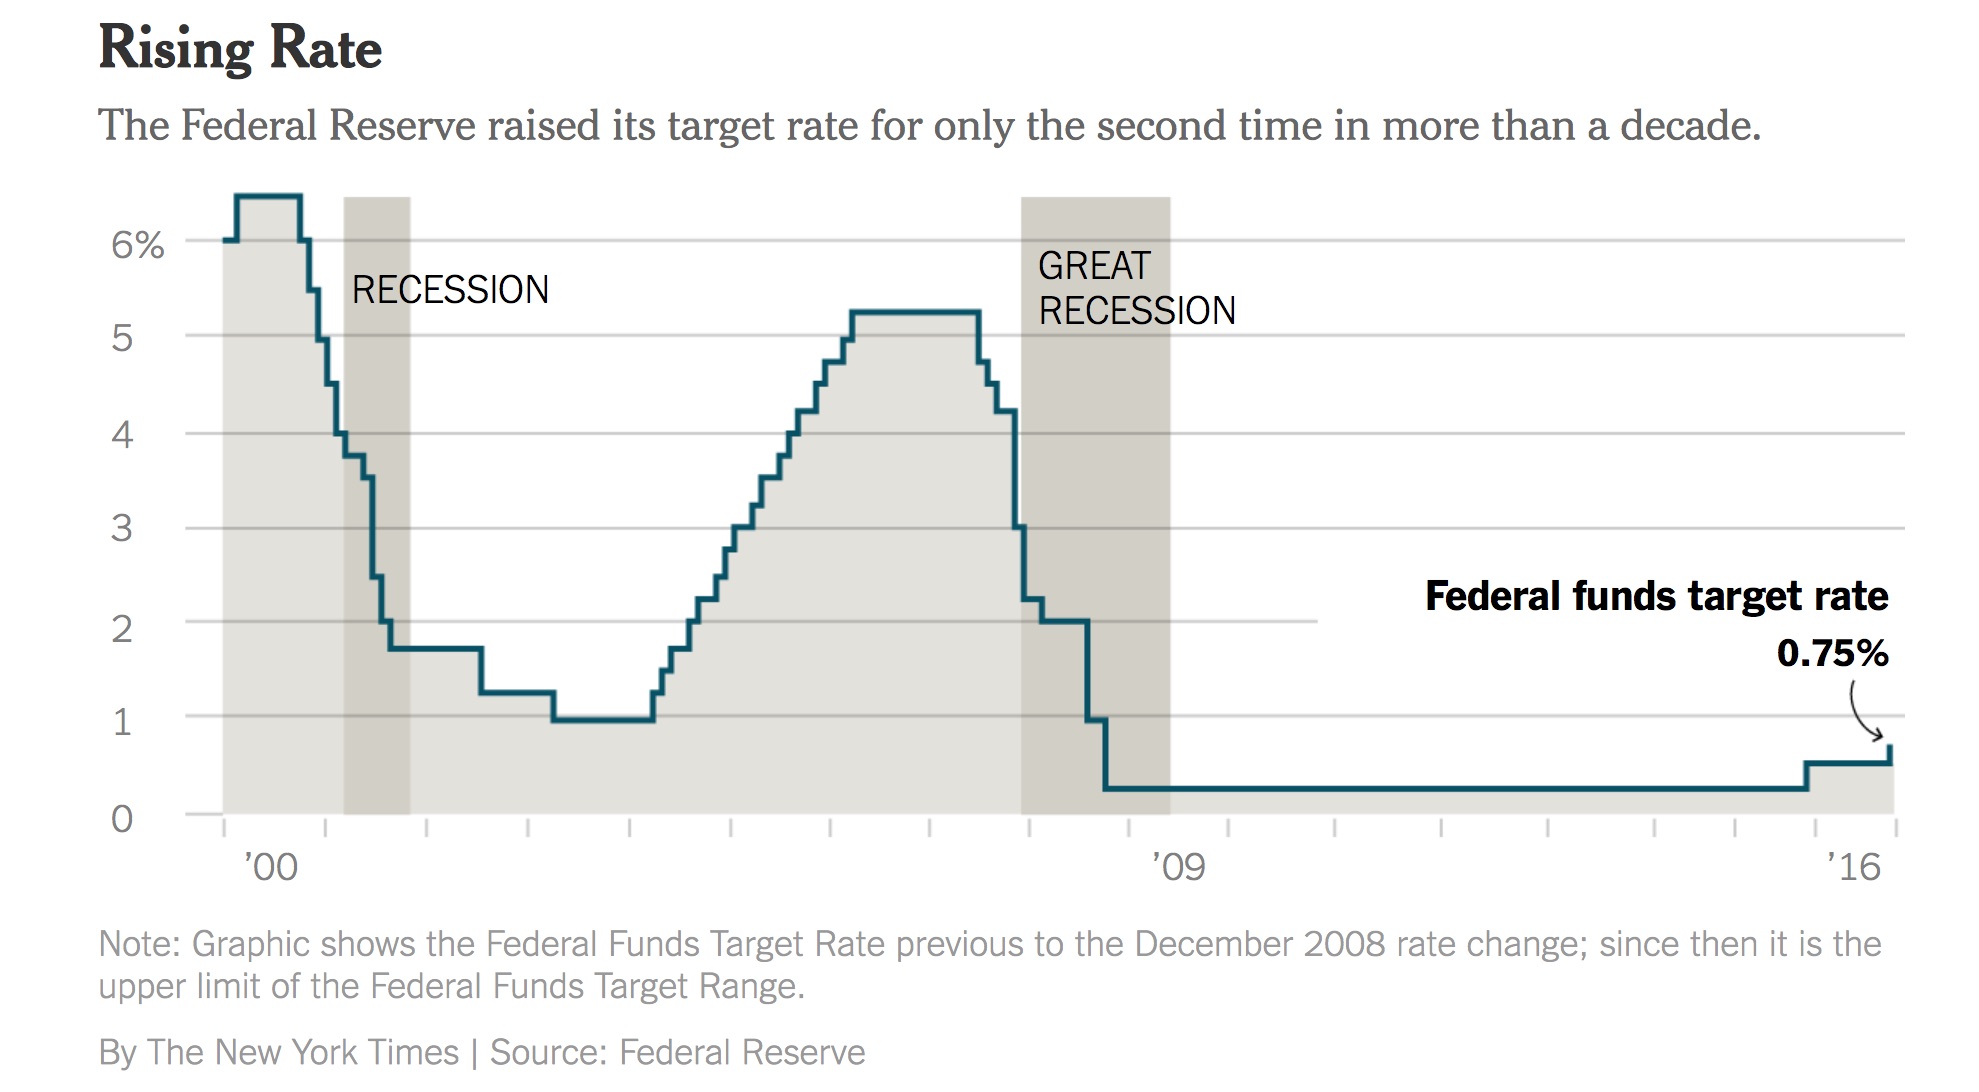
Expectations are for continued economic growth and for inflation rise t0 2% over the next couple of years – which is their target rate. Although, the cloud of uncertainty that surrounds the political environment and the potential for large policy shifts in the near future make the path of interest rates and the direction of the economy highly unpredictable. As of Wednesday, the fed anticipates three rate hikes in 2017.


Emily is a Canadian financial blogger with multiple degrees in economics and extensive professional experience as a financial analyst. She was formerly a Ph.D. candidate at the University of Guelph's School of Agricultural Economics. Before that, she received an MA from the University of San Francisco in International Development Economics. She also has a BA in Math with a minor in Economics.
