-v3")
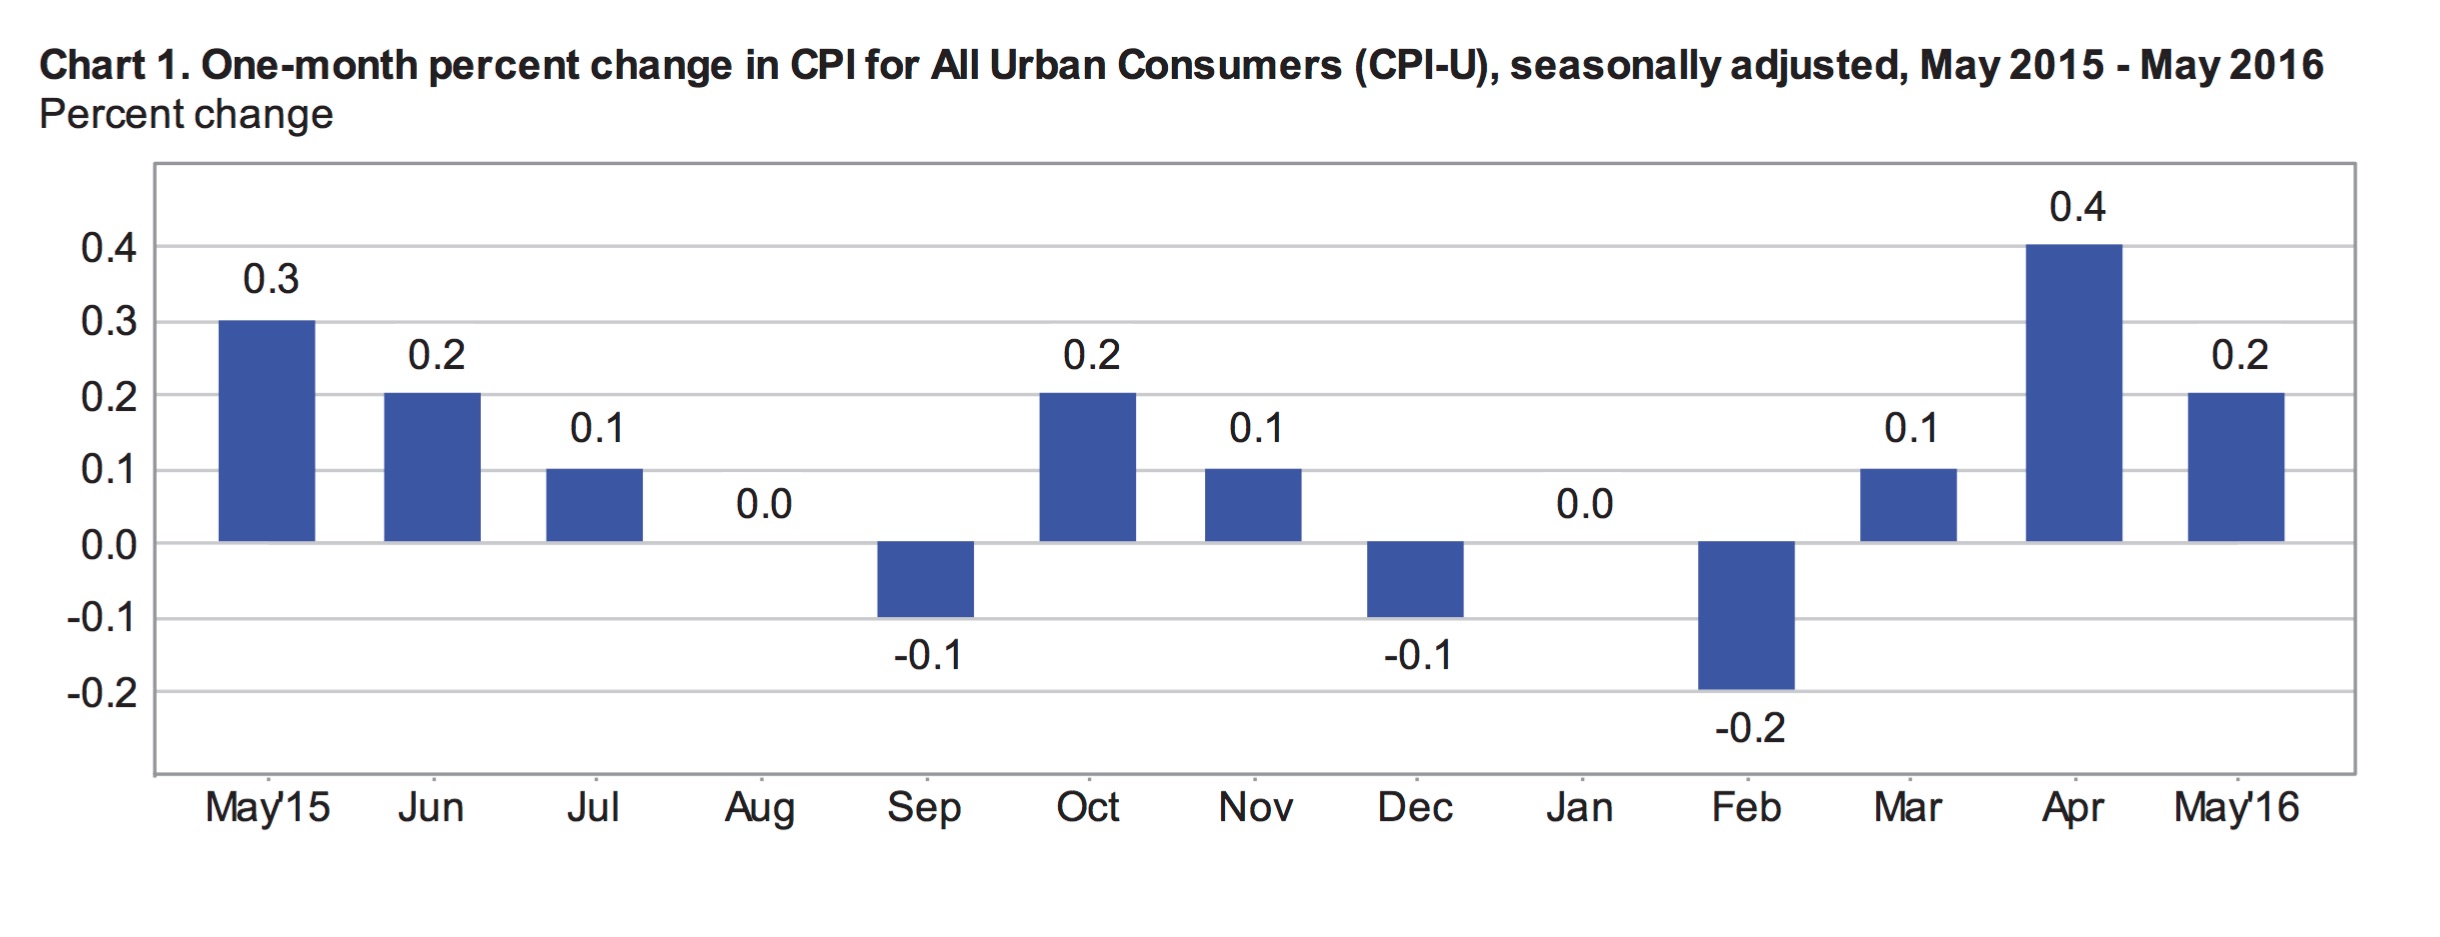
The Consumer Price Index for All Urban Consumers (CPI-U), a popular measure of inflation, climbed 0.4% in May according to today’s monthly report from the Bureau of Labor Statistics. With seasonal adjustments, inflation was 0.2% in May, down from 0.4% in April. Excluding food and energy, the seasonally adjusted index climbed 0.2% in May, matching the previous month’s core inflation reading. Economists surveyed by the WSJ prior to today’s report had expected the CPI to rise 0.3% in May.
For the year ending in May, prior to seasonal adjustments, prices climbed 1.0%, down from 1.1% for the year ending in April. An annual 10.1% decline in the energy index at the end of May had a significant impact on overall inflation. Energy comprises about 6.8% of the total CPI-U. The significant negative impact of falling energy prices is mostly the result of cheap gas (down 16.1% year over year and accounting for nearly 3.1% of the index). Overall food prices were up only 0.7% for the year ending in May. Excluding food and energy, prices climbed an annual 2.2% led by higher shelter and medical costs.
May Inflation
Food prices declined in May to offset higher prices for shelter, medical care and education. Food, which accounts for approximately 14% of the CPI-U is broken down into food at home (around 8%) and food away from home (about 6%). Food at home is divided into 6 major grocery store categories. The prices of food at home declined across the board in May with all six grocery store categories declining. The price of food away from home increased 0.2% in May.
Seasonally Adjusted Monthly % Change in CPI-U by Category (2016)
| January | February | March | April | May | June | July | |
|---|---|---|---|---|---|---|---|
| All Items | 0 | -0.2 | 0.1 | 0.4 | 0.2 | 0.2 | 0.0 |
| Food | 0 | 0.2 | -0.2 | 0.2 | -0.2 | -0.1 | 0.0 |
| Energy | -2.8 | -6.0 | 0.9 | 3.4 | 1.2 | 1.3 | -1.6 |
| Gasoline | -4.8 | -12.5 | 2.2 | 8.1 | 2.3 | 3.3 | -4.7 |
| Fuel Oil (non seasonally adjusted) | -6.5 | -2.9 | 1.7 | 1.9 | 6.2 | 3.7 | -1.5 |
| Electricity | -0.7 | -0.2 | 0.4 | -0.3 | -0.2 | -0.5 | 0.5 |
| Utilities (piped gas service) | -0.6 | 1.0 | -0.7 | 0.6 | 1.7 | -0.4 | 3.1 |
| Energy Services | -0.7 | 0.1 | 0.2 | -0.1 | 0.2 | -0.5 | 1.0 |
| All Items Less Food and Energy | 0.3 | 0.3 | 0.1 | 0.2 | 0.2 | 0.2 | 0.1 |
| Services Less Energy Services | 0.3 | 0.3 | 0.2 | 0.3 | 0.4 | 0.3 | 0.2 |
| Shelter | 0.3 | 0.3 | 0.2 | 0.3 | 0.4 | 0.3 | 0.2 |
| Transportation Services | 0.4 | 0.2 | 0.2 | 0.7 | 0.3 | 0.3 | -0.2 |
| Medical Care Services | 0.5 | 0.5 | 0.1 | 0.3 | 0.5 | 0.2 | 0.5 |
The energy index increased by 1.2% in May following a monthly increase of 3.4% in April. Gasoline accounts for nearly half of the energy index. Gas prices were up 2.3% in May following gains of 2.2% and 8.1% in March and April. Within the energy index, electricity was the only component to post a decline in prices in May, down 0.2%.
The index for all items less food and energy was up 0.2% in May, matching the growth rate in April. Shelter is the major component in this index, accounting for over 40%. The price of shelter has grown steadily in recent months and continued this trend, posting a 0.4% increase in May following increases of 0.2% and o.4% in March and April.
12-Month Inflation
For the year ending in May, the CPI-U grew 1.0% following an annual rate of 1.1% in April. Inflation remains well below the Fed’s target as the energy index continues to quell annual numbers. The price of food has also failed to spark much inflation, climbing 0.7% over the 12-months ending in May. Stripping out food and energy, overall prices were up 2.2% year over year.
Shelter prices were a major contributor to inflation for the year as the cost of rent for primary residences increased 3.8% and the index measuring owners equivalent of rent grew 3.3%. Within the shelter index, water and sewer and trash collection services saw prices grow 4.1% over the relevant year.
Medical care service costs were reportedly 3.5% more expensive in May compared to a year earlier. Higher prices for prescription drugs, up 3.3% contributed to this but were buffered by lower prices for non prescription drugs, down 1.3% for the year. Over this period, the price of health insurance also grew 6.3%.
Motor vehicle insurance costs increased 6.6% for the year ending in May, pulling the transportation services index up an annual 3.2%. Within transportation services, the cost of airline fares dropped 3.1% year over year and the index for car and truck rentals grew 4.9% annualy. Over the same period, new vehicle prices slipped o.2% and the cost of used vehicles declined 2.3%.
Inflation by Region
May’s inflation was distributed relatively equitably across the country and across different size cities. At 0.3%, inflation was slightly below the national average. Northeastern states posted slightly higher inflation in May at 0.6% compared to 0.4% in the midwest and south and 0.5% in western urban areas. For the year, inflation was significantly higher in western states at 1.5% compared to a national average of 1%.
Over the year, inflation was lowest in medium size urban areas (populations between 50,000 and 1.5 million) at 0.6%. Larger and smaller sized cities saw prices growing much faster.
| Urban Population | 12-month | August |
|---|---|---|
| over 1.5 million | 1.3% | 0.1% |
| 50,000 to 1.5 million | 0.7% | 0.1% |
| under 50,000 | 0.8% | -0.1% |
| Urban Regions | 12-month | August |
|---|---|---|
| Northeast | 1.1% | 0.1% |
| Midwest | 0.6% | 0.1% |
| South | 1.0% | 0.1% |
| West | 1.6% | 0.1% |
Outlook
Today’s report comes on the back of the FOMC’s mid June meeting. The unanimous decision to leave rates unchanged at 0.25%-0.5% was the result of disappointing economic data, a stagnant labor market and uncertainty related to the looming possibility of Britain voting to exit the EU. The fed also lowered their interest rate projections for 2017 and 2018 but left open the possibility of another rate hike in 2016, possibly as early as next month.


Emily is a Canadian financial blogger with multiple degrees in economics and extensive professional experience as a financial analyst. She was formerly a Ph.D. candidate at the University of Guelph's School of Agricultural Economics. Before that, she received an MA from the University of San Francisco in International Development Economics. She also has a BA in Math with a minor in Economics.
