-v3")
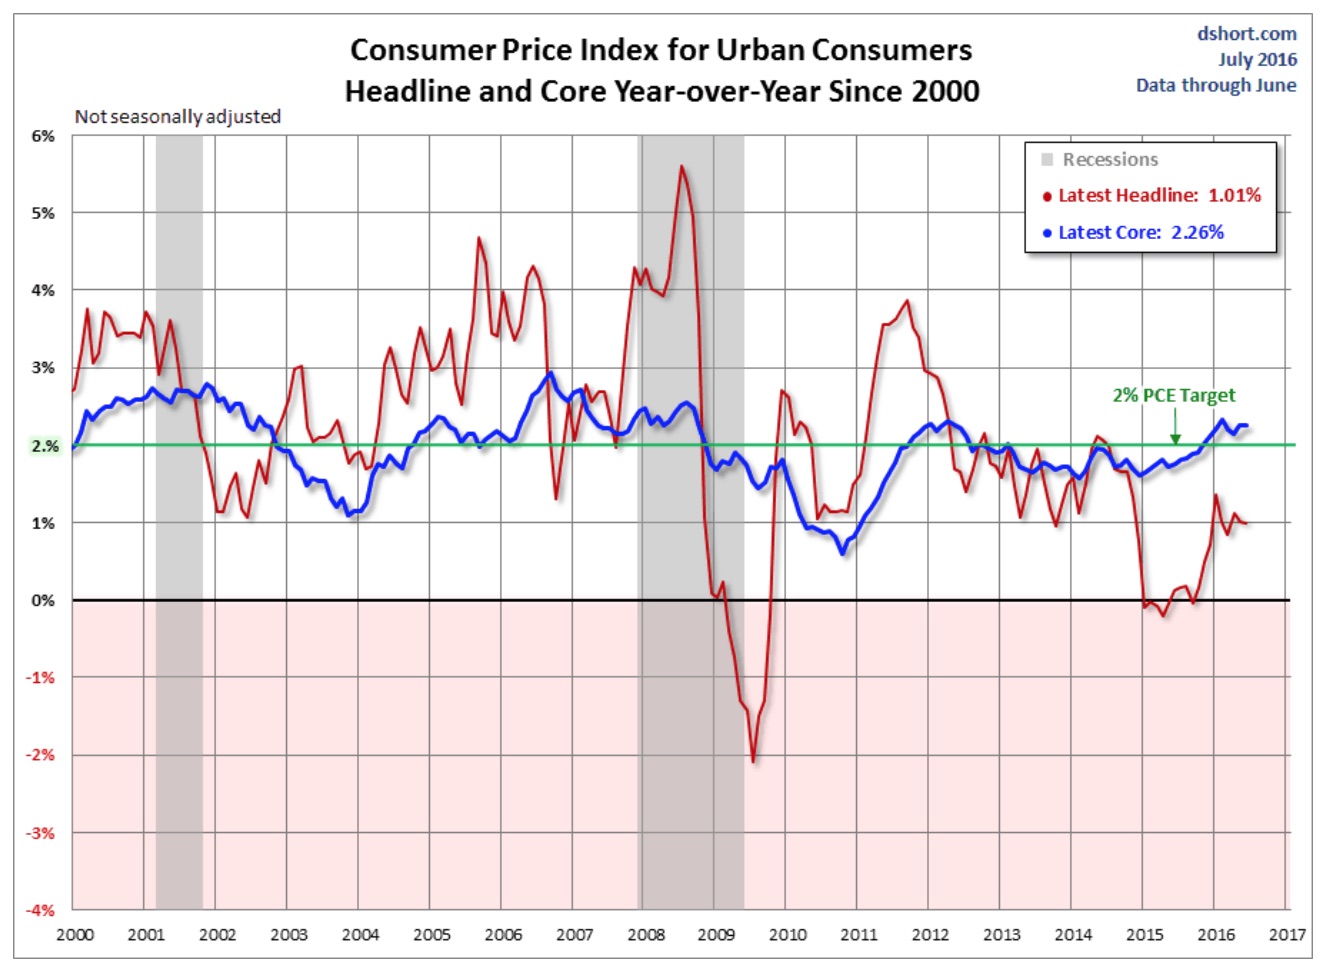
According to the BLS’s monthly inflation report, consumer prices climbed 0.3% in June, down slightly from 0.4% in May. However, with seasonal adjustments, inflation was 0.2% in both May and June. For the year ending in June, inflation was 1%, in-line with the year ending in May. Expectations had been for marginally higher numbers in June. Overall, inflation appears steady but sluggish and remains stubbornly below the Fed’s 2% target.
Much of the volatility in the CPI reflects volatility in the price of gas. The positive trend in the core index over the past 18 months is driven by steady growth in the price of housing and cost of services. The special aggregate index for services encompasses about 63% of the items in the all-items index and was up 2.8% year-over-year in June. The remainder of the items in the CPI are categorized as commodities. The special aggregate index for commodities declined 2.0% over that period.
(source: advisorperspectives.com)
The core or all-items index excluding food and energy (two sectors with volatile prices that may not reflect true underlying economic strength) climbed 0.2% in June for the third month in a row. This measure of core inflation points to some underlying price pressure and is a positive sign for the US economy. Year-over-year, core prices were up 2.3%, significantly higher than the 10-year annual average core rate of 1.9% and above the 2% target.
Monthly Inflation
Much of the inflation in June can be attributed to a 4.4% (non-seasonally adjusted) monthly rise in gasoline prices. Shelter and transportation prices also pushed higher. Shelter prices were up 0.3%, with both the rent index and the owners equivalent of rent index up by that same amount. The transportation services index was up 0.3% in June because of a 3.2% spike in rental car prices. In May the rental car index was up 4.8%.
Overall food prices were down 0.1% with seasonal adjustments in June. The index for food at home fell 0.3% while food away from home climbed 0.2%. Declines in the index for meat, poultry, fish and eggs and the index for dairy and dairy related products, down 0.7% and 0.3% respectively, impacted prices at the grocery store.
Seasonally Adjusted Monthly % Change in CPI-U by Category (2016)
| January | February | March | April | May | June | July | |
|---|---|---|---|---|---|---|---|
| All Items | 0 | -0.2 | 0.1 | 0.4 | 0.2 | 0.2 | 0.0 |
| Food | 0 | 0.2 | -0.2 | 0.2 | -0.2 | -0.1 | 0.0 |
| Energy | -2.8 | -6.0 | 0.9 | 3.4 | 1.2 | 1.3 | -1.6 |
| Gasoline | -4.8 | -12.5 | 2.2 | 8.1 | 2.3 | 3.3 | -4.7 |
| Fuel Oil (non seasonally adjusted) | -6.5 | -2.9 | 1.7 | 1.9 | 6.2 | 3.7 | -1.5 |
| Electricity | -0.7 | -0.2 | 0.4 | -0.3 | -0.2 | -0.5 | 0.5 |
| Utilities (piped gas service) | -0.6 | 1.0 | -0.7 | 0.6 | 1.7 | -0.4 | 3.1 |
| Energy Services | -0.7 | 0.1 | 0.2 | -0.1 | 0.2 | -0.5 | 1.0 |
| All Items Less Food and Energy | 0.3 | 0.3 | 0.1 | 0.2 | 0.2 | 0.2 | 0.1 |
| Services Less Energy Services | 0.3 | 0.3 | 0.2 | 0.3 | 0.4 | 0.3 | 0.2 |
| Shelter | 0.3 | 0.3 | 0.2 | 0.3 | 0.4 | 0.3 | 0.2 |
| Transportation Services | 0.4 | 0.2 | 0.2 | 0.7 | 0.3 | 0.3 | -0.2 |
| Medical Care Services | 0.5 | 0.5 | 0.1 | 0.3 | 0.5 | 0.2 | 0.5 |
Apparel prices dropped a seasonally adjusted 0.4% in June after jumping 0.8% in May. The index for used cars and trucks, which accounts for over 2% of the all items index, declined by 1.1% in June, adding to May’s 1.3% decline.
Annual Inflation
The annual 1% inflation rate for the year ending in June was largely due to growing prices for shelter and medical care. The shelter index increased 3.5% year-over-year as the price of moving, storage and freight climbed 12.1%. Rent of shelter, which accounts for nearly a third of the all-items index, was a major contributor to inflation for the year ending in June. The rent index was up 3.8% year-over-year, while the index for owner’s equivalent of rent was up a similar 3.2%.
Medical care service prices increased 3.8% over 12-months and were bolstered by higher prices for health insurance and hospital services. The indexes for food and apparel were also marginally higher for the year, gaining 0.3% and 0.4% respectively. Within the food index, prices for food at home declined an annual 1.3%, with declines in four of the six grocery store indexes. The price of meat, fish, poultry and eggs fell 5.0% over the year ending in June. Meanwhile, the index for food away from home gained an annual 2.6%
Over the same period, the energy index declined 9.4%, including drops of 15.3% in energy commodity prices and 2.5% in energy service prices. The 15.4% decline in gas prices, which represents around 3.3% of the CPI and close to half of the energy index, was a major factor impacting inflation over the year.
Inflation By Region
June inflation was higher in western cities at 0.6% compared to the national average of 0.3%. Year-over-year, inflation was concentrated in larger western cities. The index for western urban centres with populations over 1.5 million was twice the national average at 2%. In San Francisco, consumer prices climbed 2.7% over the year.
| Urban Population | 12-month | August |
|---|---|---|
| over 1.5 million | 1.3% | 0.1% |
| 50,000 to 1.5 million | 0.7% | 0.1% |
| under 50,000 | 0.8% | -0.1% |
| Urban Regions | 12-month | August |
|---|---|---|
| Northeast | 1.1% | 0.1% |
| Midwest | 0.6% | 0.1% |
| South | 1.0% | 0.1% |
| West | 1.6% | 0.1% |
Outlook for the Economy
The US economy appears to be strengthening, especially when compared to much of the world where volatility is high. The US dollar is rallying in anticipation of a rate hike before the end of the year. According to the CME Group’s FedWatch tool, the markets are pricing in a probability of about 50% that the Federal Reserve will raise interest rates before year-end.
Given today’s economic climate of low but stabelizing commodity prices; slow global growth with high levels of uncertainty; and a strengthening currency deflating the price of imports, near term inflation will probably not accelerate quickly, if at all. It will have to come from growth in employment. This will stimulate housing prices and increase consumer demand while higher wages will be passed along to consumers in the form of higher prices.


Emily is a Canadian financial blogger with multiple degrees in economics and extensive professional experience as a financial analyst. She was formerly a Ph.D. candidate at the University of Guelph's School of Agricultural Economics. Before that, she received an MA from the University of San Francisco in International Development Economics. She also has a BA in Math with a minor in Economics.
