by Liam Hunt | Mar 12, 2024 | Monthly CPI Updates
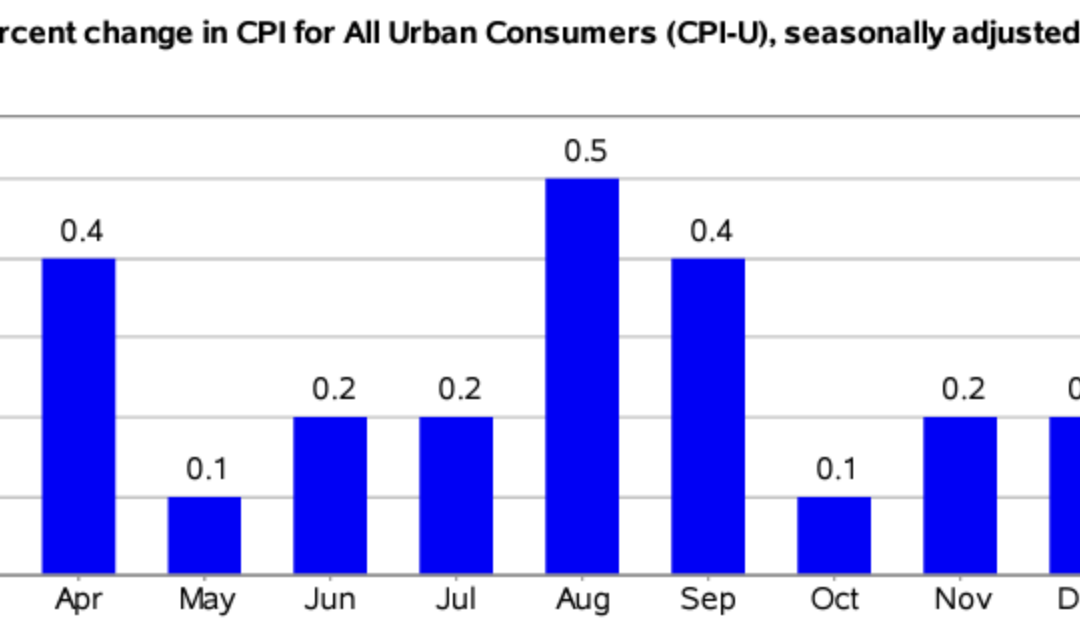
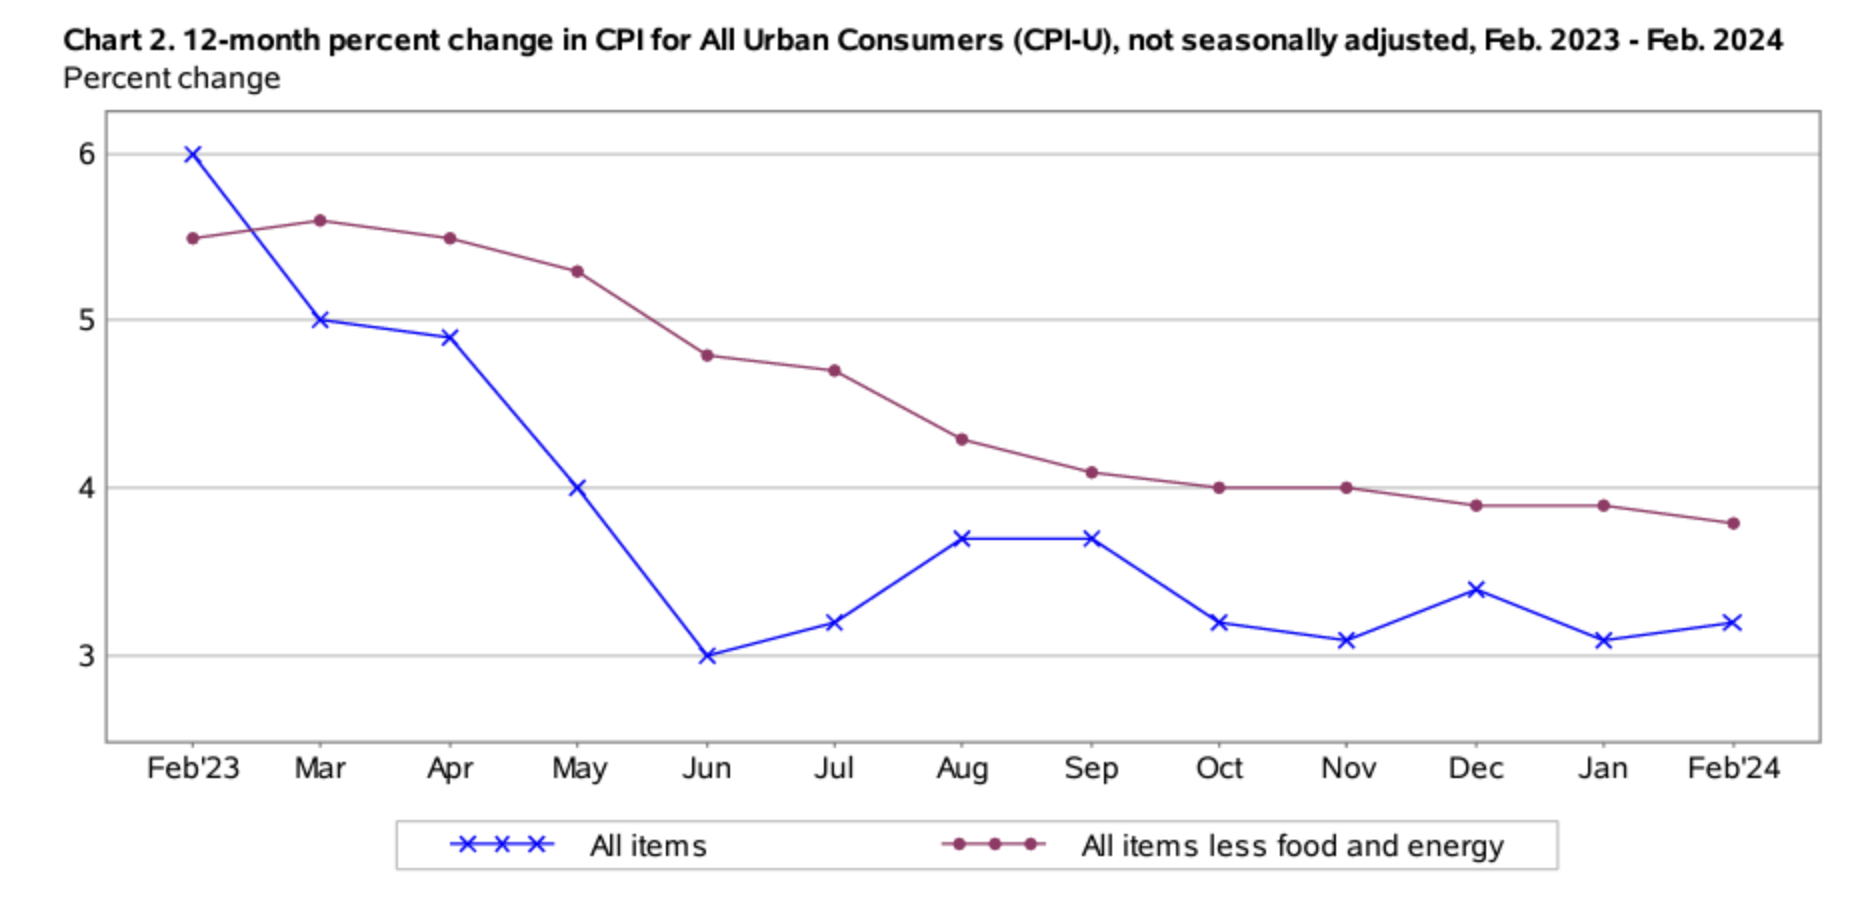
The February 2024 Consumer Price Index of All Urban Consumers (CPI-U) report indicates that inflation rose by 0.4% for the month, exceeding the level of price acceleration seen in January (+0.3%) as well as December 2023 (+0.3%). These data were released at 8:30 am EST on Tuesday, March 12, 2024, by the Bureau of Labor Statistics. Before seasonal adjustment, the year-over-year (Y-o-Y) inflation rate in the all-items index grew by 3.2%, marking a small yet notable acceleration from January’s 3.1% CPI reading, yet declining from December’s hotter 3.4% reading.
According to the Financial Times, this month’s CPI increase was unexpected by economists—data that will surely be scrutinized by the U.S. Federal Reserve during their upcoming FOMC meeting. Heading into Tuesday, the consensus among analysts and market watchers was that inflation would likely remain the same on a Y-o-Y level at 3.1%. After today’s news, it stands to reason that the Federal Reserve may delay their expected interest rate cuts further into 2024 than expected.
Today, the Federal Reserve’s federal funds rate sits at 5.25 to 5.5%, a 22-year high, and borrowers and investors alike have been waiting with anticipation for nearly a year for inflation to come under control. January’s inflation report may have dashed any hopes for interest rate relief before Q3 2024.
Global markets, however, responded positively to this month’s inflation report. At the time of writing, European markets (represented by the Stoxx 600 index) traded 0.5% higher on Tuesday morning, with financial services and travel stocks leading the charge. As of mid-day Tuesday, the Dow Jones Industrial Average (+214 points) and the S&P 500 (+45.56) were both trading in the green.
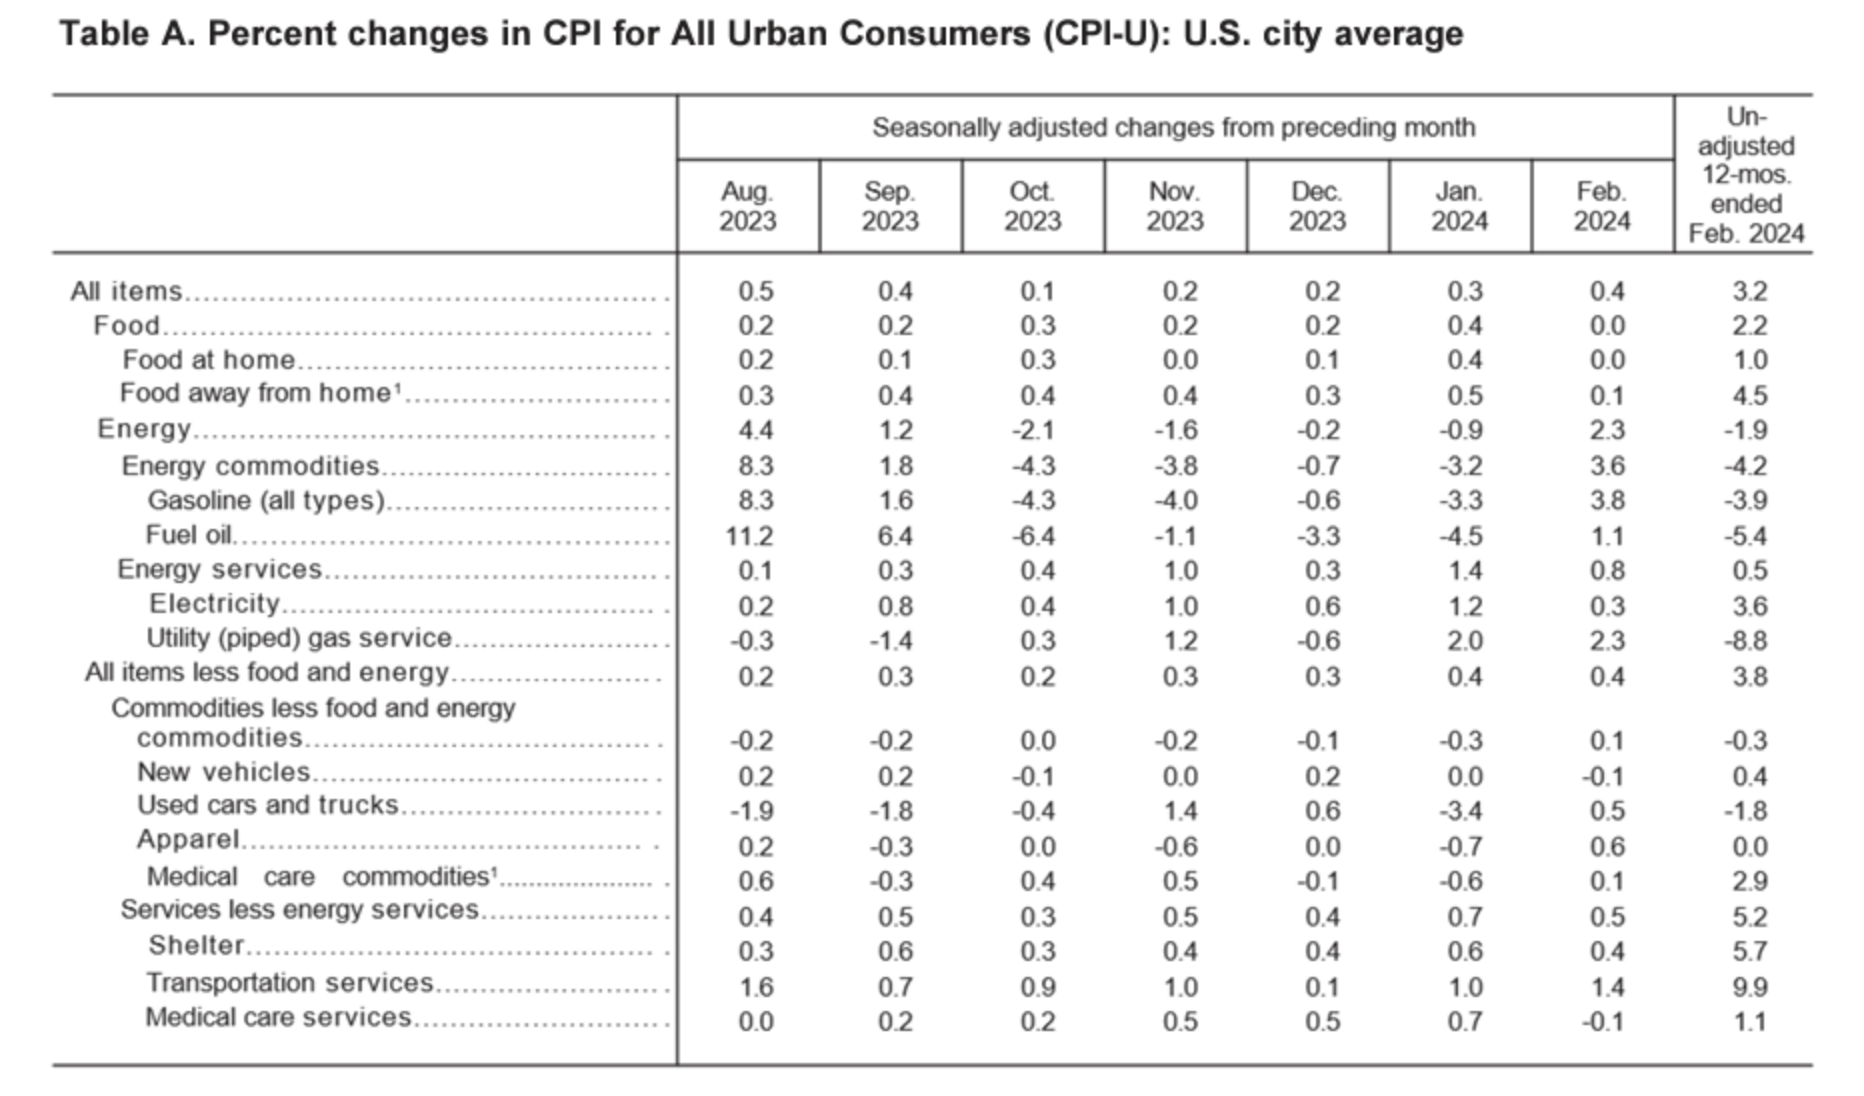
Driving inflation this month was a high shelter index and rising gasoline prices. Together, these two price categories contributed to over +60% of this month’s price acceleration. Regarding “core” inflation (e.g., all items less food and energy), the index rose +0.4%, the same rate at which it accelerated in the previous month. These data indicate that fighting “last mile” inflation may be much more difficult than market watchers would have expected.
Source: Bureau of Labor Statistics
Food Prices
The food index remained unchanged in February, as did the food at home index, both of which matched the level of acceleration seen in January (+0.4%) on a month-over-month basis. Notably, three of the six primary grocery indices decelerated in February, including the following:
- Dairy and related products: (-0.6%)
- Cheese and related products (-1.1%)
- Fruits and vegetables (-0.2%)
- Nonalcoholic beverages index (-0.2%)
On the other hand, price acceleration was seen in various price categories, including the index for full-service meals (+0.1%), food at home (+2.3% Y-o-Y), food away from home (+4.5% Y-o-Y), and cereals and bakery items (+1.7% Y-o-Y).
Energy Prices
Regarding energy prices, the energy index rose +2.3% in February, marking a major increase over January’s +0.9% rise. The price acceleration in this category was driven largely by higher gasoline prices, which increased +3.8% in February. The natural gas index rose +2.3% on the month while electricity prices rose +0.3%. Meanwhile, the fuel oil index rose +1.1%.
Core February 2024 CPI
The core CPI data for February 2024 the index rose +0.4% month-over-month, accelerating by the same margin as it did in January. On a Y-o-Y basis, the core CPI index rose +3.8%. Below is an itemized breakdown of the main price fluctuations seen in January’s core CPI reading:
- Shelter index: (+0.4%) [January: +0.6%]
- Rent index: (+0.5%) [January +0.4%]
- Owners’ equivalent rent: (+0.4%)
- Motor vehicle insurance: (+0.9%) [January: +1.4%]
- Medical care index: (+0.5%) [January: +0.5%]
- Airline fares: (+3.6%) [January: +1.4%]
- Hospital services: (-0.6%)
- Physician services: (-0.2%)

Source: Bureau of Labor Statistics
Seasonally Unadjusted CPI Data for February 2024
Before seasonal adjustments, the CPI-U for February 2024 increased (+3.2%) year-over-year, rising to an index level of 310.326. Since these figures are unadjusted, they include regular seasonal price fluctuations that generally occur by the same margins every year.
Source: Bureau of Labor Statistics
Inflation’s Grip Tightens: Gold Glitters Amid Uncertainty
As inflation continues its upward trajectory, reaching 3.2% in February 2024, up slightly from 3.1% in January, the prospect of imminent interest rate cuts by the Federal Reserve dims. Analysts now look toward the summer months, speculating on the potential for monetary policy adjustments, albeit with caution.
The economic strain is palpable across American households. Inflationary pressures have eroded the financial resilience of families, with healthcare expenses notably on the rise. Despite a buoyant job market, the American populace remains encumbered by the inflationary weight, with a significant majority labeling the economic situation as dire.
Amidst this financial turbulence, certain assets shine as beacons of stability. Last week, gold bullion reached an all-time high of $2,160 per troy ounce, solidifying its status as a safe-haven asset while markets are in disarray. Cryptocurrencies like Bitcoin and Ethereum have also seen a resurgence, bolstered by the introduction of eagerly awaited ETFs, with the former also setting a price record earlier this month above $70,000 per token.
Gold and silver, time-honored bulwarks against inflation, may present a golden opportunity for investors to shield their wealth from currency devaluation and safeguard their retirement savings from the eroding power of the dollar.
Thinking about diversifying into precious metals? Talk to your financial advisor about initiating a gold IRA account today, allowing you to invest in this red-hot asset on a tax-advantaged basis. Additionally, our complimentary CPI inflation calculator remains at your disposal, enabling you to assess inflation’s impact on your finances. Remember, seek the guidance of a financial advisor before making any investment decision.
by Liam Hunt | Feb 13, 2024 | Monthly CPI Updates
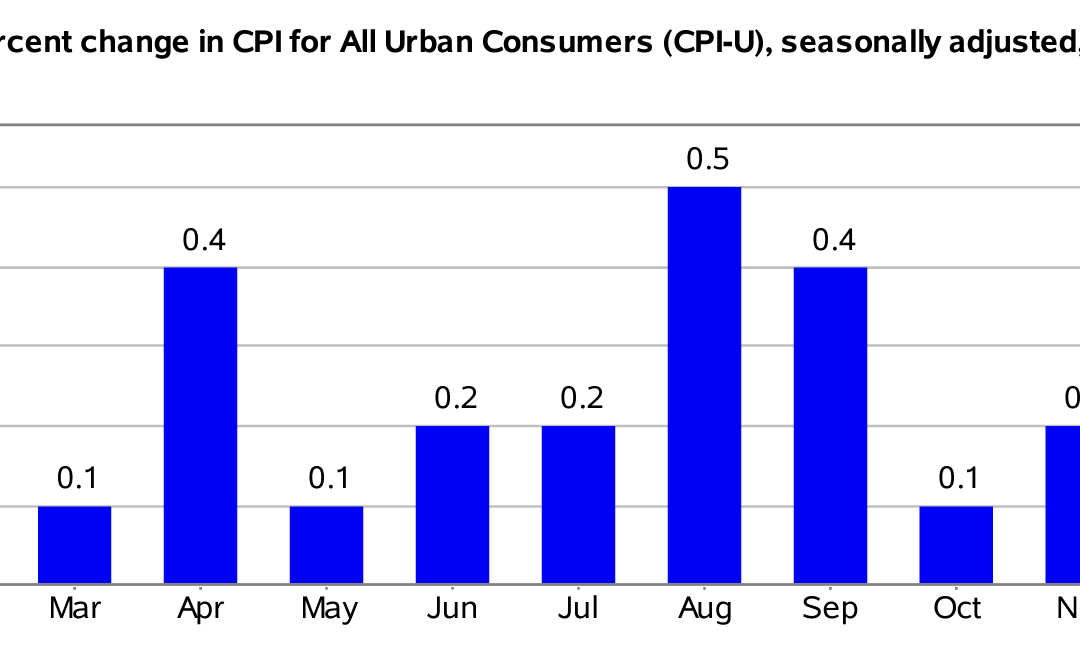
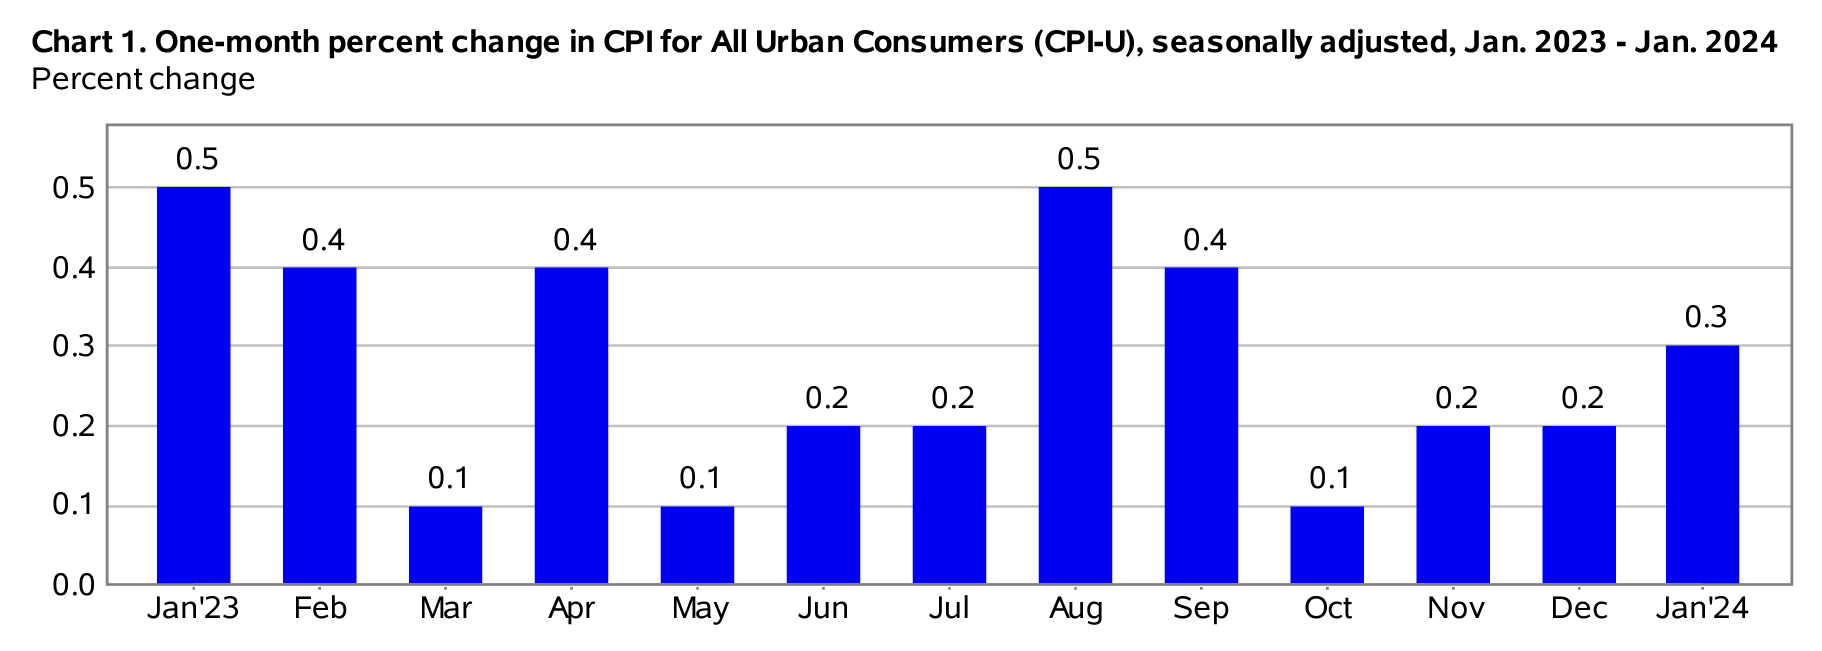
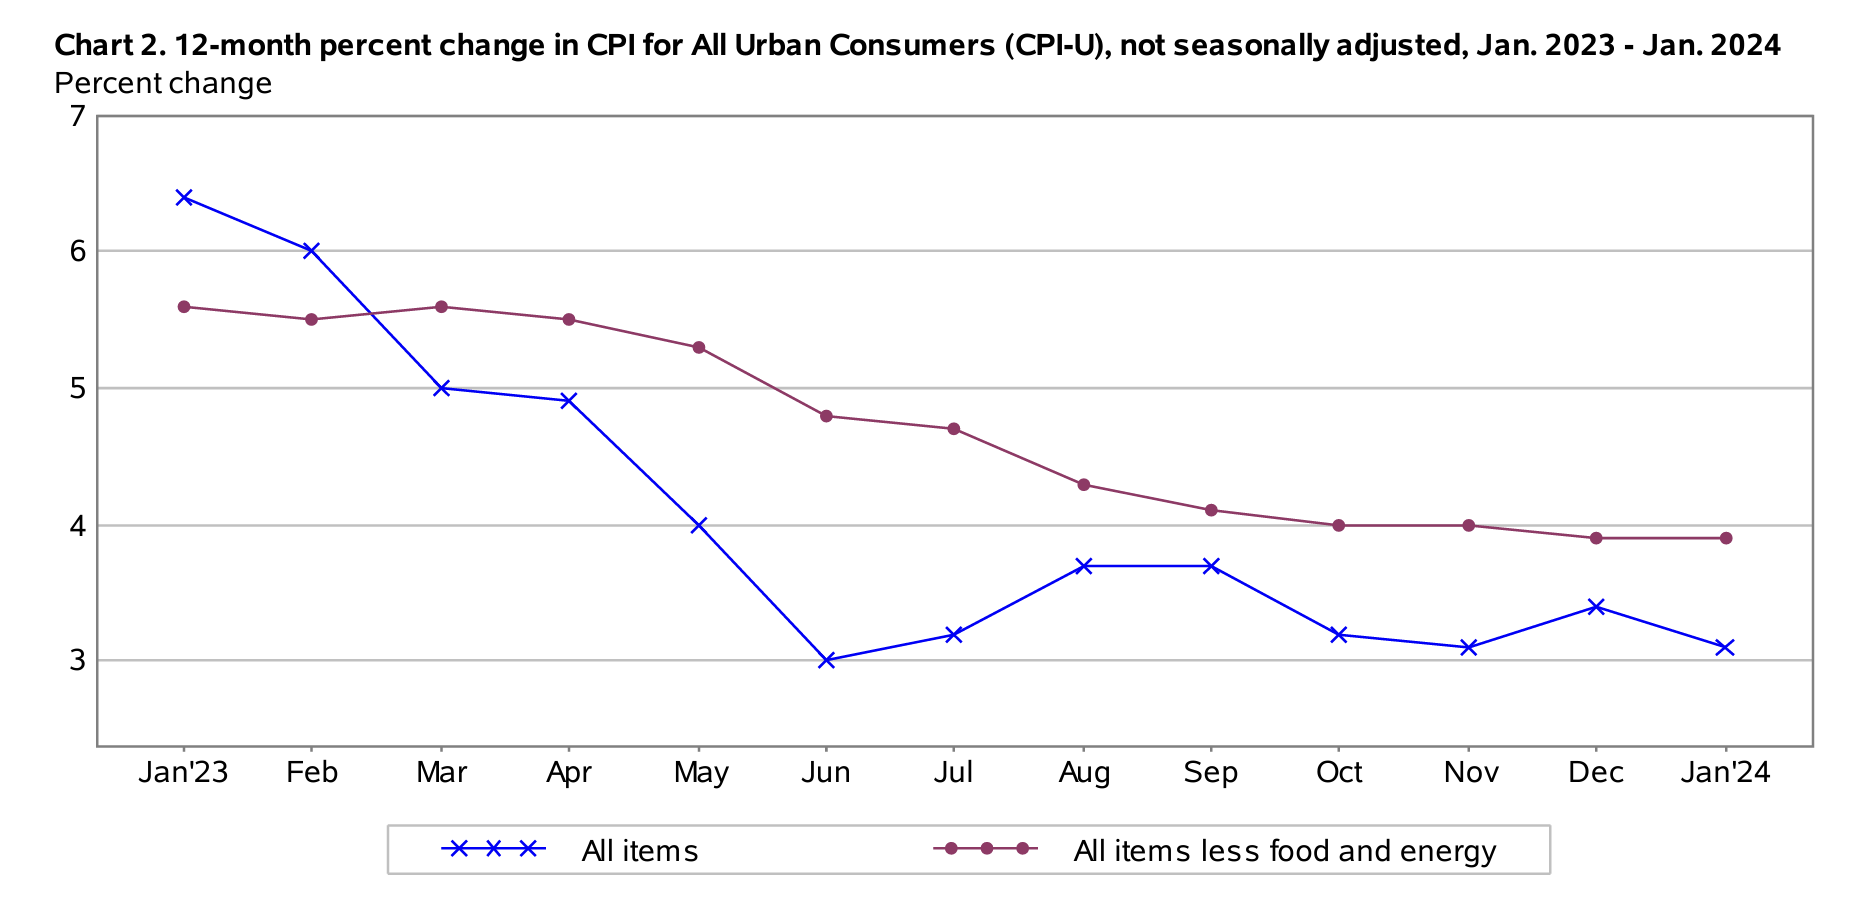
The January 2024 Consumer Price Index of All Urban Consumers (CPI-U) report indicates that inflation rose by 0.3% for the month, matching the same level of price acceleration seen in December and rising sharply from November’s more modest increase (+0.1%). These data were released at 8:30 am EST on Tuesday, February 13, 2024, by the Bureau of Labor Statistics. Before seasonal adjustment, the year-over-year (Y-o-Y) inflation rate in the all-items index grew by 3.1%, marking a notable deceleration from December’s 3.4% CPI reading.
This month’s CPI read came in hotter than expected. According to Barron’s, the economic consensus in advance of Tuesday’s CPI report forecasted a Y-o-Y price growth of 2.9%. Now that we have seen two consecutive months exceed forecasted inflation, market watchers are right to question whether this will delay any interest rate cuts by Q2 2024. With today’s news, any potential rate cuts are likely to be delayed given that last month’s inflation spike appears not to be an anomaly.
The current Fed interest rate sits at 5.5%, a 22-year high, and borrowers and investors alike are hotly anticipating interest rate relief as inflation comes under control. However, this month’s CPI report suggests that relief may be further away than originally thought.
Reactions were universally negative in the stock market in response to today’s inflation news. As of noon EST, the Dow Jones Industrial Average was down more than 400 points. European markets also closed in the red.
This month’s inflation rise was fueled in large part by rising food and housing prices, as has been the case over the previous two months. Food and energy costs tend to be volatile relative to other consumer goods. Excluding these items from the CPI, core prices rose only 0.4% month-over-month, up from December’s 0.3% increase.
Unlike last month, core CPI prices rose in January, casting even greater doubt on whether the Fed’s target inflation rate of 2% is attainable in the foreseeable future. Both headline and core inflation remain higher than both the Fed and everyday Americans would like, suggesting that the “last mile” of fighting inflation will likely be more difficult than anticipated.
Source: Bureau of Labor Statistics
Food Prices
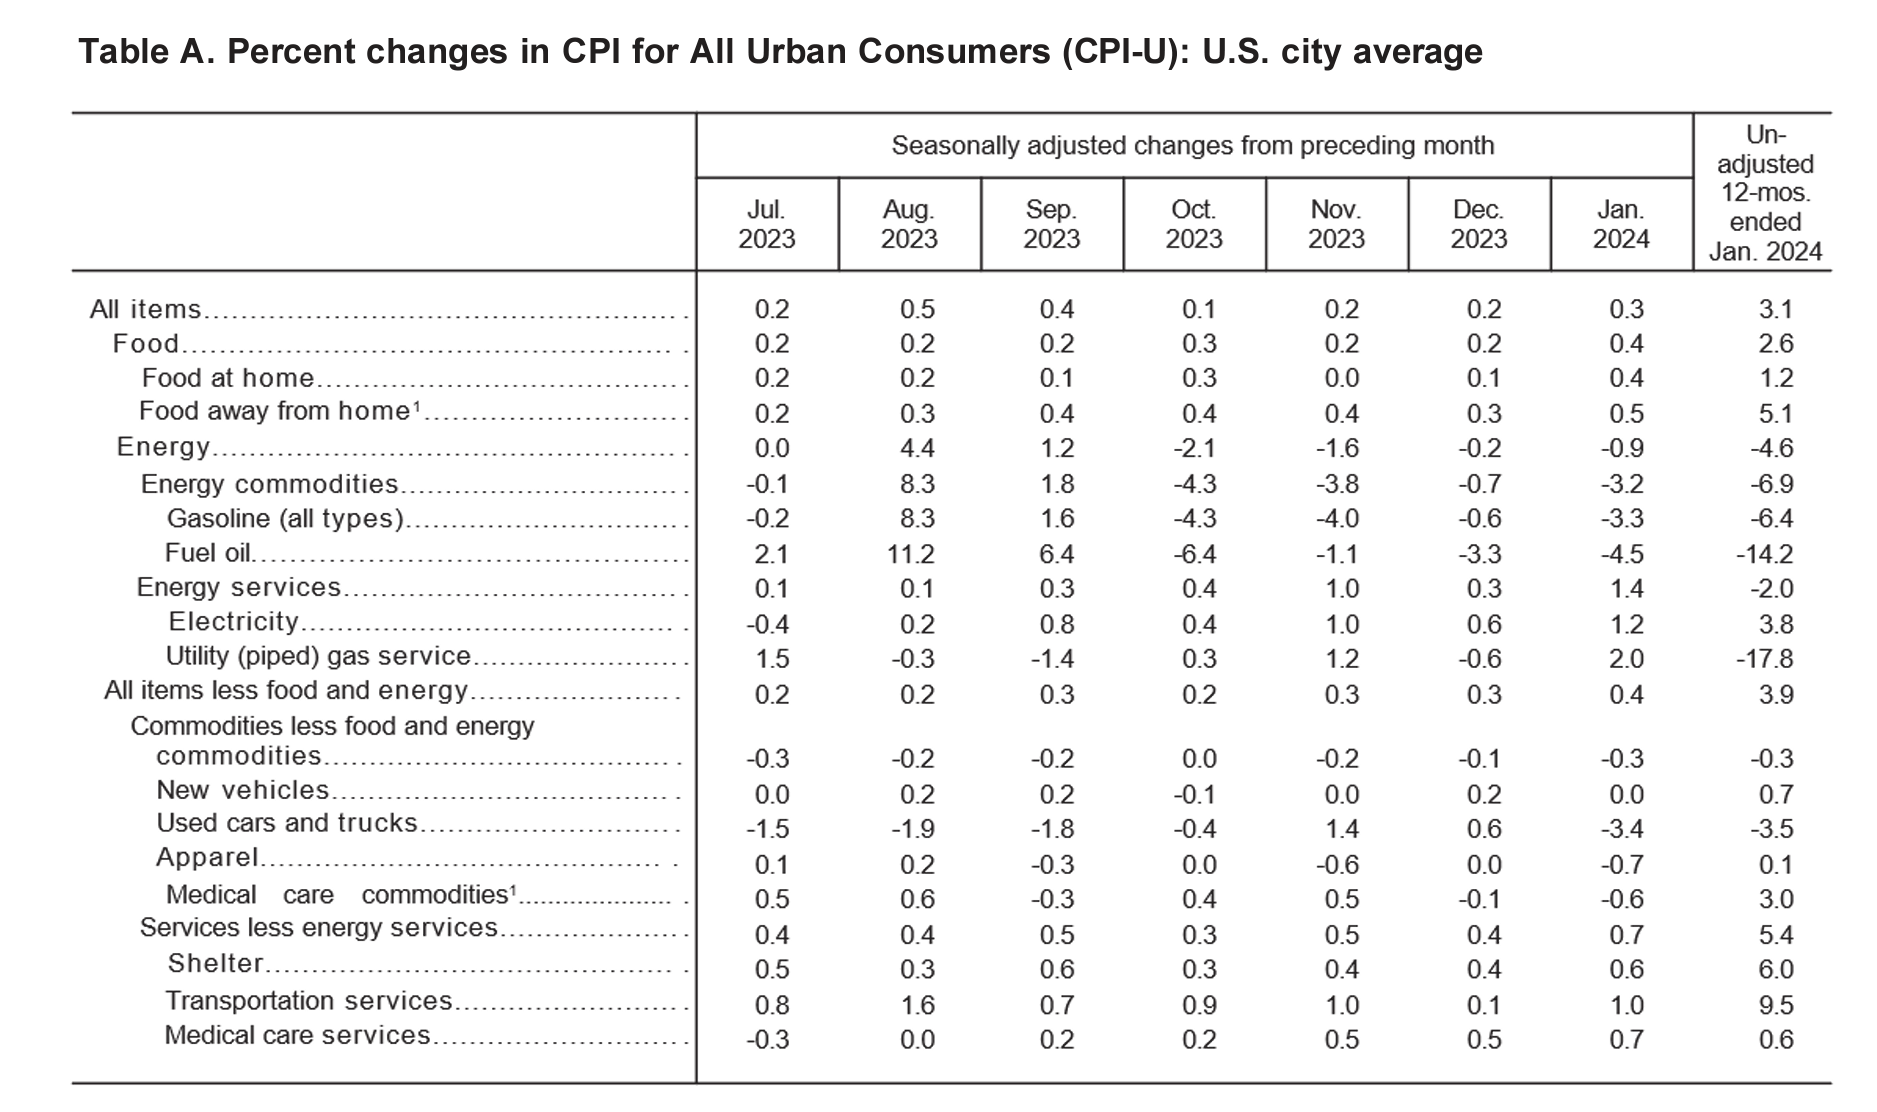
The food index rose by 0.4 percent in December, increasing by twice the margin seen in December (+0.2%). The index for food at home rose by 0.4 percent, also up considerably from December. Food away from home fared worse, up 0.5 percent on the month. Notably, the index for meats, poultry, eggs, and fish was unchanged from December, while nonalcoholic beverages rose by 1.2 percent. On a Y-o-Y basis, the food at home index rose by 1.2 percent, slightly down from December (1.3%), and the food away from home index rose by 5.1 percent on the year.
Energy Prices
Lower energy costs were the main price category that pulled inflation down in December. The energy index fell 0.9 percent in January following a modest acceleration in the previous month, continuing a downtrend seen since October but interrupted last month due to base year effects. The natural gas index plummeted 17.8 percent over the year, and the energy index as a whole fell by 4.6 percent Y-o-Y. Fortunately for consumers, the gasoline index dropped by 6.4 percent Y-o-Y, and the fuel oil index dropped 14.2 percent.
Core January 2024 CPI
Regarding the core CPI data for January 2024 (i.e., inflation less food and energy), the index rose 0.4 percent month-over-month, accelerating over the 0.3 percent margin seen in both December and November. However, the index rose by 3.9 percent on a Y-o-Y basis, matching December’s gain. Below is an itemized breakdown of the main price fluctuations seen in January’s core CPI reading:
- Shelter index: (+0.6%) [December: +0.5%]
- Rent index: (+0.4%) [December: +0.4%]
- Owners’ equivalent rent: (+0.6%)
- Motor vehicle insurance: (+1.4%) [December: +1.5%]
- Medical care index: (+0.5%) [December: +0.6%]
- Used cars and trucks: (-3.4%) [December: +0.5%]
- Apparel: (-0.7%)
- Hospital services: (+1.6%)
Source: Bureau of Labor Statistics
Seasonally Unadjusted CPI Data for January 2024
Before seasonal adjustments, the CPI-U for January 2023 increased (+3.1%) year-over-year, rising to an index level of 308.417. Since these figures are unadjusted, they include regular seasonal price fluctuations that generally occur by the same margins every year.
Source: Bureau of Labor Statistics
While Inflation Holds Strong, So Too Does Gold
While the pundit class decries the difficulties of “last mile” inflation, there is little indication that the Fed’s target rate of 2% is achievable within the first half of 2024. An increasing chorus of economists are now looking to the summer as the most likely time frame for any potential rate cut, if that.
Meanwhile, American households are suffering. High inflation has significantly reduced the purchasing power of American families over the past two years, with rising healthcare costs leading the way. Despite strong job growth, Americans aren’t feeling any relief. The long-lasting effects of inflation have left a lasting mark on everyday consumers, with about 75% of Americans describing the economy as “poor”.
The silver lining is that there are well-performing assets that may provide relief for American investors. In December, the spot price of gold broke its all-time high, hitting $2,135 per ounce before stabilizing around the $2,000 mark. Bitcoin and Ethereum, riding on the launch of widely-anticipated cryptocurrency ETFs, have also rallied in double digits over the past few months and are currently trading at multi-year highs.
Previous recessions and market shocks have shown that gold and silver can outperform traditional securities when financial markets decline. For many investors, gold acts as a reliable hedge against inflation, offering a stable store of value when others are not. Investing in gold and silver can serve as a protective measure for your savings against the devaluation of the U.S. dollar, allowing you to preserve your wealth during times of inflation.
Thinking about diversifying your portfolio with gold or silver? You can take the first step by opening an account with one of the top-rated gold IRA service providers. In the meantime, you can use our complimentary CPI inflation calculator tool to monitor how inflation is impacting your household’s bottom line. As always, consult with a financial advisor before investing in any asset.
by Liam Hunt | Jan 11, 2024 | Monthly CPI Updates
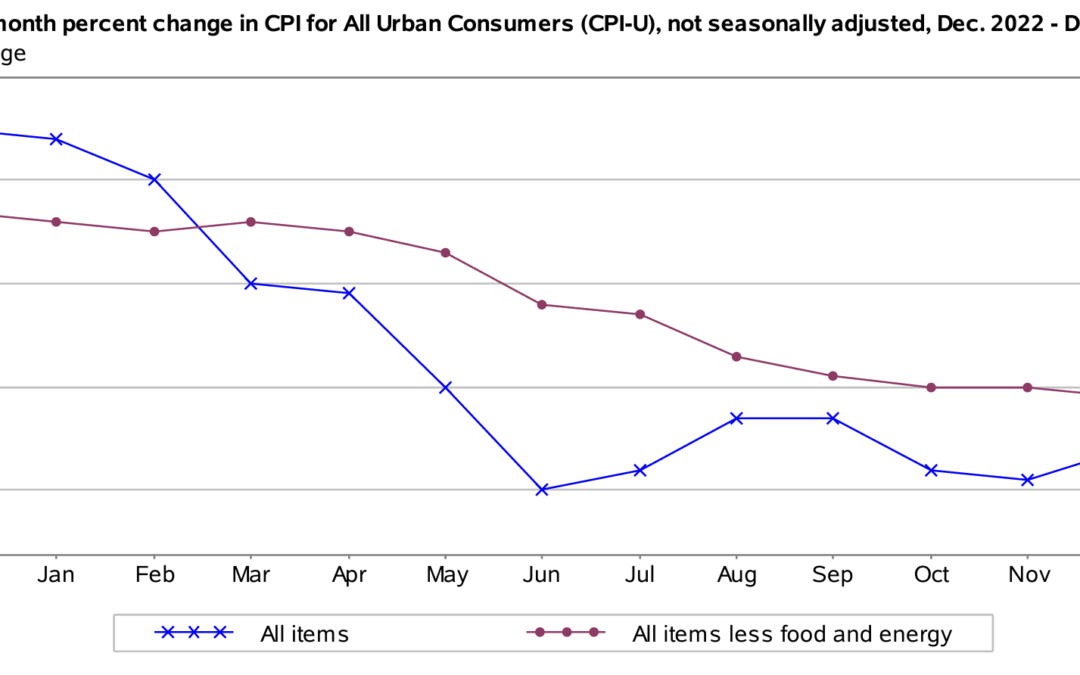
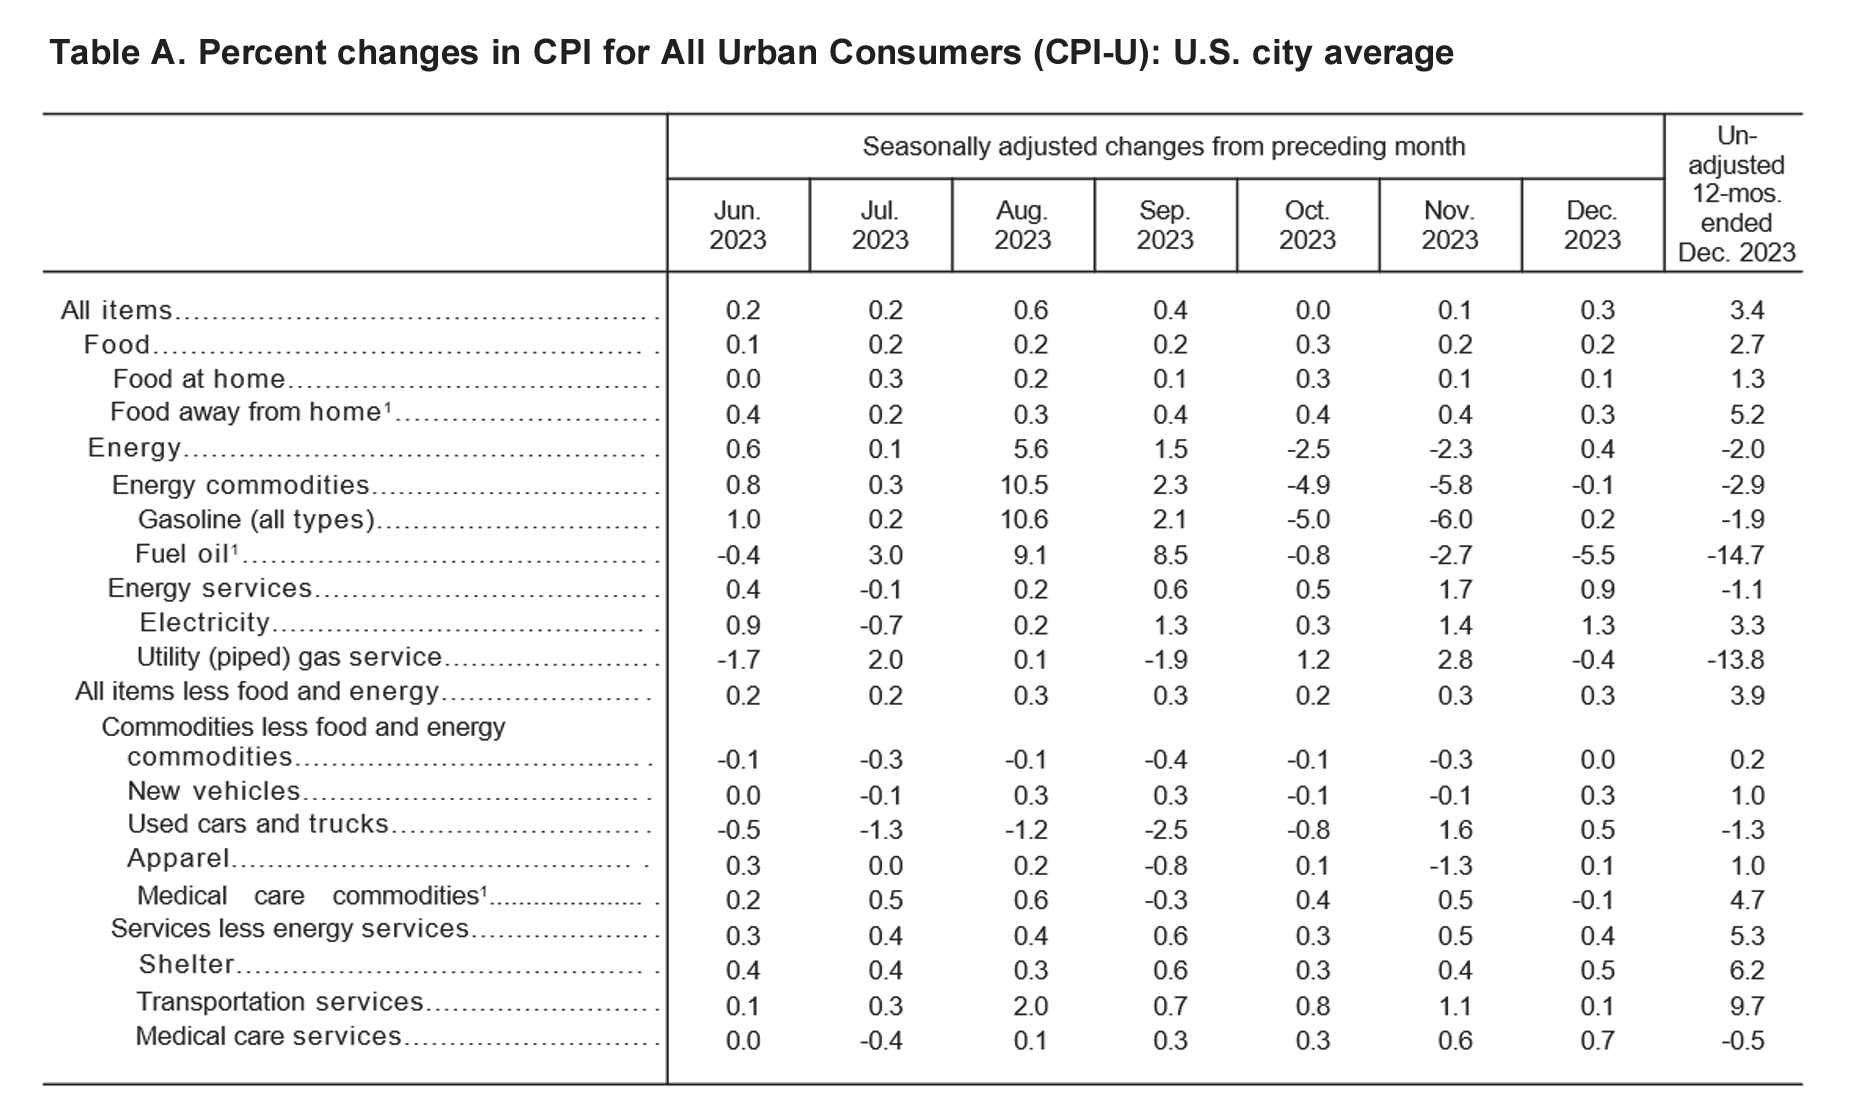
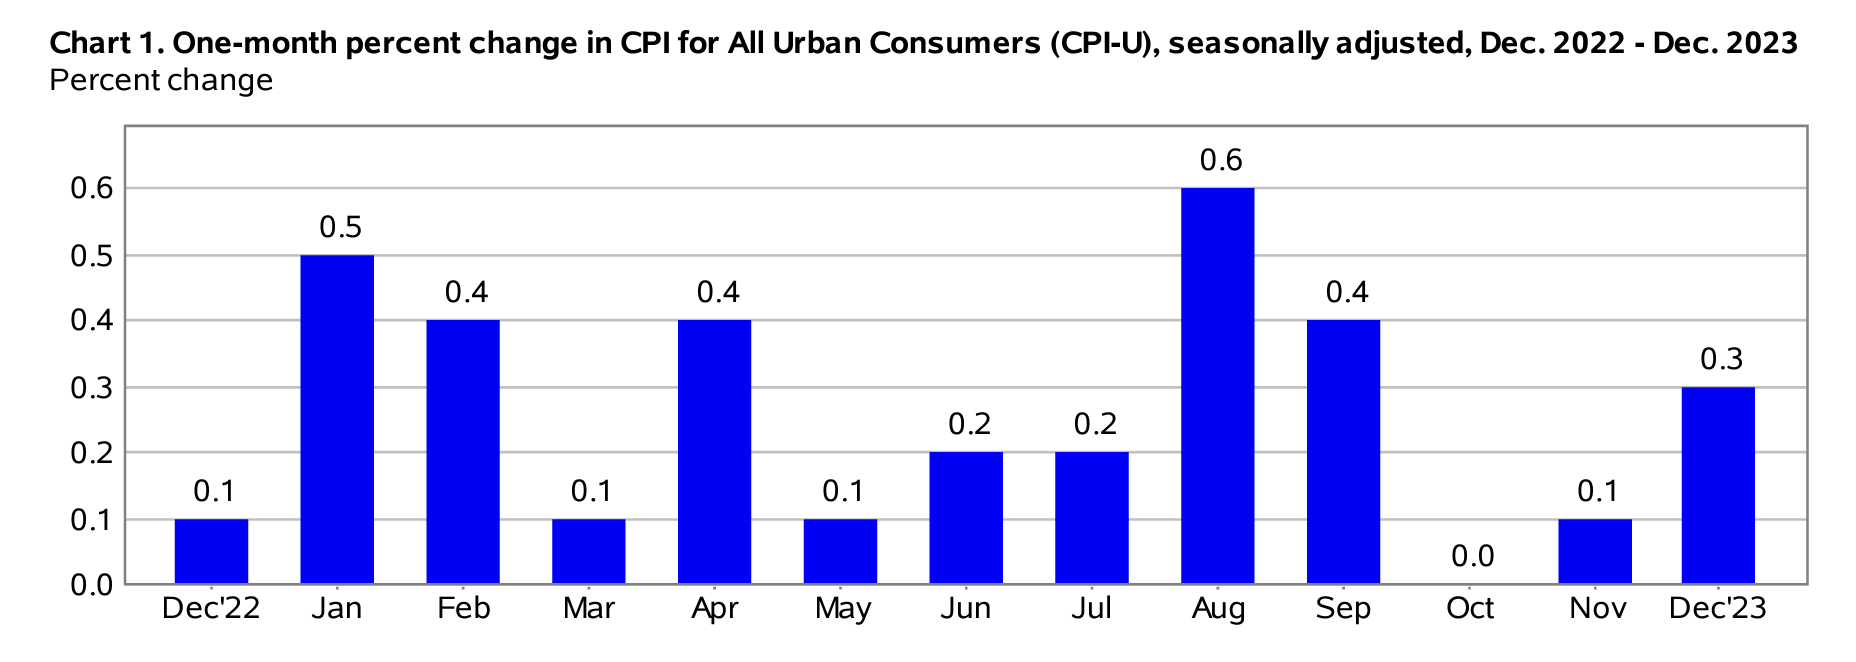
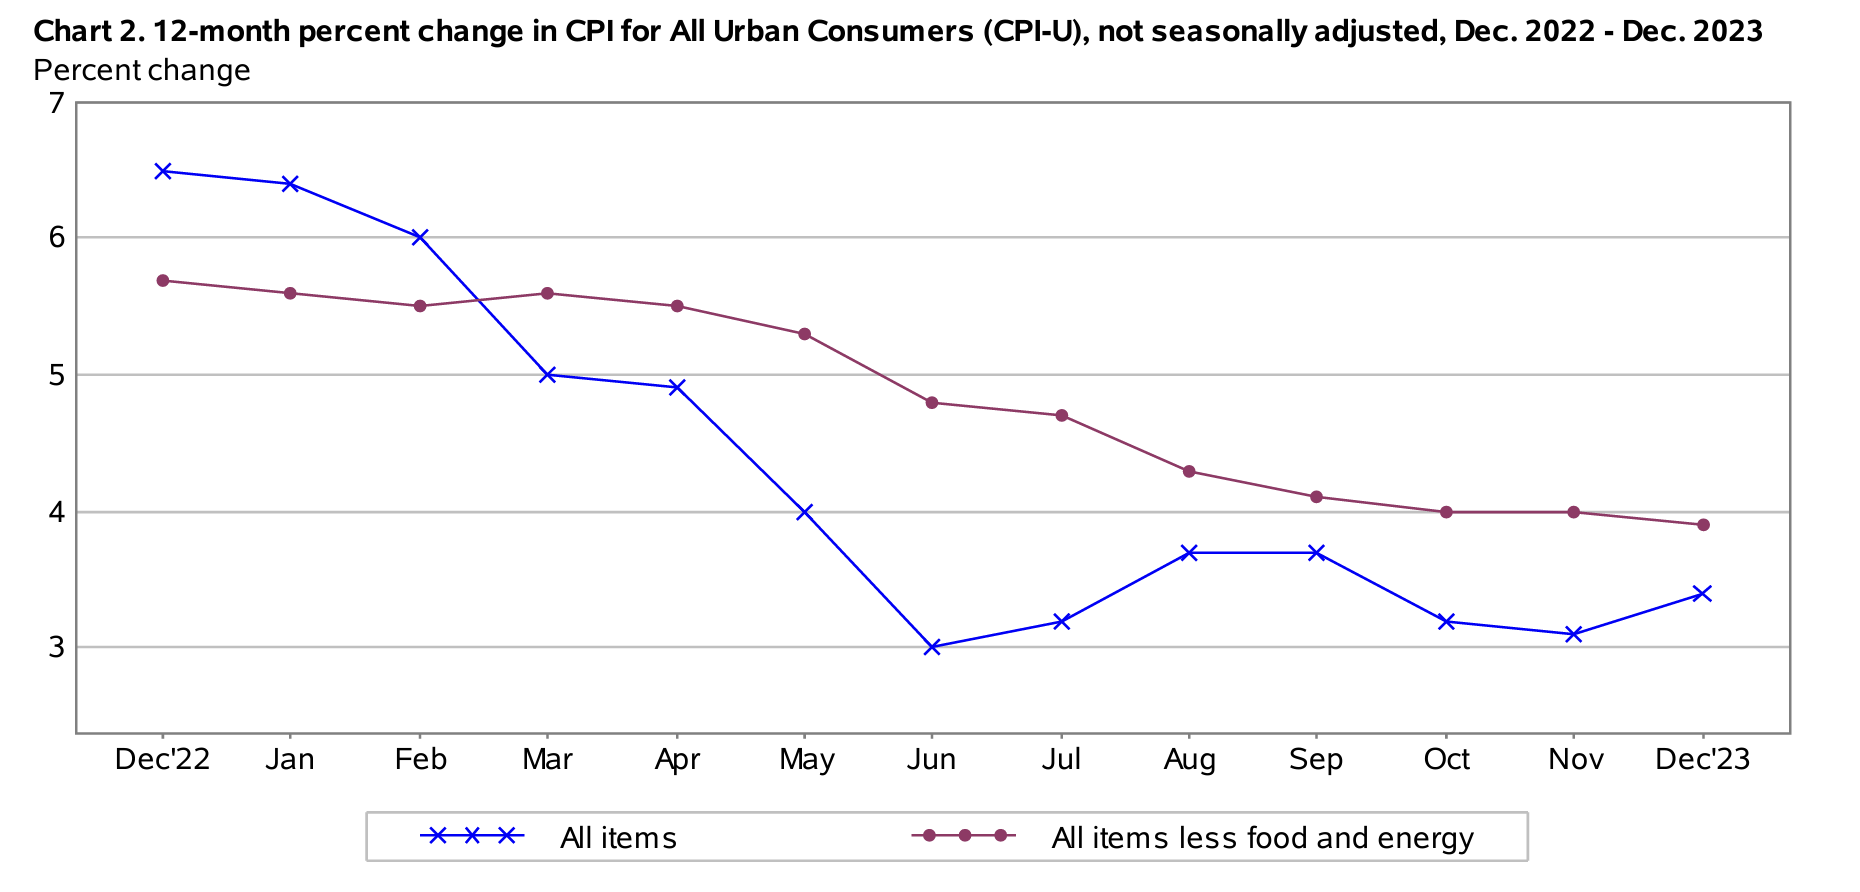
The December 2023 Consumer Price Index of All Urban Consumers (CPI-U) report indicates that inflation rose by 0.3% for the month, following a more moderate rise of 0.1% in November and remaining unchanged in October. These data were released at 8:30 am EST on Thursday, January 11, 2024, by the Bureau of Labor Statistics. Before seasonal adjustment, the year-over-year (Y-o-Y) inflation rate in the all-items index grew by 3.4%, marking a notable acceleration from previous months.
This month’s CPI read exceeded expectations. Economists anticipated a rise of 0.2% month-over-month and a 3.2% Y-o-Y increase. Given December’s hotter-than-expected inflation data, market watchers are right to question whether this will delay the Fed’s dovish pivot slated for later this year. The current Fed interest rate sits at 5.5%, a 22-year high, and borrowers and investors alike are hotly anticipating interest rate relief as inflation comes under control. However, this month’s CPI report suggests that relief may be further away than originally thought.
Reactions were mostly negative in the stock market in response to today’s inflation news. As of 9:45 am EST, the Dow Jones Industrial Average was down 26.49 points.
According to the Associated Press, this month’s inflation rise was fueled in large part by rising food and housing prices. Food and energy costs tend to be volatile relative to other consumer goods. Excluding these items from the CPI, core prices rose only 0.3% month-over-month, unchanged from November’s increase. The upside is that, on a Y-o-Y basis, core prices rose by just 3.9%, which is the softest increase in core consumer prices since May 2021 and a notable decline from the previous month’s 4% Y-o-Y gain.
Despite positive news regarding core CPI prices, this month’s report nonetheless casts doubt on whether the Fed’s target inflation rate of 2% is attainable in the near term. Headline inflation remains considerably higher than both the Fed and everyday consumers would like.
Source: Bureau of Labor Statistics
Food Prices
The food index rose by 0.2 percent in December, increasing at the same rate seen in November. The index for food at home rose by 0.1 percent, which is also consistent with the previous month’s increase. Food away from home fared worse, with a 5.2 percent increase on the year. Notably, the index for meats, poultry, eggs, and fish increased by 0.5 percent due largely to a strong 8.9 percent increase in the egg index. This marks a major acceleration from November’s decrease in the same index by 0.2 percent. On a Y-o-Y basis, the food at home index rose by 1.3 percent, which marks a decline from November’s 1.7 percent acceleration on a 12-month basis.
Energy Prices
Lower energy costs were the main price category that pulled inflation down in December. The energy index rose 0.4 percent in December following a 2.3 percent decrease in the previous month and an even larger 2.5 percent decrease in October. The natural gas index fell by 0.4 percent over the month, coming on the heels of a sizable 2.8 percent increase in November. Similarly, the fuel oil index fell by 5.5 percent in this month’s report. On the year, the natural gas index fell by 13.8 percent, the gasoline index fell by 1.9 percent, and the fuel oil index fell by 14.7 percent. On the other hand, the index for electricity saw a 3.3 percent increase.
Core December 2023 CPI
Regarding the core CPI data for December 2023 (i.e., inflation less food and energy), the index rose 0.3 percent month-over-month, rising by the same margin seen in November. However, the index rose by 3.9 percent on a Y-o-Y basis, down slightly from November’s 4.0 percent decline. Below is an itemized breakdown of the main price fluctuations seen in December’s core CPI reading:
- Shelter index: (+0.5%) [November: +0.4%]
- Rent index: (+0.4%) [November: +0.5%]
- Personal care items: (-0.3%)
- Lodging away from home: (+0.4%)
- Motor vehicle insurance: (+1.5%) [November: +1.0%]
- Medical care index: (+0.6%) [Unchanged from November]
- Used cars and trucks: (+0.5%) [November: +1.6%]
- Household furnishings and operations: (-0.4%) [Unchanged from November]
Source: Bureau of Labor Statistics
Seasonally Unadjusted CPI Data for December 2023
Before seasonal adjustments, the CPI-U for December 2023 increased (+3.4%) year-over-year, rising to an index level of 306.746. Since these figures are unadjusted, they include regular seasonal price fluctuations that generally occur by the same margins every year.
Source: Bureau of Labor Statistics
While Stubborn Inflation Rings in the New Year, Gold Soars
Supply-side constraints, fueled in large part by disruptions and violence in the Red Sea, have stoked inflationary flames. While the pundit class decries the difficulties of “last mile” inflation, there is little indication that the Fed’s target rate of 2% is achievable within H1 2024. An increasing chorus of economists are now looking to the summer as the most likely time frame for any potential rate cut.
In the meantime, American households are suffering. High inflation has significantly reduced the purchasing power of American families over the past two years, with rising healthcare costs leading the way. Despite strong job growth, Americans aren’t feeling any relief. The long-lasting effects of inflation have left a lasting mark on everyday consumers, with about 75% of Americans describing the economy as “poor”.
The truth is that the word “poor” is a gross understatement. Behind the cheery backdrop of high spending and GDP growth is a grimmer reality: Americans have record levels of debt, increasingly unaffordable housing, sky-high borrowing costs, and stagnant wages that aren’t keeping up with the cost of essential goods.
The upside, however, is that there are well-performing assets that may provide relief for American investors. In December, the spot price of gold broke its all-time high, hitting $2,135 per ounce before stabilizing around $2,050. Bitcoin and Ethereum, riding on the launch of widely-anticipated cryptocurrency ETFs, have also rallied in double digits over the past few months.
The recessions of 2008 and 2020 have shown that gold and silver can outperform traditional securities when financial markets are in decline. For many investors, gold acts as a reliable hedge against inflation, offering a stable store of value when others are not. Investing in gold and silver can serve as a protective measure for your savings against the devaluation of the U.S. dollar, allowing you to preserve your wealth during times of inflation.
Considering diversifying your portfolio with gold or silver? You can take the first step by opening an account with one of the top-rated gold IRA service providers. In the meantime, you can use our complimentary CPI inflation calculator tool to monitor how inflation is affecting your household’s finances. Always consult with a financial advisor before making any investment decision.
by Liam Hunt | Dec 12, 2023 | Monthly CPI Updates
There’s much speculation about when or if the Federal Reserve will start cutting interest rates, with many analysts suggesting May 2024 as a potential target timeframe. The key determining factor is whether inflation can come under control before we get there.
Markets reacted positively to today’s inflation news, which suggests that rate cuts may be coming sooner than we think.
Both the NASDAQ 100 Futures and Dow Jones Futures indices were in the green (+0.07%) upon the release of soft inflation data for November. While inflation rates rose slightly month-over-month, this was generally expected among most market watchers.
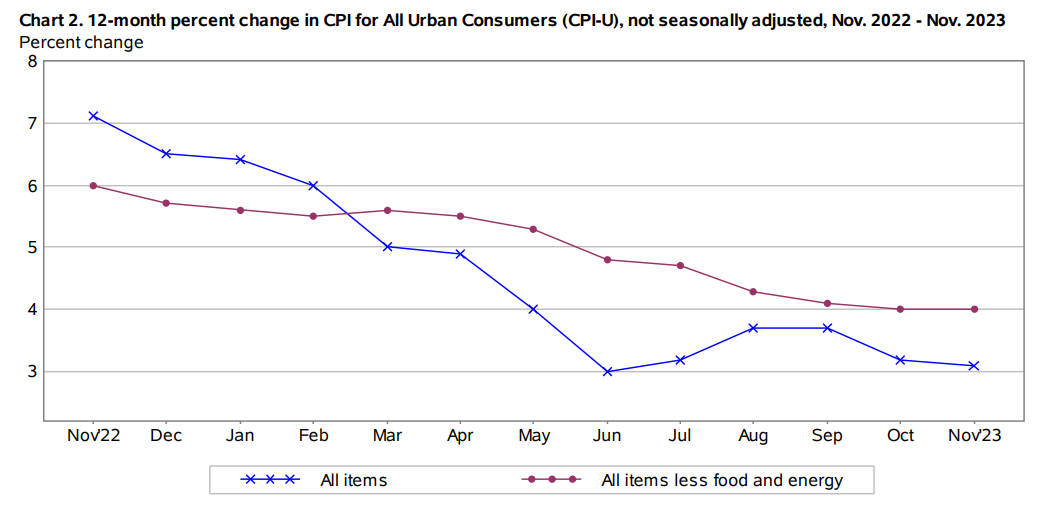
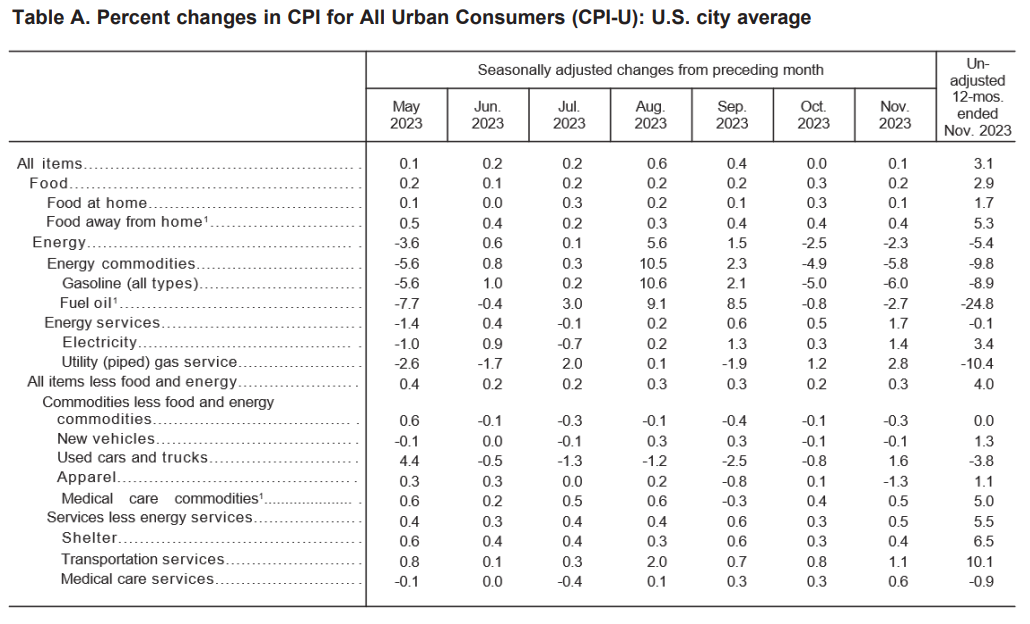
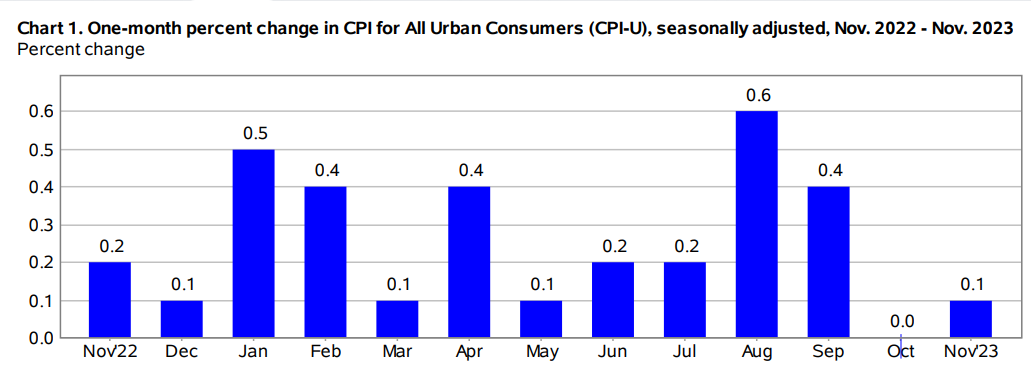
The November 2023 report of the Consumer Price Index of All Urban Consumers (CPI-U) indicates that inflation rose by 0.1%, following an unchanged month in October and a 0.4% increase in September. These data were released at 8:30 am EST on Tuesday, December 12, by the Bureau of Labor Statistics. Before seasonal adjustment, the year-over-year (Y-o-Y) inflation rate in the all-items index grew by 3.1%, marking a slight deceleration from October 2023’s CPI report.
According to a CNBC report, prices edged higher across the board in November, although within the expected range (3.0-3.2%) that most analysts forecasted. Now, all eyes are pointed at Chairman Powell’s Federal Open Market Committee (FOMC) meeting later this week, where he could divulge more information about Americans might see some interest rate relief.
Keeping inflation in check were energy prices, which fell by 2.3 percent in November with gasoline dipping by 6 percent. At the same time, shelter prices were the main drivers of inflation, up 6.5 percent on a 12-month basis. Core CPI also increased by 0.3 percent, an increase from 0.0 during the month prior. On the whole, the November 2023 CPI report was warmly received by most investors and market watchers, as it may be a sign of dovish interest rate policies to come from the Fed.
Source: Bureau of Labor Statistics
November’s monthly CPI figure marks an acceleration from October’s (0.0%) month-over-month figure, yet a sharp deceleration from September’s (0.4%).
Food Prices
The food index rose by 0.2 percent in November, a decrease from 0.3 percent during the previous month. Four of the six principal categories in the grocery store food group index rose in price in November, including strong 0.5 percent rises in the nonalcoholic beverages and cereals and bakery items indices. On the other hand, meats, poultry, eggs, and fish decreased in price by 0.2 percent. Across the board, the food at home index increased by 1.7 percent on a 12-month basis.
Energy Prices
Thanks to gasoline prices at an 11-month low, the energy index fared well in November 2023. The index dropped by 2.3 percent following an even larger 2.5 percent decrease in October. As stated, gas prices led the charge with an excellent 6.0 percent price decline (a decline of 7.3 percent before seasonal adjustments). On an annual basis, the energy index fell by 5.4 percent with mixed components, with the electricity index rising by 3.4 percent while the fuel oil index dropped by 24.8 percent.
Core November 2023 CPI
Regarding the core CPI data for November 2023 (i.e., inflation less food and energy), the index rose 0.3 percent month-over-month and 4.0 percent year-over-year, after rising by a narrow margin (0.2%) in October. Below is an itemized breakdown of the main price fluctuations seen in November’s core CPI reading:
- Shelter index: +6.5%
- Rent index: +0.5%
- Personal care items: +5.2%
- Lodging away from home: (-0.9%) (October: [-2.5%])
- Motor vehicle insurance: +1.0% (October: +1.9%)
- Medical care index: +0.6% (October: +0.3%)
- Used cars and trucks: +1.6% (October: [-0.8%])
- Index for apparel: (-1.3%) (October: +0.1%)
Source: Bureau of Labor Statistics
Seasonally Unadjusted CPI Data for November 2023
Before seasonal adjustments, the CPI-U for November 2023 increased (+3.1%) year-over-year, rising to an index level of 307.051. Since these figures are unadjusted, they include regular seasonal price fluctuations that generally occur by the same margins every year.
Source: Bureau of Labor Statistics
Don’t Get Gaslit This Holiday Season
For some strange reason, the economic powers-that-be are intent on letting you know that the economy is in great shape.
Just last month, a Wall Street Journal headline read: “The Economy is Great – Why Are Americans in Such a Rotten Mood?” While it’s true that high consumer spending has kept America can sliding into a recession, this only tells a small part of the story. Behind the cheery backdrop of high spending and GDP growth is a grimmer reality: Americans have record levels of debt, increasingly unaffordable housing, sky-high borrowing costs, stagnant wages, and rising unemployment rates.
Don’t let the financial media fool you into believing that we’re on solid ground. The reality, unfortunately, is that America’s economic foundations could hardly be shakier.
Economic fundamentals don’t bode well for everyday Americans who, now more than ever, are struggling to make ends meet. The good news, however, is that you have the power to counteract the negative effects of inflation and other bearish macroeconomic indicators. Consider consulting with a financial expert about diversifying your investment portfolio with alternative assets such as gold and silver.
Investing in gold and silver can serve as a protective measure for your savings against the devaluation of the U.S. dollar, allowing you to preserve your wealth during times of inflation.
The historical events of 2008 and 2020 have demonstrated that assets such as gold and silver tend to outperform traditional securities when the financial markets are turbulent. For many investors, gold acts as a reliable hedge against inflation, offering a stable store of value when conventional investments face challenges.
If you’re considering diversifying your portfolio with gold or silver, you can take the first step by opening an account with one of the top-rated gold IRA service providers. In the meantime, you can use our complimentary CPI inflation calculator tool to monitor how inflation is affecting your household during the upcoming holiday season and beyond.
by Liam Hunt | Nov 14, 2023 | Monthly CPI Updates
The Dow Jones Industrial Average spiked 400 points on Tuesday morning upon release of softer-than-expected inflation data for October.
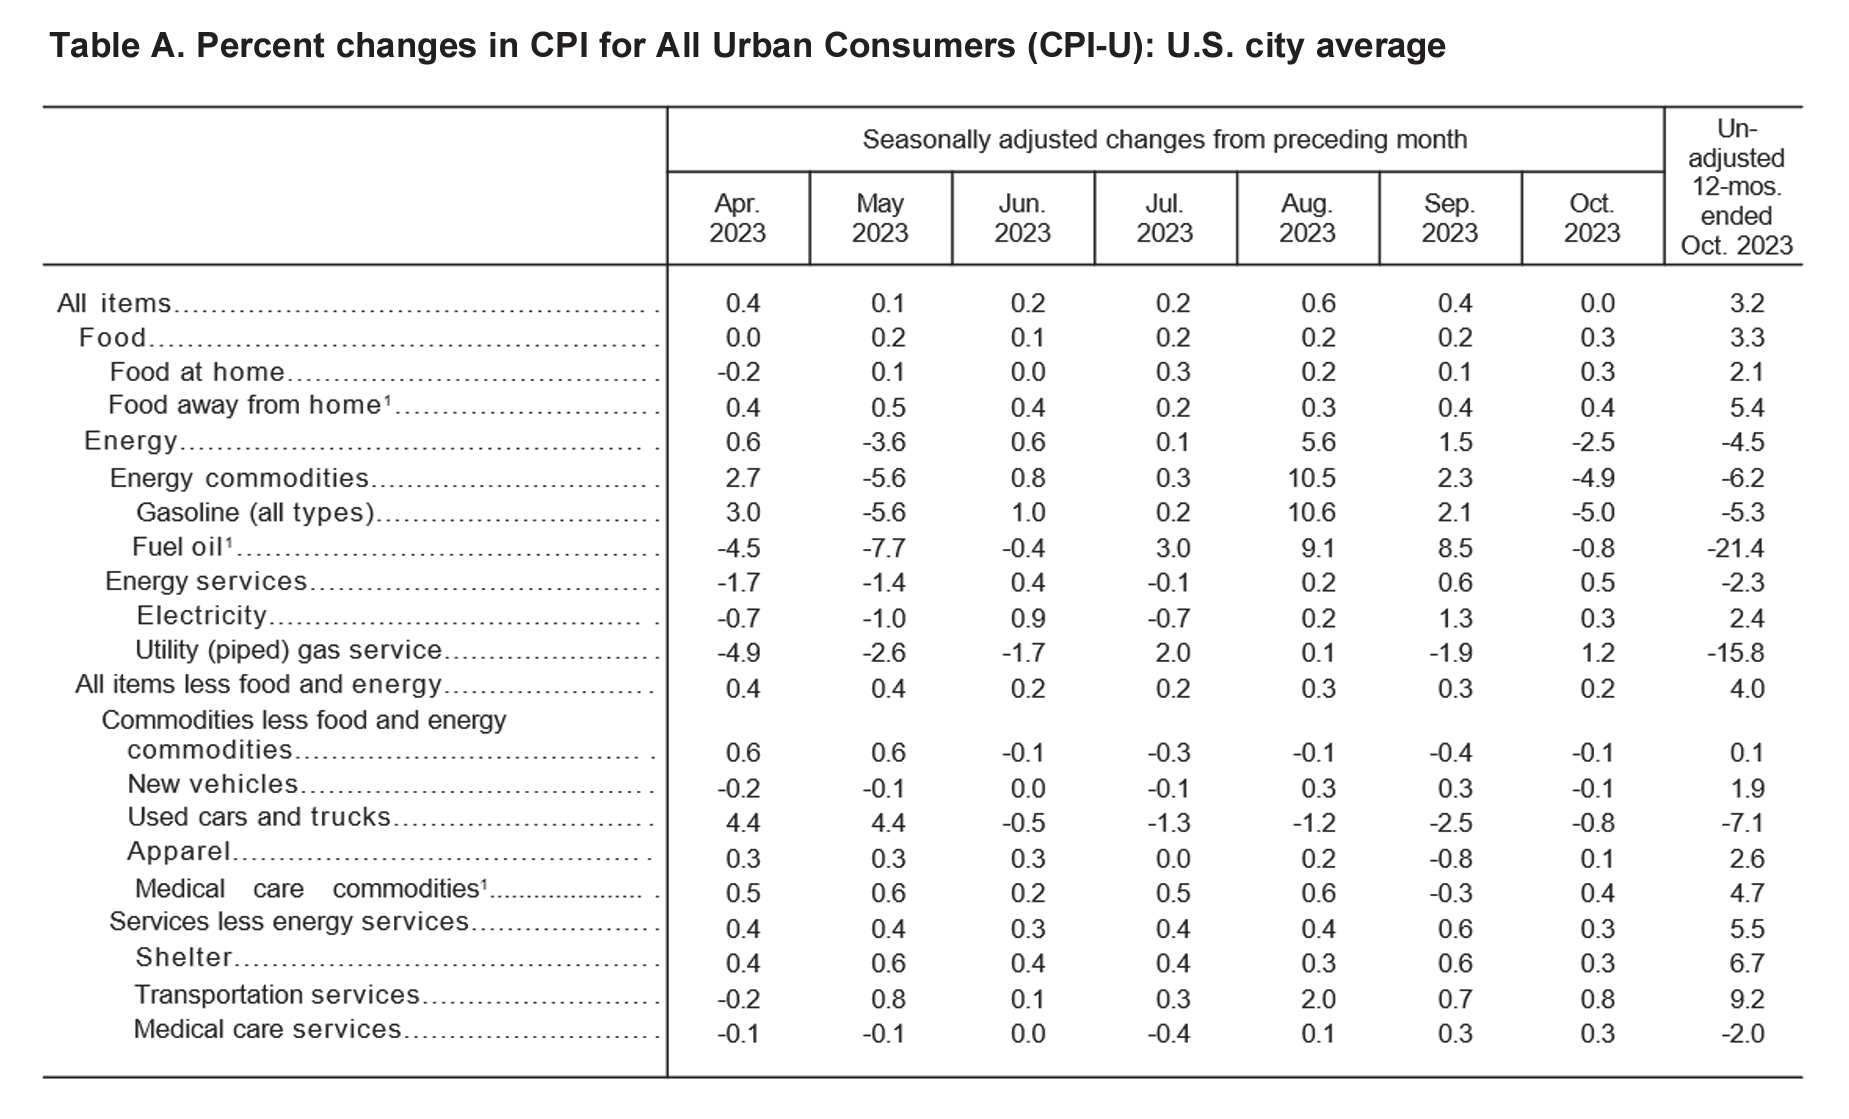
The October 2023 report of the Consumer Price Index of All Urban Consumers (CPI-U) indicates that inflation was unchanged for the month, following a 0.4% monthly increase in September and a 0.6% increase in August. These data were released at 8:30 am EST on Tuesday morning, November 14, by the Bureau of Labor Statistics. Before seasonal adjustment, the year-over-year (Y-o-Y) inflation rate in the all-items index grew by 3.2%, marking a major deceleration from September’s CPI report.
October’s CPI report came in .1 point cooler than anticipated in every category (i.e., monthly unadjusted, year-over-year, core) according to an aggregated forecast report that cited a 3.3% expected year-over-year increase.
Financial markets opened on Thursday morning at a loss following September’s inflation news. The Dow Jones Industrial Average is down 90.55 points as of 11:30 a.m. on Wednesday, and the S&P 500 is down by 4.19 points.
The main driver of this month’s inflation deceleration is the reduction of energy prices in October, which dropped 2.5 percent. Price reductions in the energy sector offset price increases in the food and agriculture sectors. As a whole, the October 2023 CPI report was a pleasant surprise for most investors and market watchers, providing material support in favor of the Fed’s hawkish interest rate campaign. With this month’s positive inflation date, it is all but certain that future rate hikes will not take place in the near term.
Source: Bureau of Labor Statistics
October’s monthly CPI figure marks a sharp deceleration from September’s (0.4%) and August’s (0.6%) and remains the lowest CPI reading on a monthly basis in 2023. As depicted in the table above, the September 2023 CPI figure was largely driven by decreases in energy costs and energy commodities, including fuel oil.
Food Prices
The food index rose by 0.3 percent in October, a marginal increase over September, August, and July, which all saw increases of 0.2 percent. Notably, four of the six food sub-indices rose in October, including the index for meats, poultry, and fish, which rose by 0.7 percent, as well as pork which rose by 1.3 percent. Concurrently, the food at home index rose by 0.3 percent overall.
Energy Prices
Following a 1.5 percent increase in September and an even larger 5.6 percent hike in August, the energy index dropped 2.5 percent in October. The index for electricity rose by only 0.3 percent after a much more significant 1.3 percent increase in September. On the year, the fuel oil index fell by a precipitous 21.4 percent, marking the largest single-month decline in this key index in 2023.
On an annual basis, the energy index fell by 4.5 percent with mixed components, with the electricity index rising by 2.4 percent on a year-over-year basis.
Core October 2023 CPI
Regarding the core CPI data for October 2023 (i.e., inflation less food and energy), the index rose 0.2 percent month-over-month, beating September’s increase (0.3%) and maintaining July and June’s core CPI acceleration of 0.2 percent. Below is an itemized breakdown of the main price fluctuations seen in October’s core CPI reading:
- Rent index: +0.5%
- Lodging away from home: (-2.5%)
- Motor vehicle insurance: +1.9%
- Medical care index: +0.3%
- Used cars and trucks: (-0.8%)
- Recreation +3.2%
- Personal care items: +6.0%
Source: Bureau of Labor Statistics
Seasonally Unadjusted CPI Data for October 2023
Before seasonal adjustments, the CPI-U for October 2023 increased (+3.2%) year-over-year, rising to an index level of 307.671. Since these figures are unadjusted, they include regular seasonal price fluctuations that generally occur by the same margins every year.
Source: Bureau of Labor Statistics
Protect Your Wealth This Holiday Season
October’s inflation reading came as a relief to countless investors who have been waiting for a marked slowdown in consumer price increases. Yet there’s no telling when or if inflation will begin to reaccelerate. Over the past 18 months, American families have seen their purchasing power diminish month after month, and the average American worker now has less of their paycheck to devote to monthly expenses. All the while, personal debts have risen fast—in fact, America’s total credit card debt exceeds $1 trillion and student loan repayments are once again mandatory after an over 3-year freeze on interest accumulation.
Fortunately, you have the power to counteract the negative effects of inflation and other worrisome macroeconomic indicators. Consider consulting with a financial expert about diversifying your investment portfolio with alternative assets. Hard investments in gold and silver have the potential to shield your savings from the diminishing value of the U.S. dollar and help you retain your wealth during inflationary environments.
Historical events in 2008 and 2020 have shown that assets like gold and silver have outperformed conventional securities during market turbulence. For many, gold serves as a safeguard against inflation, offering a dependable store of value when traditional assets falter.
Interested in diversifying with gold or silver? Get started by opening an account with one of the top-rated gold IRA service providers. In the meantime, our complimentary CPI inflation calculator tool can help you monitor how inflation is impacting your household over the upcoming holiday season and beyond.
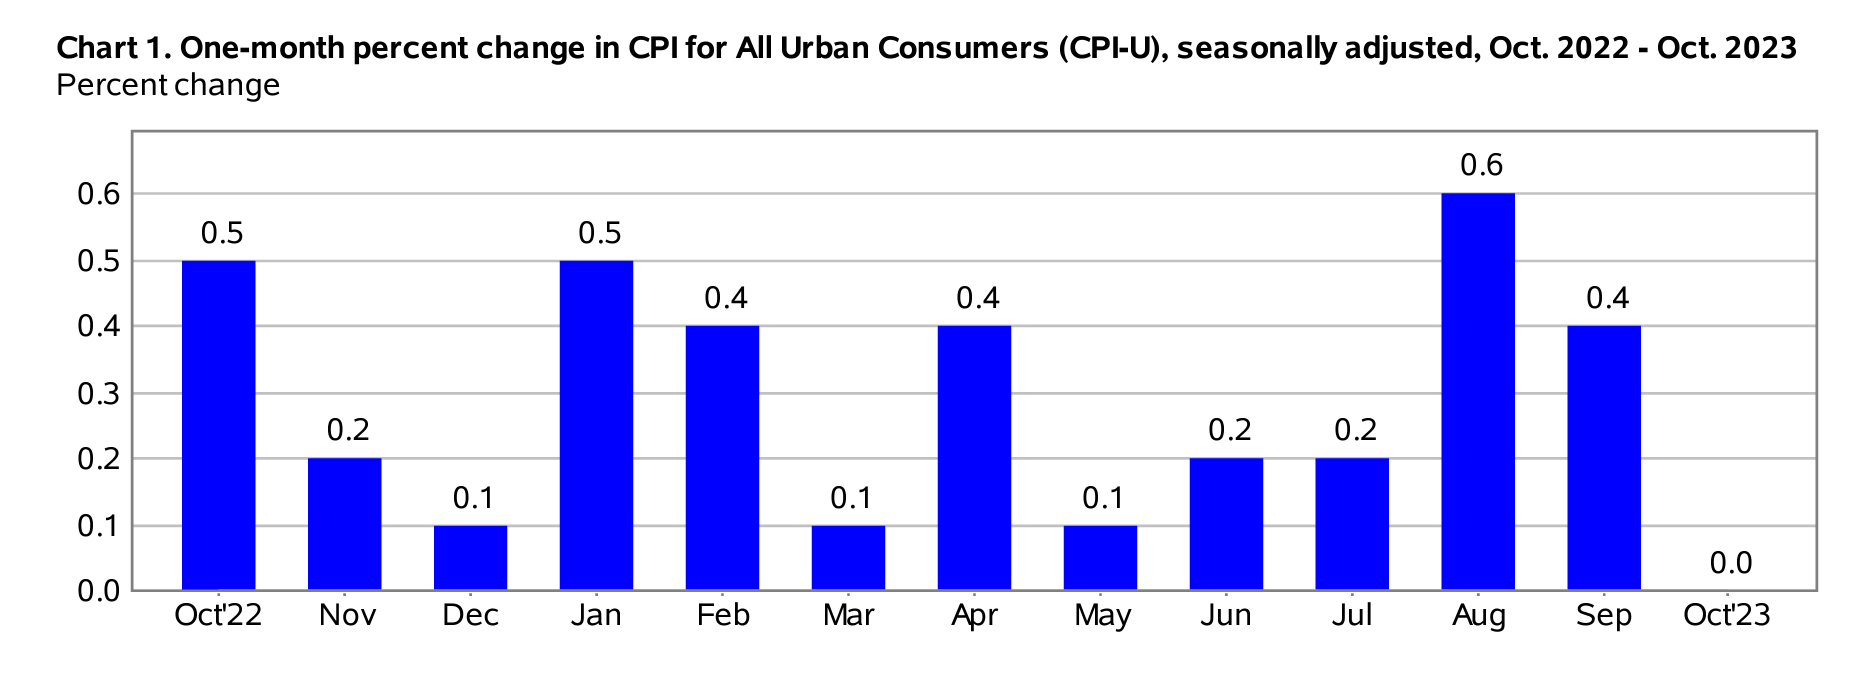
by Liam Hunt | Oct 12, 2023 | Monthly CPI Updates
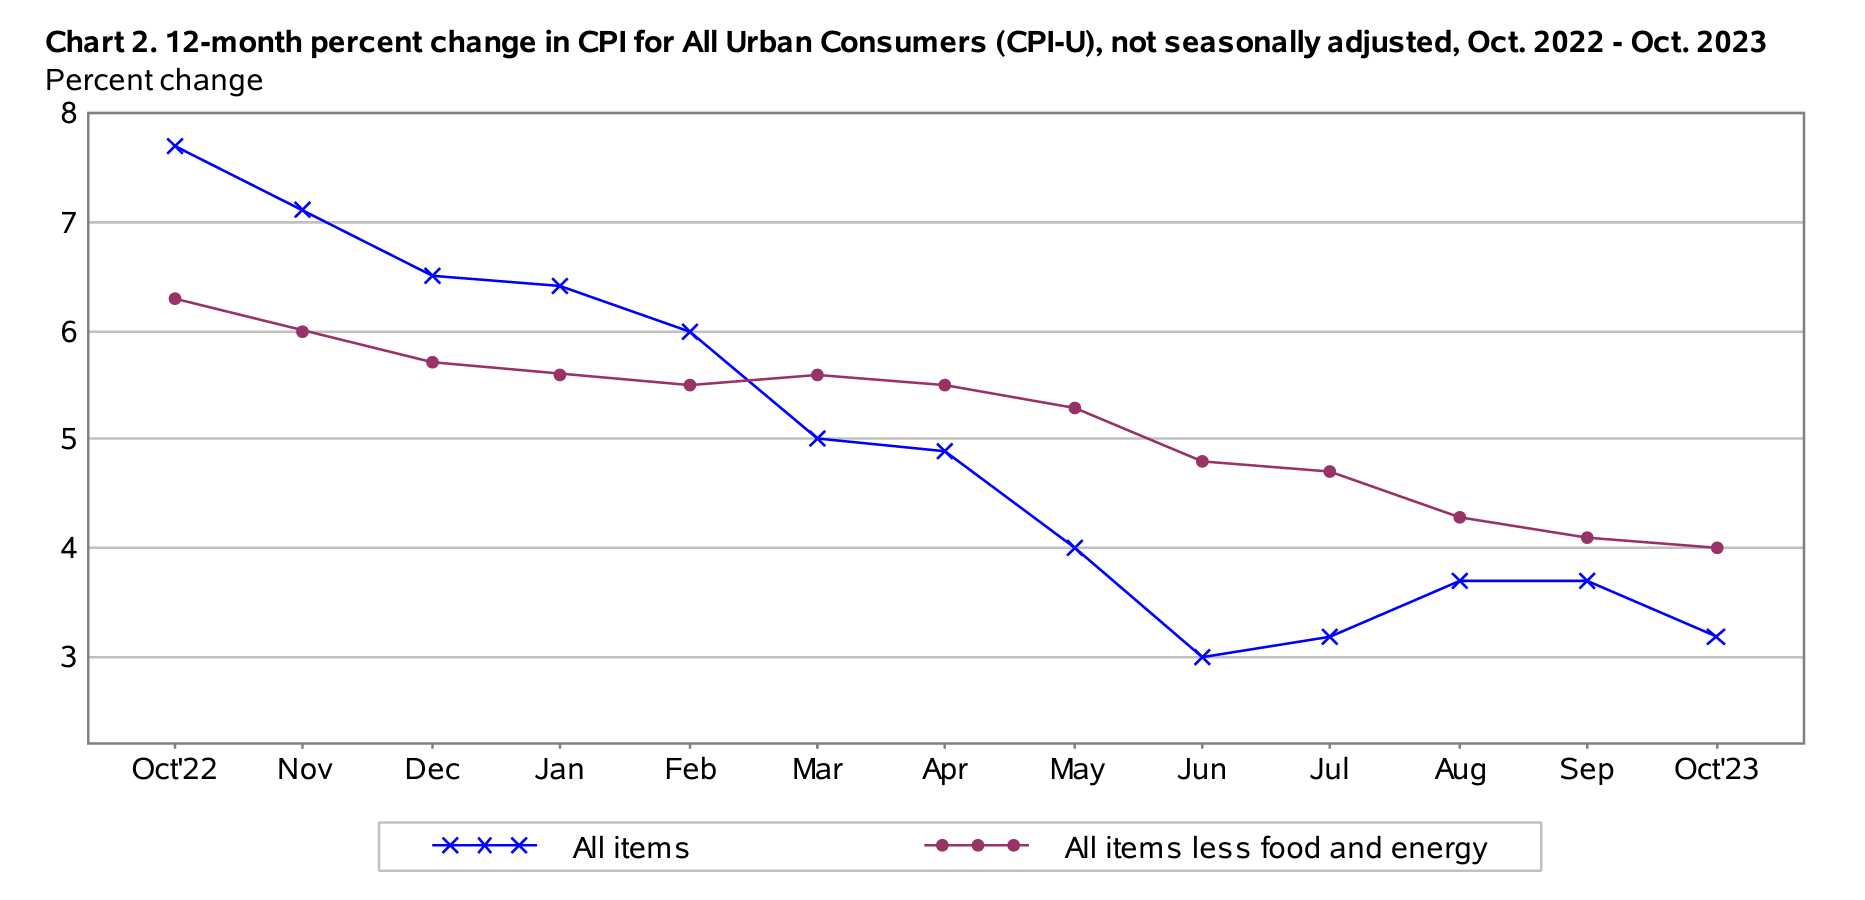
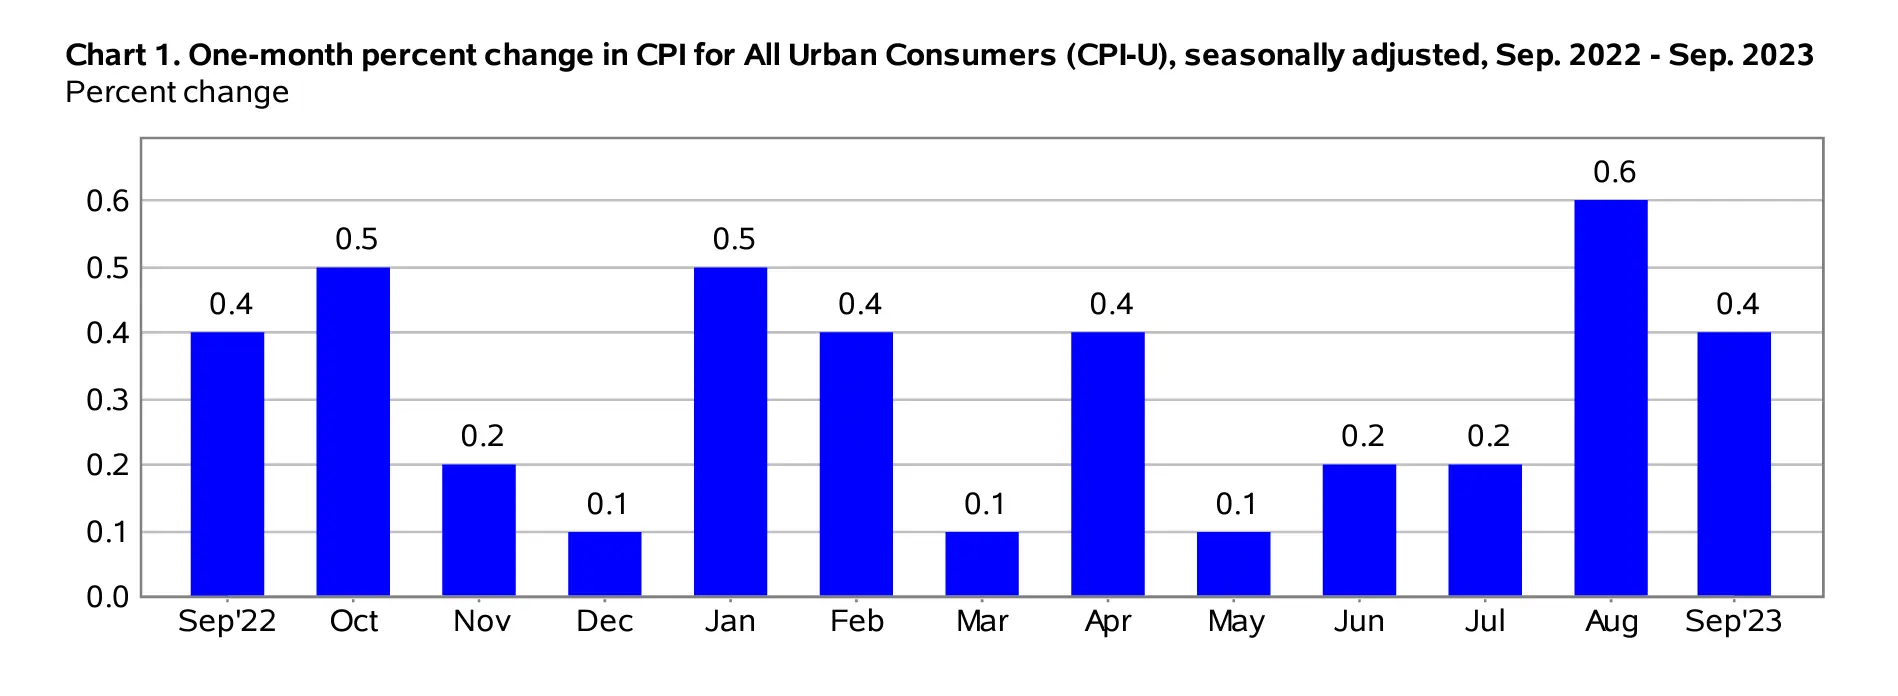
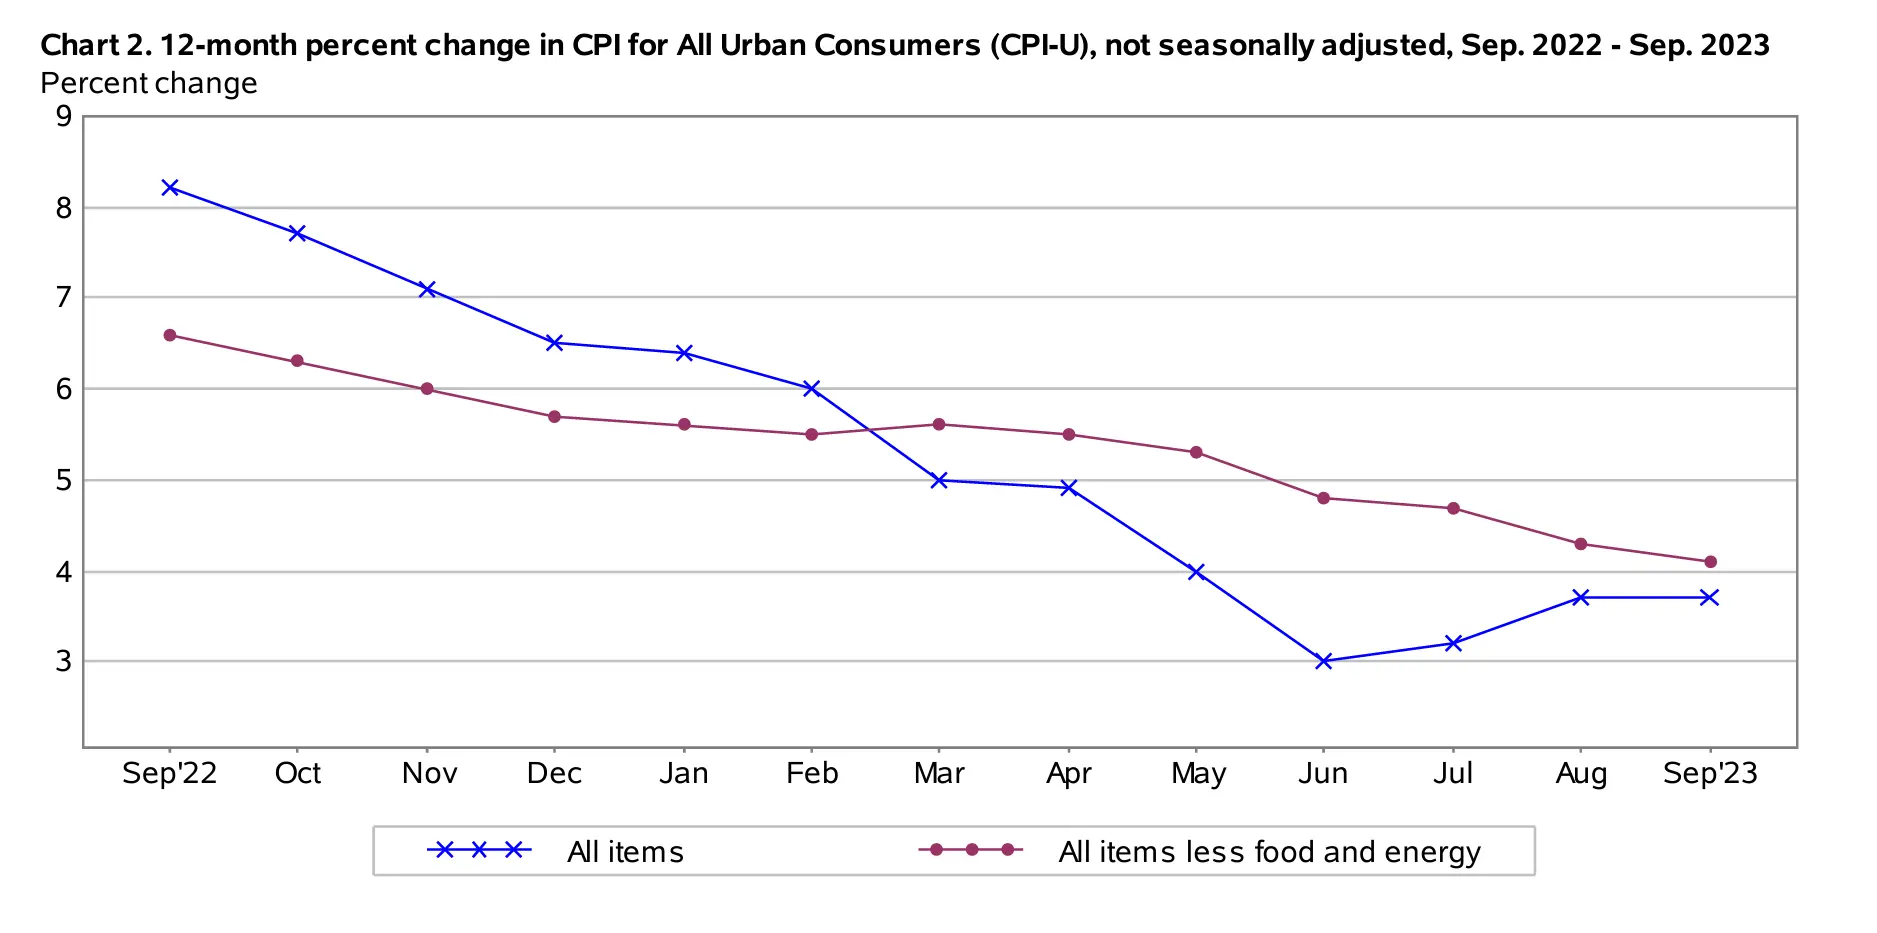
The September 2023 report of the Consumer Price Index of All Urban Consumers (CPI-U) indicates that inflation increased by a lesser margin than August’s 0.6% month-over-month bump that was largely driven by rising gasoline prices. The CPI-U increased by 0.4% on a seasonally unadjusted basis in September 2023, according to the Bureau of Labor Statistics report published October 12, 2023. Before seasonal adjustment, the year-over-year (Y-o-Y) inflation rate in the all-items index grew by 3.7%, marking an identical increase to August’s CPI report.
September’s CPI report came in a bit hotter than anticipated according to a CNBC forecast that cited 0.3% and 3.6% month-over-month and annual increases, respectively.
Financial markets opened on Thursday morning at a loss following September’s inflation news. The Dow Jones Industrial Average is down 90.55 points as of 11:30 a.m. on Wednesday, and the S&P 500 is down by 4.19 points.
The main drivers of inflation according to September’s inflation report are shelter costs, which rose by 7.2% on a year-over-year basis. On a macro-economic level, the ongoing inflationary conditions appear to cast doubt on whether the Federal Reserve will issue yet another interest rate hike at the next Federal Open Market Committee meeting on October 31. Given hotter-than-expected inflation data, all signs currently point to there being another 0.25 basis point rate hike before year-end.
Source: Bureau of Labor Statistics
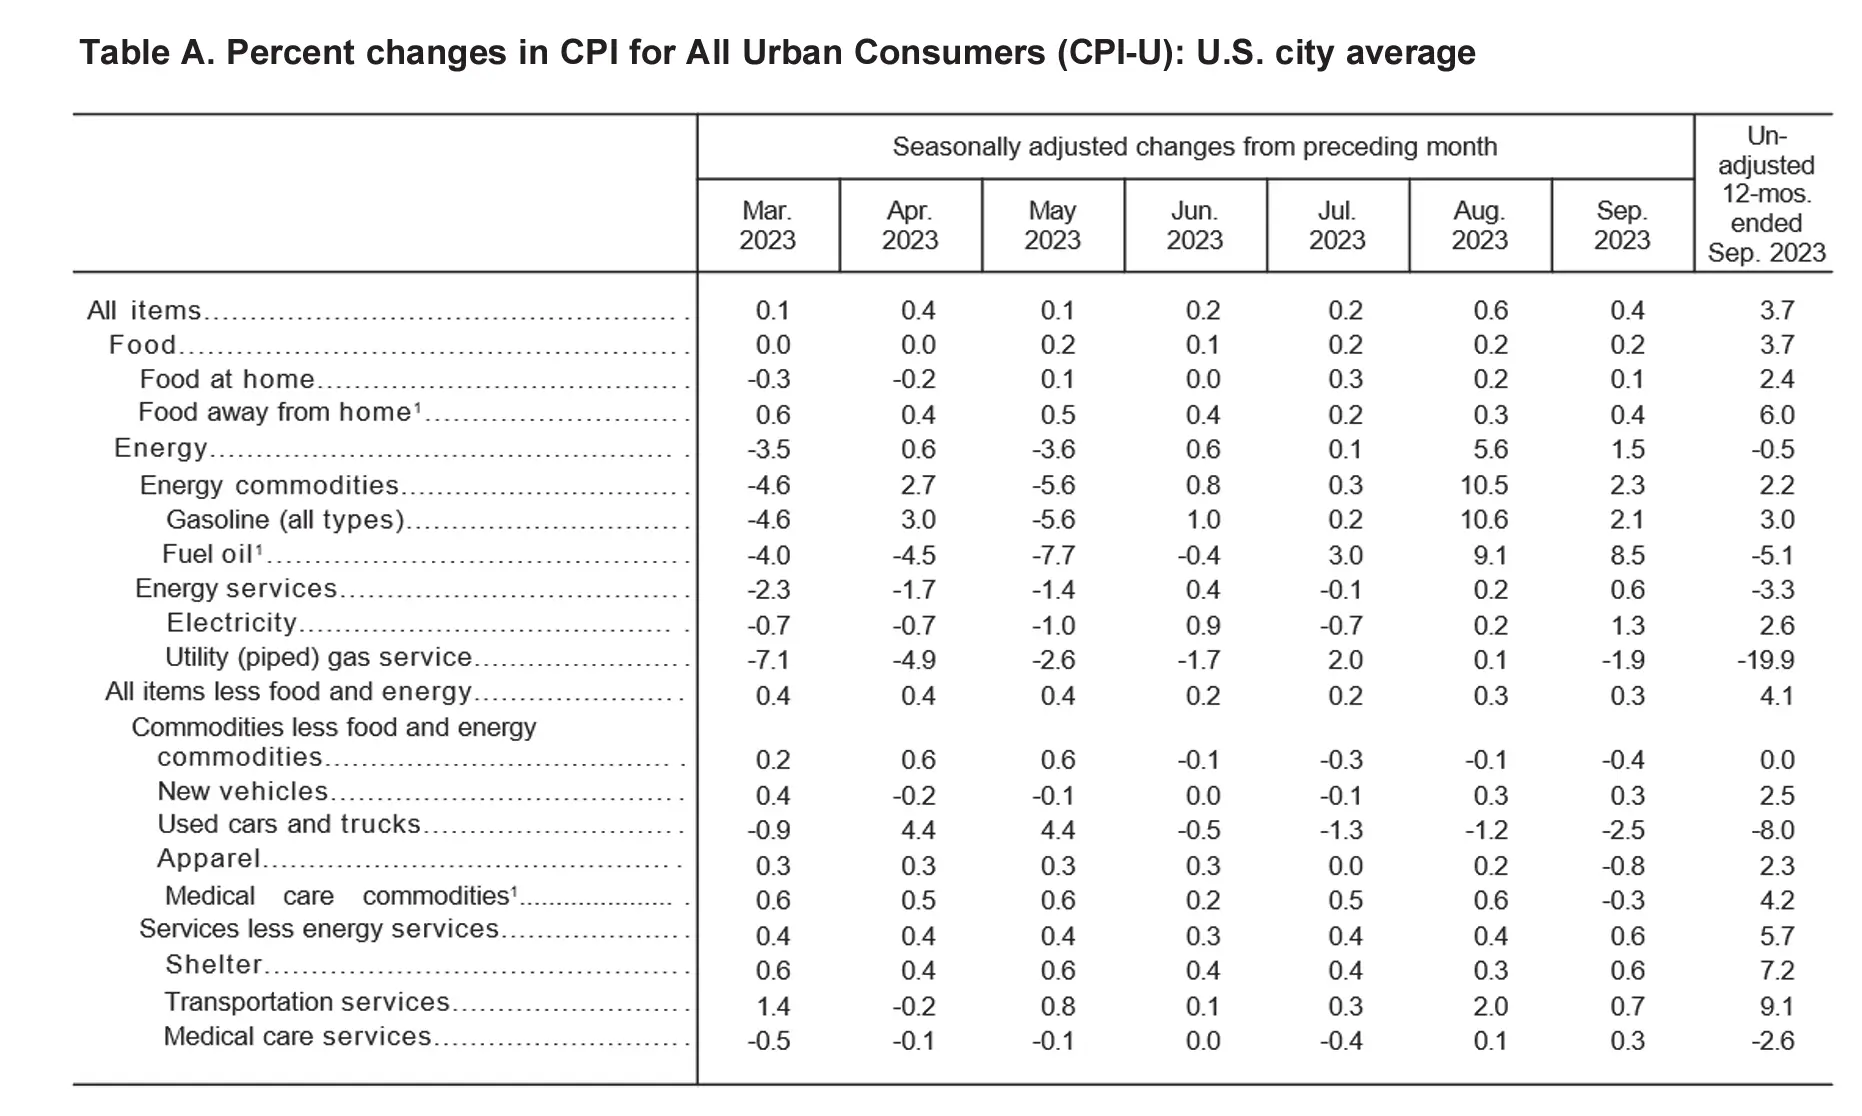
September’s monthly CPI figure marks a deceleration from August’s (0.6%) while outpacing July’s reading (0.2%). As depicted in the table above, the September 2023 CPI figure was largely driven by increases in shelter costs (7.2), transportation services (9.1) and food away from home (6.0).
Food Prices
In September, the food index rose by 0.2 percent, the same marginal increase seen in both August and July. Notably, the index for food away from home rose by 0.4 percent, doubling the food at home index increase. Important price decreases include meat, poultry, fish, and eggs, which rose 0.5 percent in September, while bakery products and cereals decreased by 0.4%, marking the first time that this index segment decreased since June 2021.
Energy Prices
The energy index rose by 1.5 percent in September following a large 5.6 percent increase in August due, largely, to base year effects. The index for electricity rose 1.3 percent in September, a notable increase from August’s 0.2 percent uptick. Fuel oil represented a large portion of September’s energy price increases, rising 8.5 percent while the natural gas index decreased by 1.9 percent.
On an annual basis, the energy index fell by 0.5 percent with mixed components, including the natural gas index falling 19.9 percent year-over-year and the gasoline index rising 3.0 percent in September.
Core September 2023 CPI
Regarding the core CPI data for September 2023 (i.e., inflation less food and energy), the index rose 0.3 percent month-over-month, matching August’s increase and marking an increase from July and June’s core CPI acceleration of 0.2 percent. Below is an itemized breakdown of the main price fluctuations seen in September’s core CPI reading:
- Rent index: +0.5%
- Lodging away from home: +3.7%
- Motor vehicle insurance: +1.3%
- Medical care index: +0.2%
- Used cars and trucks: (-2.5%)
- Recreation +3.9%
- Personal care items: +6.1%
Source: Bureau of Labor Statistics
Seasonally Unadjusted CPI Data for September 2023
Before seasonal adjustments, the CPI-U for September 2023 increased (+3.7%) year-over-year, rising to an index level of 307.789. Since these figures are unadjusted, they include regular seasonal price fluctuations that generally occur by the same margins every year.
Source: Bureau of Labor Statistics
Get Ahead of Inflation This Autumn: Protect Your Wealth
September’s inflation numbers indicate that August’s CPI reading wasn’t a fluke. Price increases are here to stay, despite the Fed’s hawkish rate hike campaign. The end result is that every American family has less purchasing power compared to this time last year, and the average American worker has less of their pay check to devote to monthly expenses. All the while, personal debts are rising fast—in fact, America’s total credit card debt exceeds $1 trillion and student loan repayments are once again mandatory after an over 3-year freeze on interest accumulation.
The good news is that you have the power to counteract the negative effects of inflation and other worrisome macroeconomic indicators. Consider consulting with a financial expert about diversifying your investment portfolio with alternative assets. Hard investments in gold and silver have the potential to shield your savings from the diminishing value of the U.S. dollar and help you retain your wealth during inflationary environments.
Historical events in 2008 and 2020 have shown that assets like gold and silver have outperformed conventional securities during market turbulence. For many, gold serves as a safeguard against inflation, offering a dependable store of value when traditional assets falter.
Considering taking a position in gold or silver? Get started by opening an account with one of the top-rated gold IRA service providers. In the meantime, our complimentary CPI inflation calculator tool can help you monitor how inflation affects your purchasing power within your household over the coming months.

