
Emily Cross Leon
Emily is a Canadian financial blogger with multiple degrees in economics and extensive professional experience as a financial analyst. She was formerly a Ph.D. candidate at the University of Guelph's School of Agricultural Economics. Before that, she received an MA from the University of San Francisco in International Development Economics. She also has a BA in Math with a minor in Economics.
by Emily Cross Leon | Nov 17, 2016 | Definitions
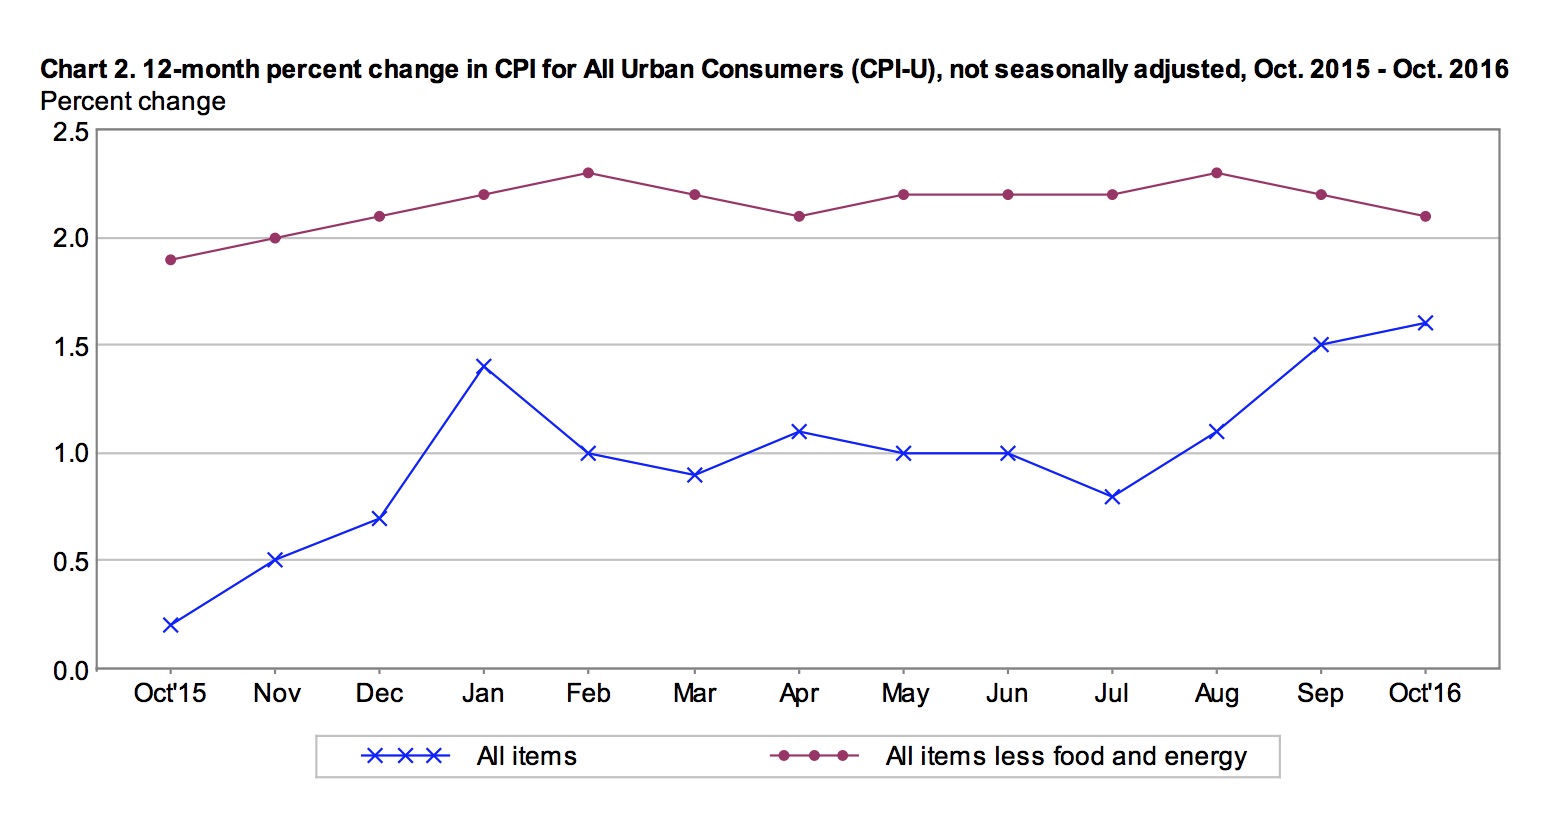
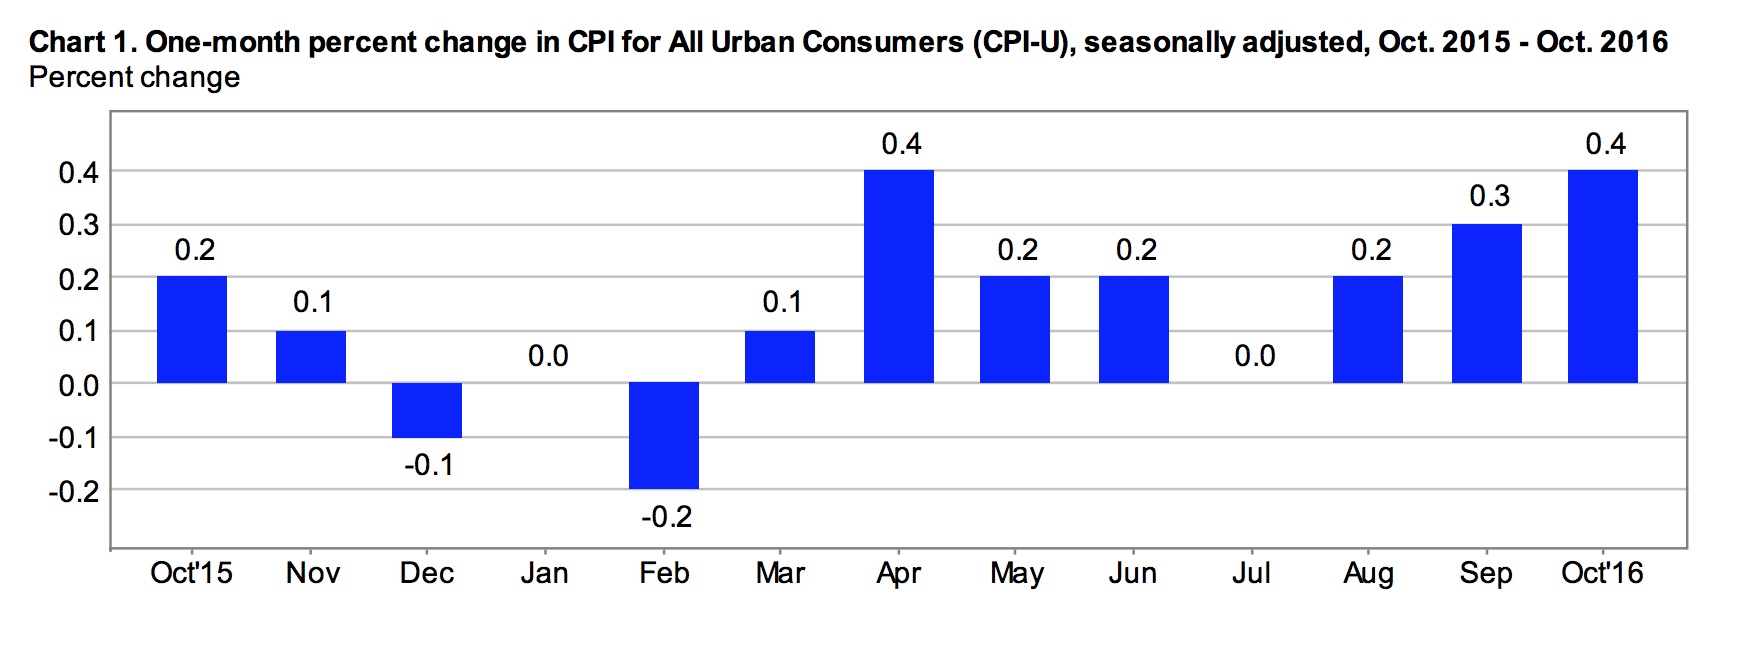
Prices, measured by the consumer price index for all urban consumers (CPI-U), inched up 0.1% in October, after increasing 0.2% in September. However with seasonal adjustments, inflation accelerated to 0.4% in October from 0.3% in September due to a spike in energy prices. On an annual basis, the headline index climbed 1.6% in October, the highest annual rate in 2 years.
October’s CPI report, which the BLS released this morning, suggests that underlying economic strength has yet to put much pressure on consumer prices. Core inflation, up a seasonally adjusted 0.1% in October, was below analysts’ expectations. Year-over-year, core inflation has declined for the second consecutive month.
Today’s report is important as retail sales surpassed expectations this week and point to economic stabilization. Employment numbers are also strong, which makes the case for the Fed to begin tightening or raising rates to reign in accelerating economic growth. Inflation has been the missing piece in the Fed’s criteria for a rate hike and that has not changed today. However, October’s inflation numbers will likely not spook investors expecting to see interest rates moving higher.
October Prices
The energy index fell 0.5% in October prior to seasonal adjustments. Prices at the pump were 1.8% higher and fuel oil costs increased 5.9%. Offsetting this growth, the index for energy services declined significantly, down 2.8% due to a 3.7% drop in electricity service costs. With seasonal adjustments, gas prices were 7% higher in October and the energy index actually climbed 3.5% in October. Seasonally adjusted monthly inflation appears to be accelerating.
The price of food was up 0.1% in October but flat with seasonal adjustments. There was no change in the index for food at home. At the grocery store, a 0.8% decline in the index for meats, poultry, fish and eggs was balanced by higher prices for most other food items. The index for food away from home increased 0.1% in October.
The index for all items less food and energy gained 0.2 % in October. Within this core index, the index for shelter increased 0.3%, with rent prices up a monthly 0.5%. The medical services index was flat. The index for transportation services increased by 0.5%, including airfares climbing 1.3% and car insurance up 0.9% in October.
Annual Inflation
The CPI-U was up 1.6% year-over-year in October despite a 0.4% decline in the food index. To reflect consumer spending habits, food accounts for roughly 14% of the CPI-U. About 8% is allocated to food at home and the remainder measures the price of food away from home. Over the past year, the index for food at home has declined 2.3% and the index for food away from home has increased 2.4%. All six components of grocery store consumption posted lower prices year-over-year; the largest decline was in the price of meat, poultry, fish and eggs, down an annual 6.4%.
The energy index increased a modest 0.1% over the relevant year. Energy commodity prices fell 0.9%, including a 0.9% decline in gas prices. Energy service prices were up 1.3%. Commodities and services each account for roughly half of the energy index.
The index for all items less food and energy added 2.1% over the year ending in October. Shelter costs were reportedly up 3.5% with renters paying 3.8% more than a year earlier. The cost of medical care services also grew, up 4.1% as health insurance was 6.9% more expensive over the year ending in October. Prices for medical care commodities jumped 5%, driven by a 7% increase in the cost of prescription drugs.
The price of used cars and trucks declined 4.1% over the relevant year but the index for car and truck rentals grew 4%. Also notable, the cost of car insurance was 6.7% higher.
Market outlook
The FOMC met to discuss monetary policy on November 1-2 and decided to leave the overnight rate unchanged. Accomodative monetary policy was again deemed necessary to support improvements in the labor market and a return to the 2% inflation target. However, it is largely agreed at this point that the time to raise rates has come. Yellen has strongly indicated that this will happen in December. The pace of future rate hikes is less agreed upon.
“Inflation is expected to rise to 2% over the medium term as the transitory effects of past declines in energy and import prices dissipate and the labor market strengthens further. Near-term risks to the economic outlook appear roughly balanced.”
Following some initial turmoil in the post-election markets, during which expectations for a rate hike in December temporarly dropped, markets have changed their tune. Inflation expectations have recently moved much higher as investors are betting on increased government spending to spur growth and drive future inflation. Markets have priced in a near 100% likelihood of a rate hike in December.
by Emily Cross Leon | Oct 18, 2016 | Definitions
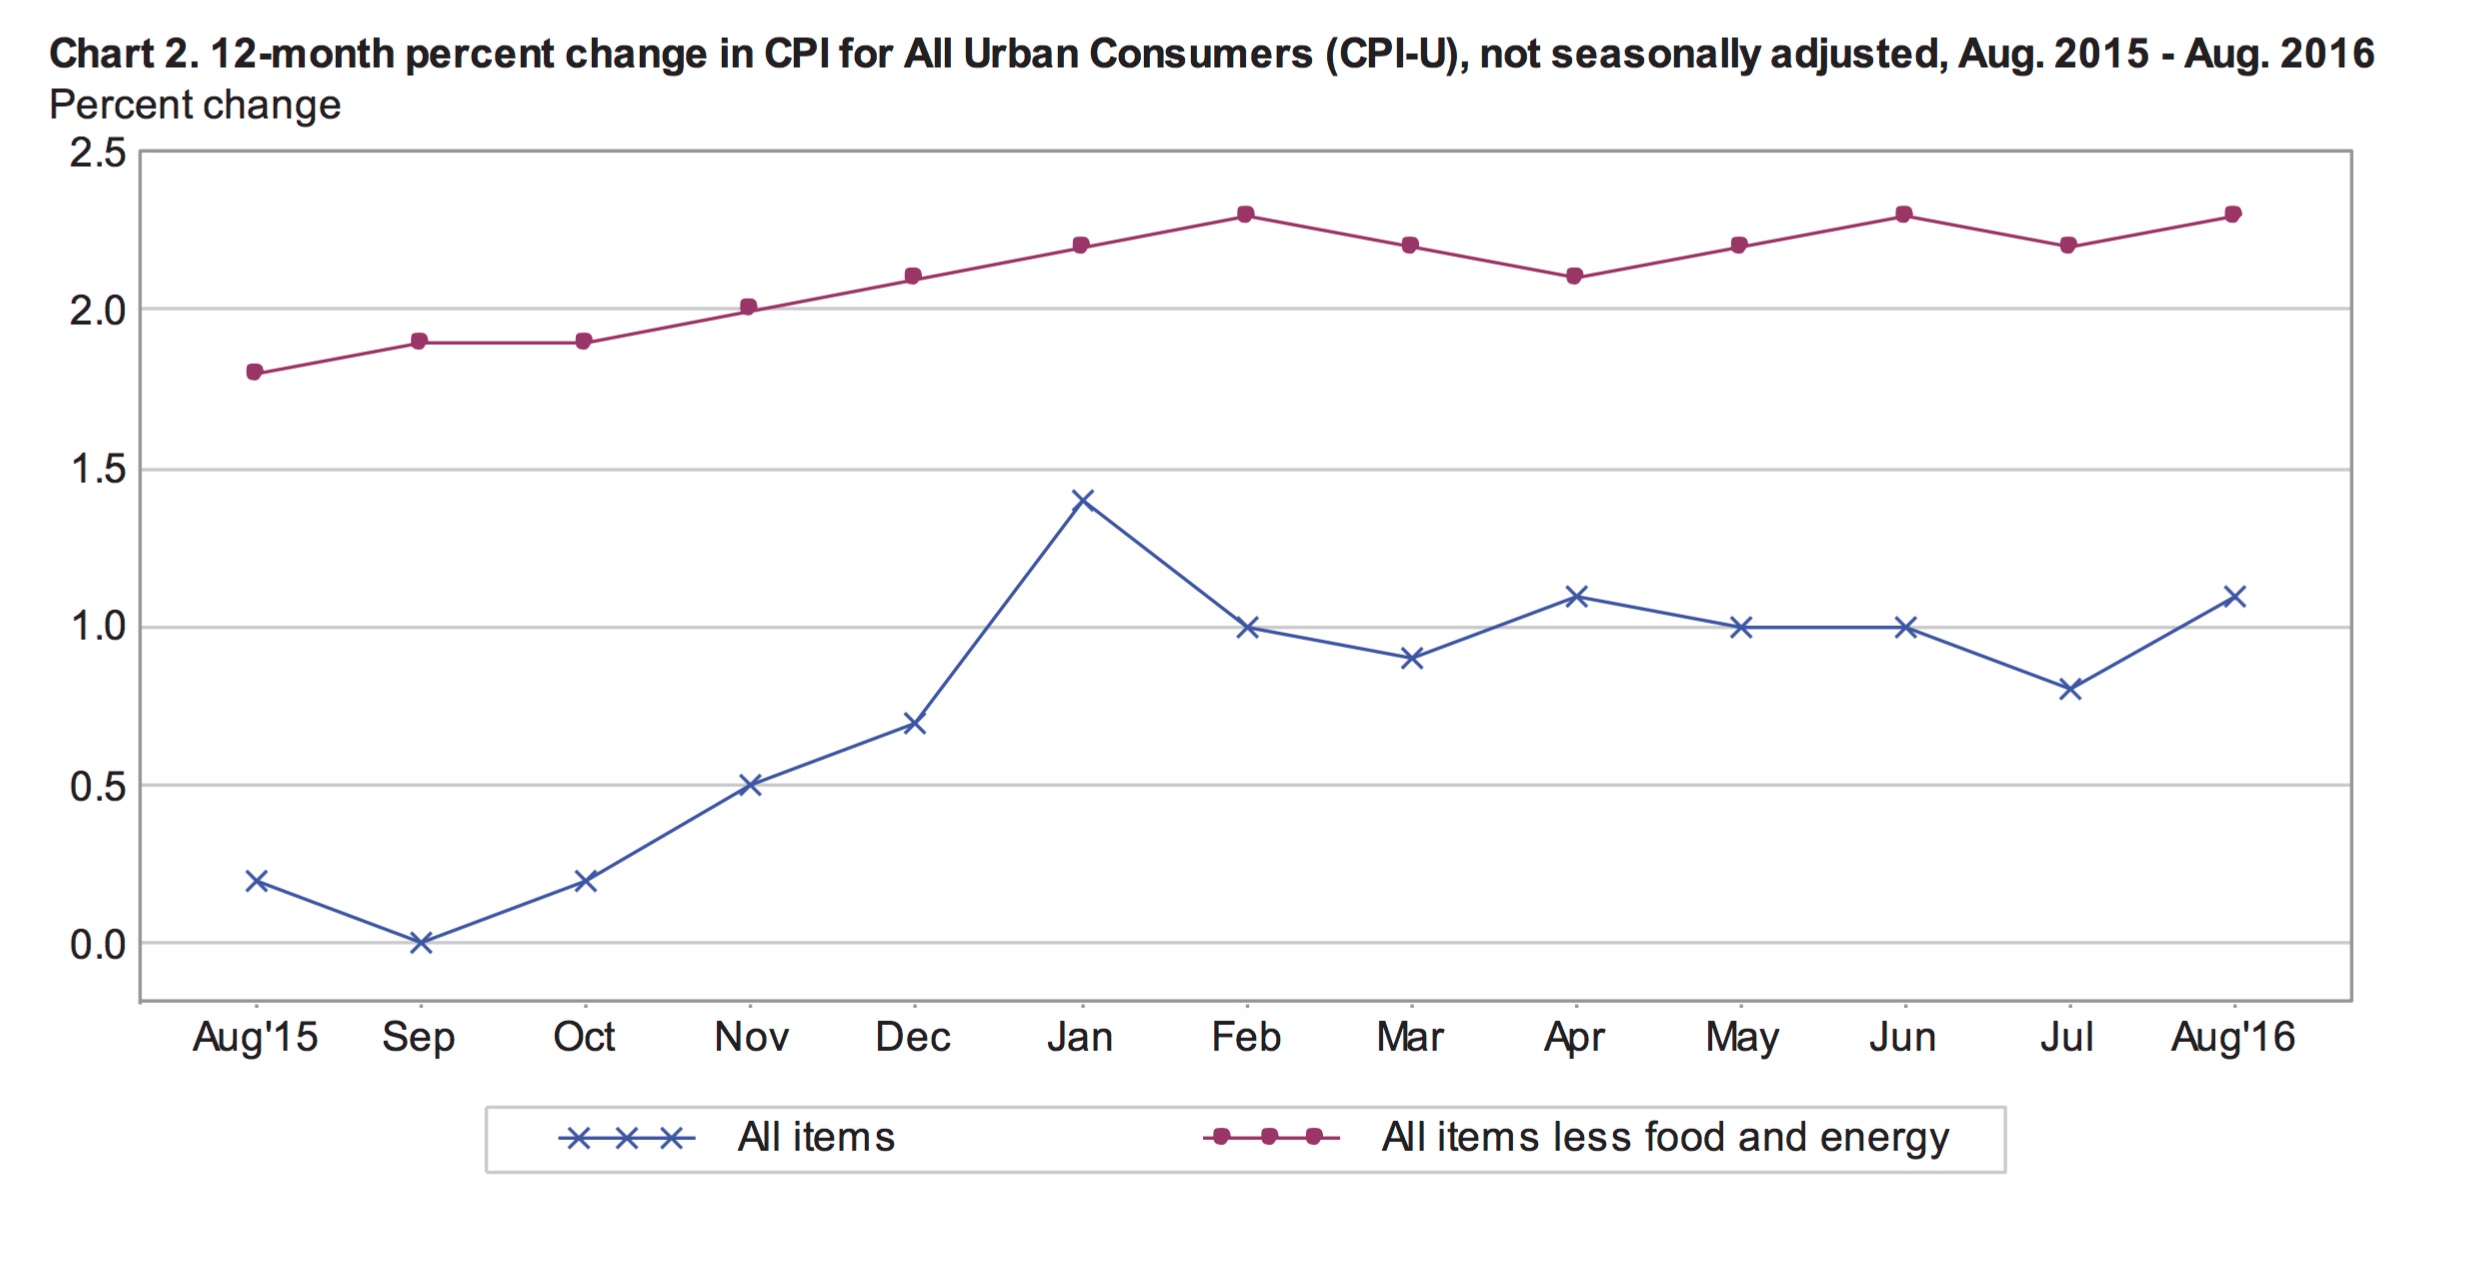
The consumer price index climbed 0.2% in September according to today’s inflation repot from the BLS. Higher prices for shelter and energy bolstered monthly inflation. For the year ending in September, the CPI increased 1.5%, the highest 12-month rate in nearly 2-years. Annual inflation was driven by growing shelter, transportation and medical care costs.
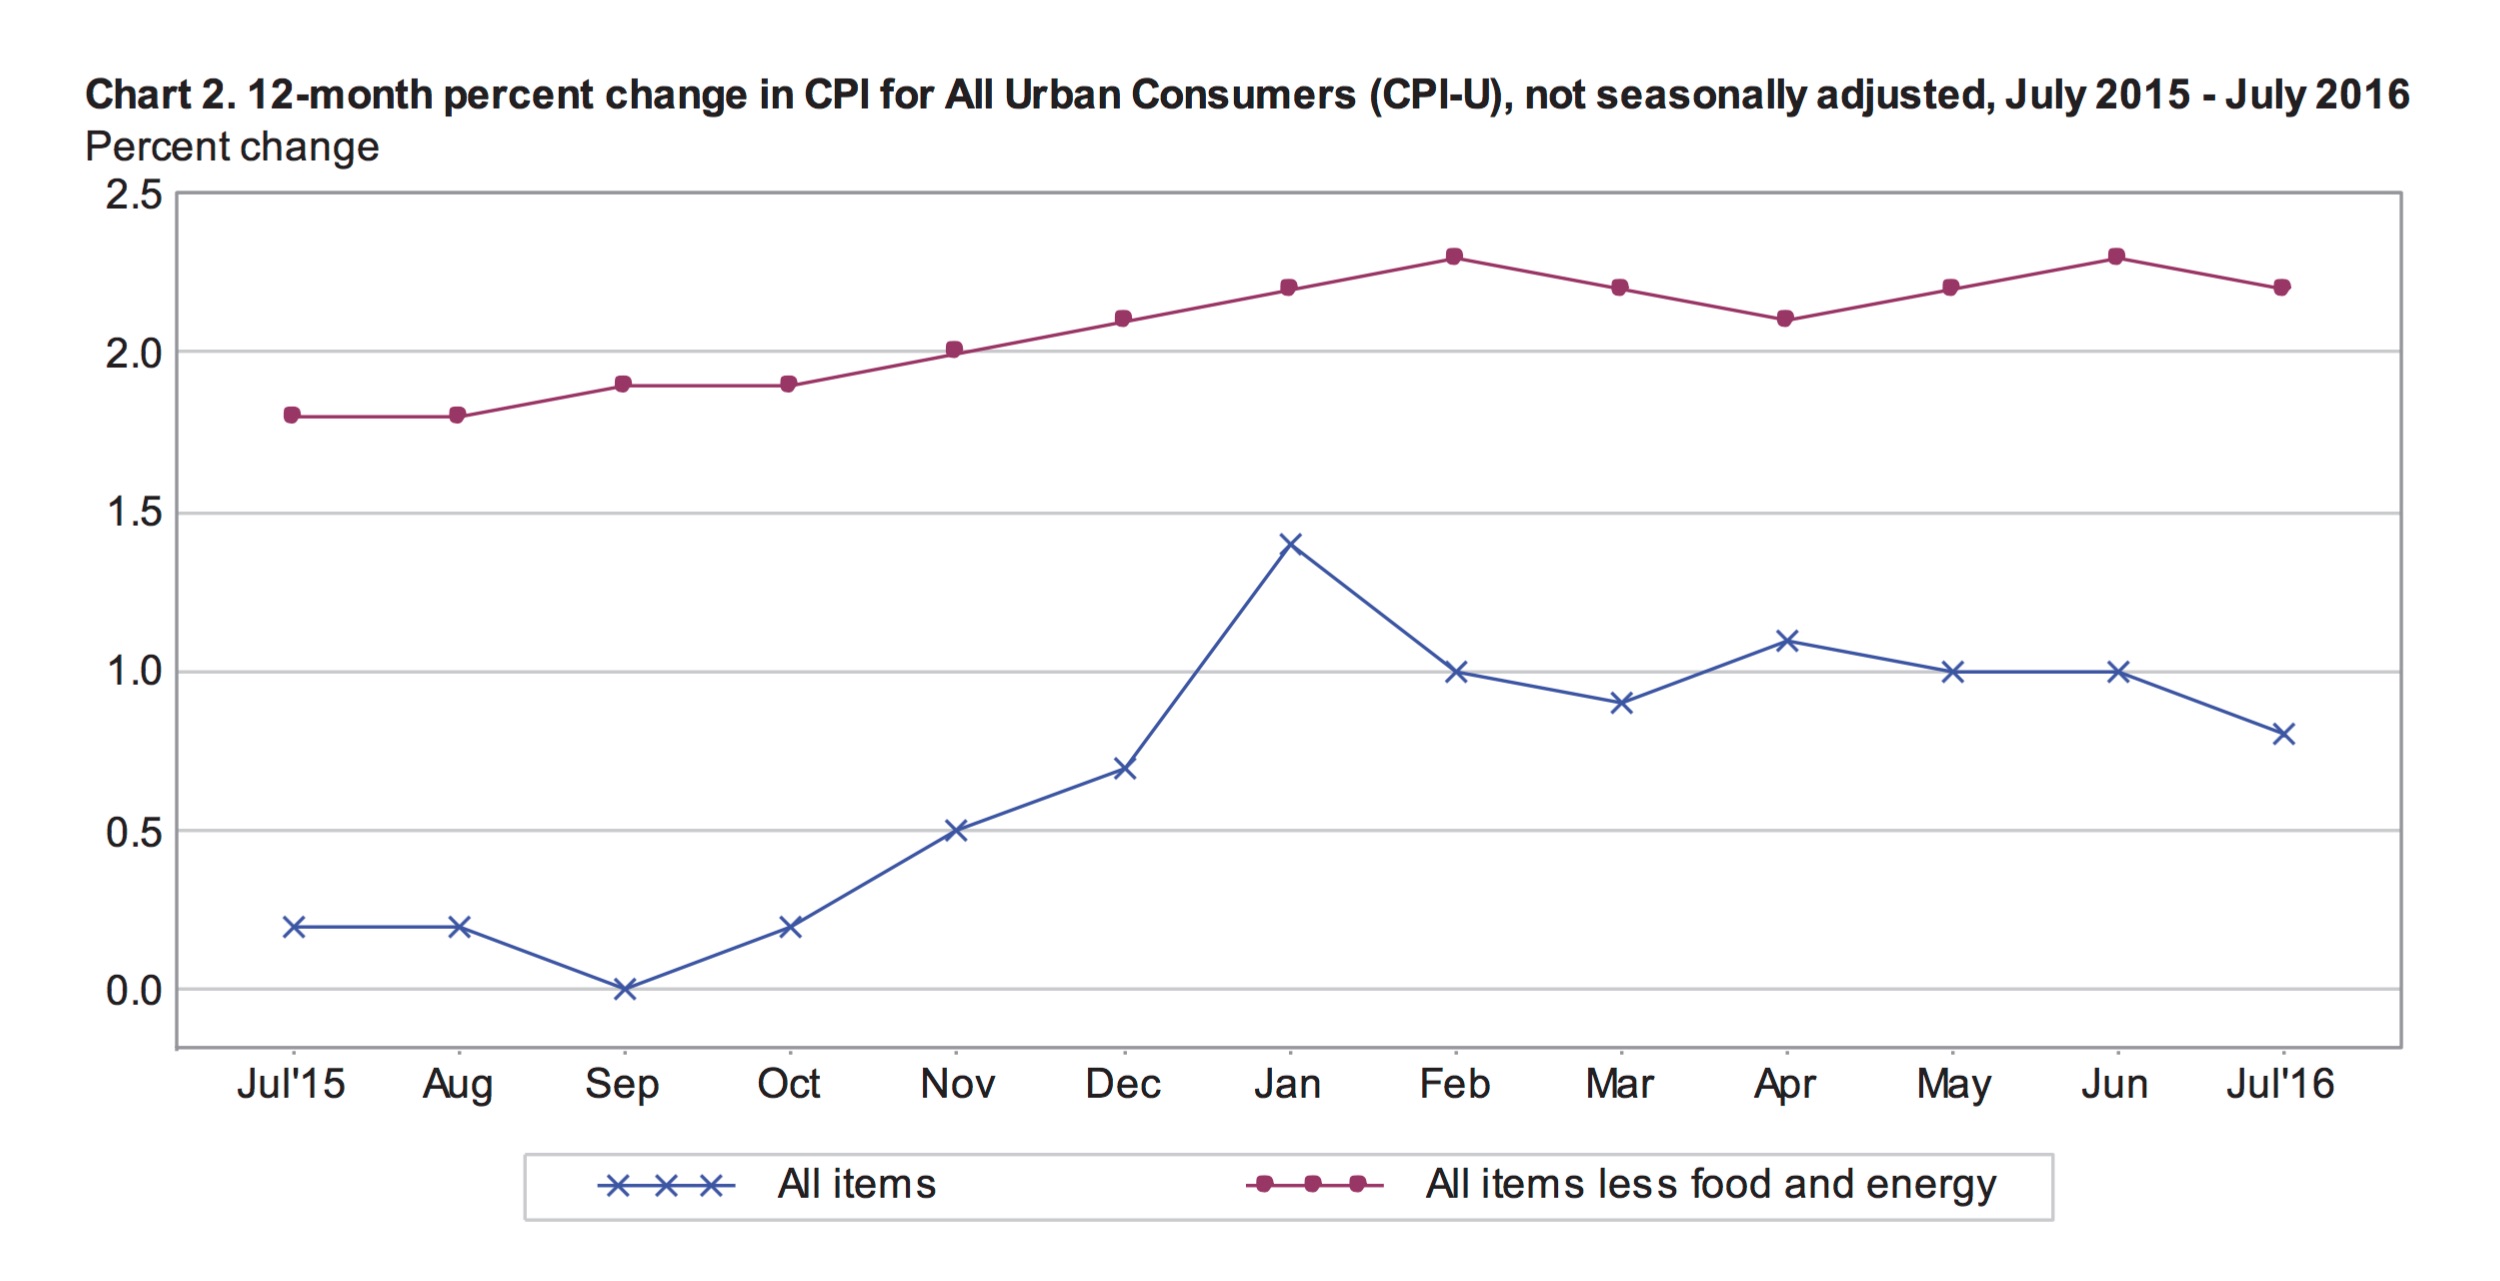
Core inflation, which eliminates volatile food and energy prices, was up 0.1% in September with seasonal adjustments, compared to 0.3% in August. The deceleration in core prices does not support the Fed’s intention to raise interest rates in the coming months. Core numbers better indicate true economic growth compared to headline inflation, which tends to be swayed by volatile gas prices. The chart below shows the monthly percentage changes in the core and all-items indexes over the past 13-months. On an annual basis, unadjusted core inflation was 2.2% in September, close to the Fed’s 2% annual target rate.

September’s Inflation
The food index was flat after seasonal adjustments in September for the third consecutive month. The price of food at home declin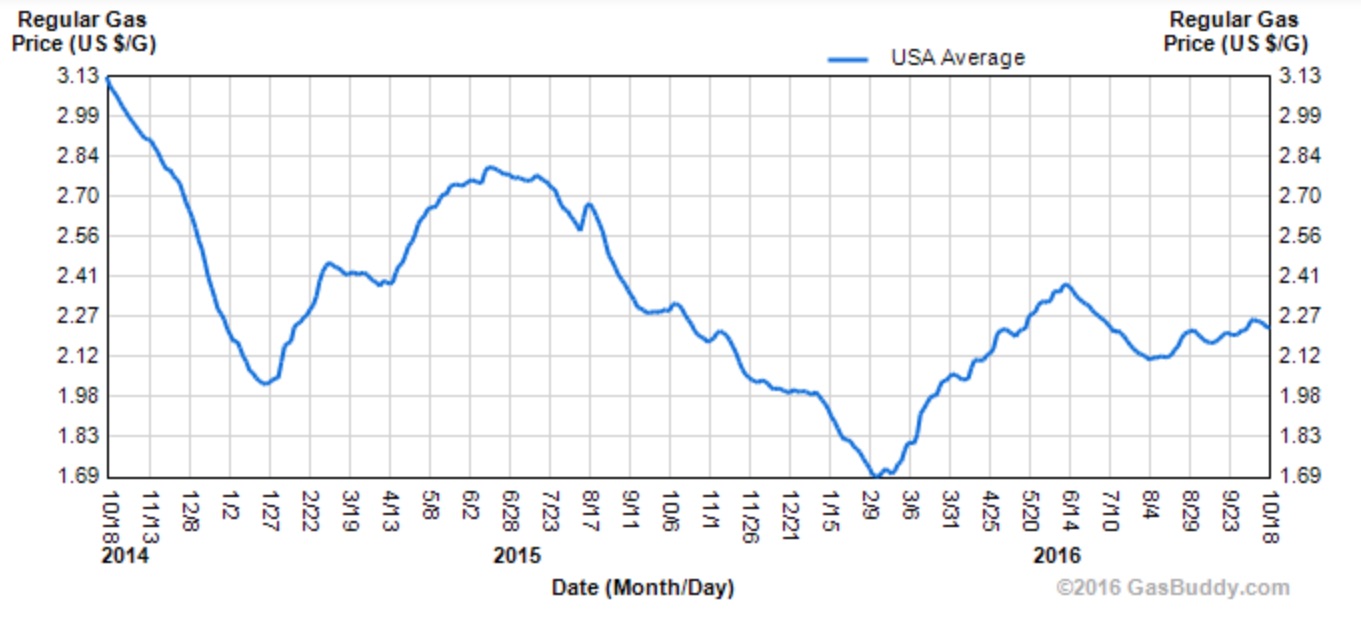 ed 0.1%, offsetting a 0.2% increase in the index for food away from home.
Energy prices were the main driver of September’s inflation; the seasonally adjusted energy index was up 2.9%. Within this index (which accounts for around 7% of the overall CPI) the index for energy services (piped gas and electricity) was up 0.7%, while energy commodities spiked 5.5%. Gasoline accounts for approximately 44% of the energy index and just over 3% of the all-items index. The graph to the right illustrates the price of gasoline over the past two years. At the pump, prices climbed 5.8% in September, which basically offset declines in July and August.
The shelter index was 0.4% higher in September as the cost of rent grew 0.3% and owner’s equivalent of rent was up 0.4%. Medical care costs inched up 0.2% including a 0.8% spike in the index for prescription drugs. Offsetting these inflationary trends, the index for communication declined 0.8% and the apparel index fell 0.7%, both on seasonally adjusted bases in September.
Inflation Over 12-Months
Growth in the all-items index over the year was driven by increases in the costs of medical care, shelter and transportation. The medical care index added 4.9%, year-over-year. Notably, the cost of inpatient hospital services was up 6.3% and the price of health insurance reportedly grew by 8.4%. Shelter costs were up 3.4% from September 2015; the rent index increased 3.5% and owner’s equivalent of rent was up 3.4%. Also, the index for moving costs jumped 9.4% over the relevant year. Transportation services were 3% higher, including 6.4% higher motor vehicle insurance costs.
The food index declined 0.3% on an annual basis in September. The price of food away from home added 2.4%, while the price of food at home slipped -2.2%. At the grocery store, most items were less expensive year-over-year. Significant declines include the price of coffee, down 2.8% and the index for meat, poultry, fish and eggs, which fell 6.3%. The price of eggs was reportedly down 37.6% over the 12-month period.
The energy index fell an annual 2.9%, its smallest annual drop in 2-years. Gasoline prices were down 6.5%, which reduced the all-items annual growth rate by a full quarter of a percentage point. Stripping out energy, inflation was 1.8% for the 12-months ending in September. Interestingly, the index for only commodities fell 1.1% year-over-year, while the index for services was up 3.0%.
Regional Breakdown
In September, inflation was distributed relatively evenly across geographical regions. However, smaller urban areas (those with populations under 50,000) saw slightly higher growth in overall price levels. This was particularly true in the south where smaller cities posted 0.6% monthly inflation, three times the national average. Year-over-year, inflation was largely concentrated in larger cities in the West. Cities in the West with populations over 1.5 million saw prices jump 2.4%, compared to 1.5% for the country as a whole.
Economic Outlook
There is very little economic data that suggests raising interest rates would be prudent in the current environment and yet many foresee a rate hike this year. The Federal Reserve has clearly stated their intention to raise rates and will be debating if meeting the expectations they have set is more important than basing rate decisions on real data. According to Stanley Fischer, Vice Chairman of the Federal reserve:
“Changes in factors over which the Federal Reserve has little influence–such as technological innovation and demographics–are important factors contributing to both short- and long-term interest rates being so low at present.“
These factors are depressing interest rates across the globe and are unlikely to change in the foreseeable future. Economies are adjusting to slower long term growth, aging populations and post-recession readjustments. This means lower long term interest rates in the US and around the world. The federal reserve is divided on wether to raise rates. Higher rates make the economy more resilient to downturns but also put the breaks on growth and potential output.
by Emily Cross Leon | Sep 16, 2016 | Definitions
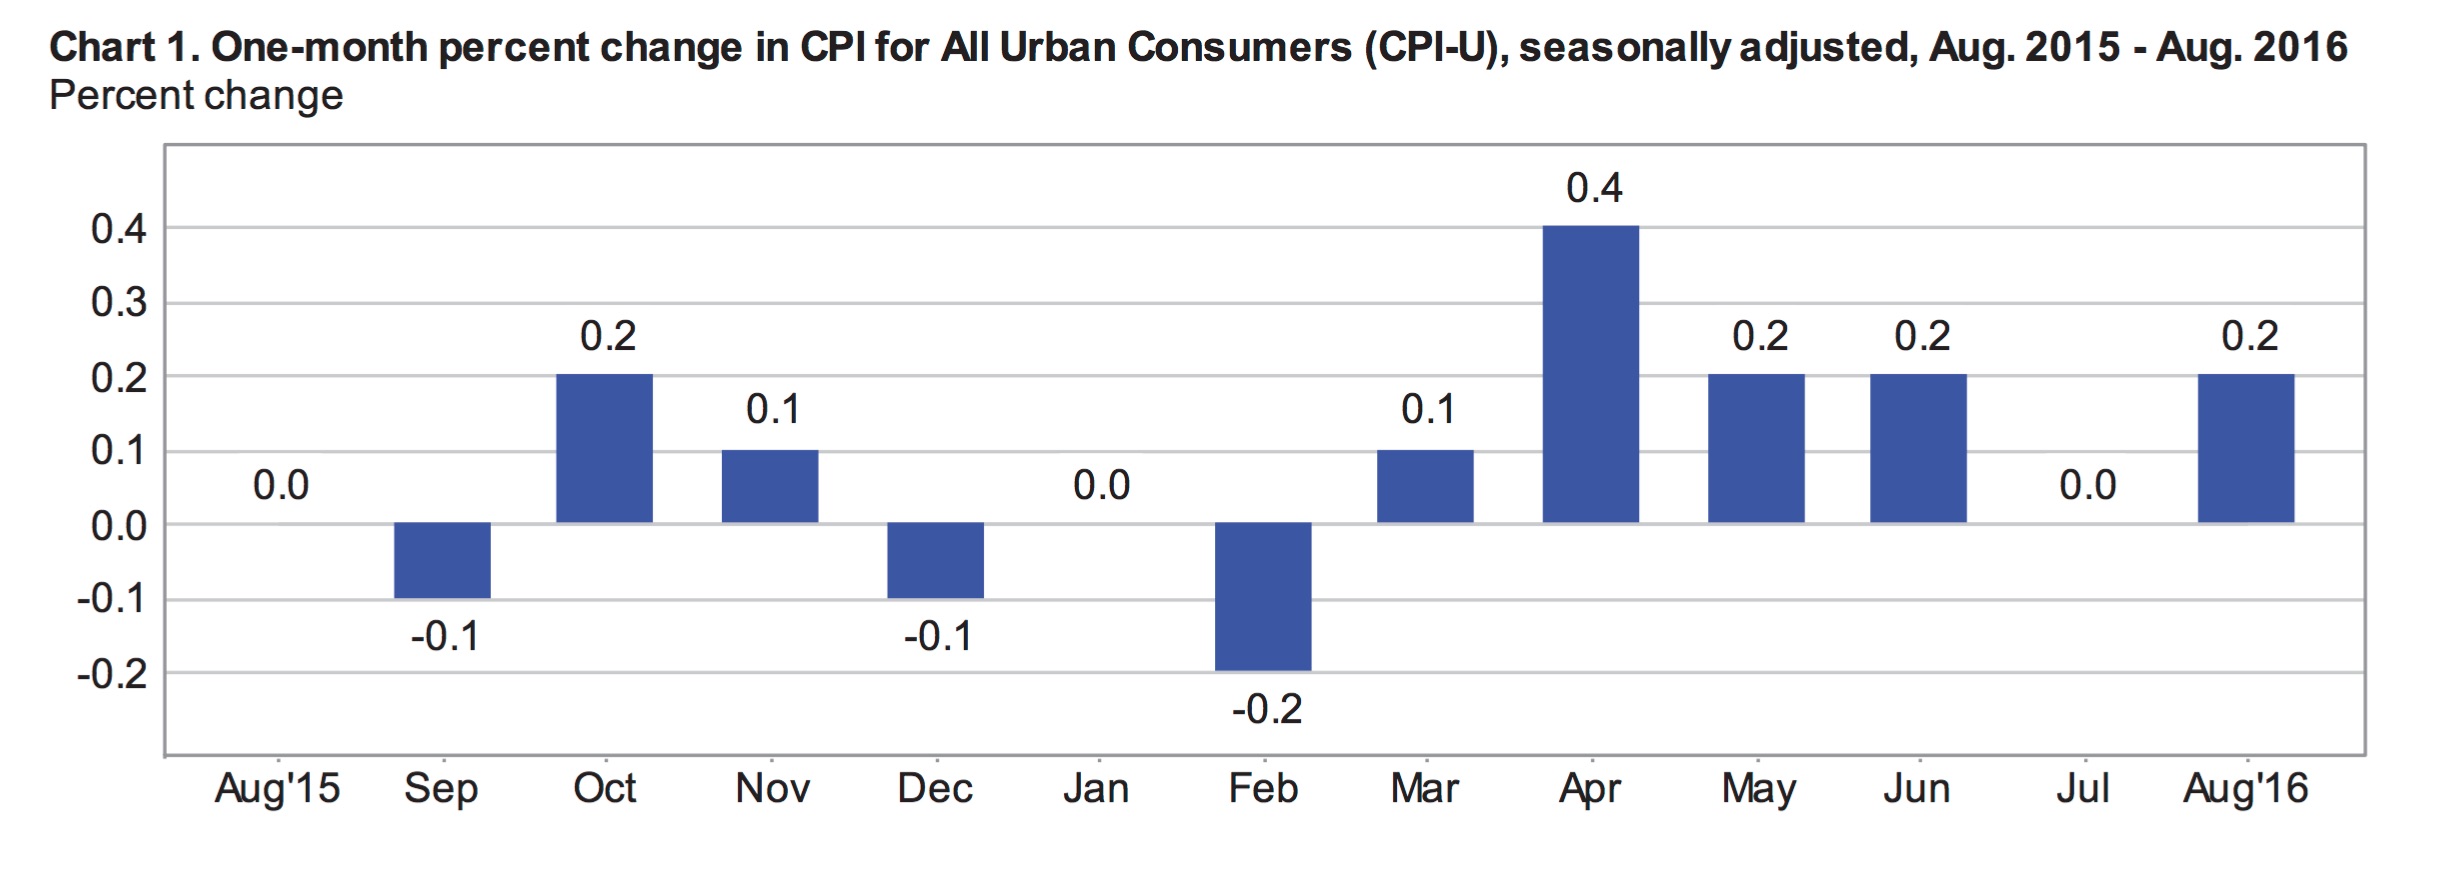
According to this morning’s report from the BLS, headline inflation was 1.1% for the year ending in August. This is up from 0.8% for the year ending in July and also higher than markets had expected. The federal reserve will welcome this news as stubbornly slow inflation has been a major factor in their reluctance to raise rates, despite their clear intention. While growth in the all-items index remains well below the Fed’s 2% target, core inflation indicates that the economy is moving in the right direction.
The all-items index less food and energy remained well above the headline index in August, up 2.3% year-over-year. Stripping out only energy prices, which are extremely volatile and sensitive to external factors, the consumer price index was up 2% in August.
Monthly Inflation
Seasonally adjusted monthly inflation was 0.2% in August after remaining flat in July. Stripping food and energy from the index, seasonally adjusted core prices were up 0.3% in August – more than expected. The monthly acceleration in the core index was largely driven by higher prices for shelter and medical care. The price indexes for food and energy did not change in August.
Prior to seasonal adjustments, the energy index fell 1.2% in August. Energy commodities fell 2.9% and energy services inched up 0.3%. The energy commodity index includes subindexes for motor fuels, fuel oil and other fuels, all of which were down roughly 3% in August. Energy services includes electricity, which remained unchanged and utility (piped) gas, which was 1.6% more expensive in August.
Unadjusted food prices were up 0.1% in August. The seasonal nature of food prices means adjusted numbers are often a more meaningful indicator of economic activity. On a seasonally adjusted basis, prices at the grocery store were down 0.2% in August. This includes a 6.6% decline in the price of eggs and a 1.5% drop in the index for breakfast cereal.
The shelter index, which represents one third of the all-items index, was a major driver of inflation for the month, gaining 0.3%. The subindexes for rent and owners equivalent of rent were up 0.3% and 0.4% respectively. The index for apparel spiked 1.5% in August while medical care costs were 0.8% higher. Airlines fairs dropped a notable 5.5%.
Inflation Over 12-Months
The 12-month inflation rate for the all-items index accelerated in August compared to July. Over the year, food and energy prices slowed inflation while medical care and shelter costs pushed higher. The shelter index was up 3.4% over 12-months. Medical care services including hospital services and physician services, jumped 5.1% year-over-year. Transportation service costs were up 3.1% due to a reported 6.5% increase in the price of motor vehicle insurance.
The net food index was flat over the 12-months ending August despite significant price movements within the index. The price of food at home (which accounts for about 58% of the food index) fell 1.9% and the price of food away from home grew 2.8%. At the grocery store, meat, poultry, fish and eggs is the largest component of the CPI. This subindex declined 6.5% over the year. The next largest component within the grocery store index is fruit and vegetables, this subindex added 0.3% compared to a year earlier.
Energy prices continued to create a large drag on inflation, although less in August compared to July. The index for energy commodities was down 17.3% for the year ending in August. At the pump, prices fell 17.8% over that period compared to 19.9% for the year ending in July. On the other hand, energy services only inched down an annual 0.4% in August.
Inflation by Region
Over the year, inflation was strongest in the West (1.6%) and lowest in the Midwest (0.6%). In the Northeast, inflation was in-line with the national average of 1.1%. However, inflation in the Northeast was significantly higher in cities with populations over 1.5 million compared to smaller cities (1.2% compared to 0.8%). This discrepancy is also evident in the South and West. Inflation in San Francisco was 3.1% for the year ending in August. In Chicago, prices were down 0.3% year-over-year.
| Urban Population | 12-month | August |
| over 1.5 million | 1.3% | 0.1% |
| 50,000 to 1.5 million | 0.7% | 0.1% |
| under 50,000 | 0.8% | -0.1% |
| Urban Regions | 12-month | August |
| Northeast | 1.1% | 0.1% |
| Midwest | 0.6% | 0.1% |
| South | 1.0% | 0.1% |
| West | 1.6% | 0.1% |
Outlook for the Fed
Today’s inflation report should help the Fed come to more of a consensus over the timing of interest rate hikes. Despite having stated strong intentions to raise rates from their unprecedented lows, they have not been confident enough to follow through in a meaningful way. It is not likely that they will raise rates when they meet next week or again in November.
However, expectations are growing for a rate hike in December despite the fact that other economic reports for August have been less than positive. Some economists argue the Fed would be wise to cut rates to keep steam in the economy but that is very unlikely. The expectations for an increase in the benchmark rate, measured by the market price of 30-day fed funds futures, increased on today’s positive inflation surprise from 48.2% to 52.6%.
by Emily Cross Leon | Sep 16, 2016 | Definitions
According to this morning’s monthly inflation report from the BLS, consumer prices fell 0.2% in July after rising 0.3% in June. With seasonal adjustments, overall price levels were flat in July following increases of 0.2% in both May and June. Over the 12-months ending in July, the consumer price index for all urban consumers (CPI-U) added 0.8%, down from 1% in the two previous months. Today’s report will disappoint investors who had been expecting slightly higher numbers. It also quells expectations that the Fed will raise interest rates in the near term.
The core index or all-items index excluding food and energy is an important indicator of true price trends as food and energy prices are volatile and impacted by extraneous factors. The core index was flat in July following an increase of 0.2% in June. Year-over-year, core prices were up 2.2%, down from 2.3% the previous month. Slowing core inflation may be an indication of some underlying economic weakness.
Monthly Inflation
The seasonally adjusted energy index fell 1.6% in July following 4 consecutive months of positive gains. The decline can mostly be attributed to a 4.7% monthly drop in the price of gas. On the other hand, the price of natural gas posted its largest monthly gain in over two years, up 3.1%.
Overall food prices were flat in July. The index for food at home slipped 0.1% but was balanced by a 0.2% increase in the index for food away from home. Food at home accounts for 13.7% of the overall CPI-U and food away from home is 5.7%. At the grocery store, meat prices fell 0.7% while the index for fruits and vegetables gained 0.3%. Prices were lower in four of the six major grocery store food indexes.
With seasonal adjustments, the index for all items less food and energy was up only 0.1% in July, slowing from 0.2% in each of the previous three months. Within this index, shelter prices climbed 0.2%, slowing from the previous three months. Medical care service costs grew 0.5% in July and the price of medical care commodities increased 1.1%. The index for used cars and trucks dropped 1% in July, adding to similar declines in recent months. The indexes for airfare, communication, and recreation all declined in July.
Seasonally Adjusted Monthly % Change in CPI-U by Category (2016)
| January | February | March | April | May | June | July |
| All Items | 0 | -0.2 | 0.1 | 0.4 | 0.2 | 0.2 | 0.0 |
| Food | 0 | 0.2 | -0.2 | 0.2 | -0.2 | -0.1 | 0.0 |
| Energy | -2.8 | -6.0 | 0.9 | 3.4 | 1.2 | 1.3 | -1.6 |
| Gasoline | -4.8 | -12.5 | 2.2 | 8.1 | 2.3 | 3.3 | -4.7 |
| Fuel Oil (non seasonally adjusted) | -6.5 | -2.9 | 1.7 | 1.9 | 6.2 | 3.7 | -1.5 |
| Electricity | -0.7 | -0.2 | 0.4 | -0.3 | -0.2 | -0.5 | 0.5 |
| Utilities (piped gas service) | -0.6 | 1.0 | -0.7 | 0.6 | 1.7 | -0.4 | 3.1 |
| Energy Services | -0.7 | 0.1 | 0.2 | -0.1 | 0.2 | -0.5 | 1.0 |
| All Items Less Food and Energy | 0.3 | 0.3 | 0.1 | 0.2 | 0.2 | 0.2 | 0.1 |
| Services Less Energy Services | 0.3 | 0.3 | 0.2 | 0.3 | 0.4 | 0.3 | 0.2 |
| Shelter | 0.3 | 0.3 | 0.2 | 0.3 | 0.4 | 0.3 | 0.2 |
| Transportation Services | 0.4 | 0.2 | 0.2 | 0.7 | 0.3 | 0.3 | -0.2 |
| Medical Care Services | 0.5 | 0.5 | 0.1 | 0.3 | 0.5 | 0.2 | 0.5 |
Annual Inflation
Food prices were only up 0.2% over the 12-months ending in July. The index for food at home declined 1.6%; the index for meat poultry fish and eggs dropped 5.6% and the index for dairy and related products fell 3.1%. However, the cost of food away from home grew 2.8% to temper the decline in overall food prices. The energy index fell 10.9% over the year ending in July. The index for energy commodities fell 19.4% including a 19.8% decline in gas prices. Over the same period, the index for energy services only declined 0.9%.
The core price index increased 2.2% year-over-year in July, following an annual gain of 2.3% in June. This includes a 3.3% annual increase in shelter costs as well as a 4.1% increase in the index for medical care services. The index for transportation services, which accounts for nearly 6% of the overall index, climbed 3% year-over-year, including a 6.3% jump in the price of motor vehicle insurance and a 4.6% decline in airline fares.
Inflation By Region
For the year ending in July, inflation was above the national average in larger cities; cities with populations over 1.5 million posted overall inflation of 1.1%, while those with populations between 0.5 and 1.5 million only recorded inflation of 0.4%. Inflation was also significantly higher in western urban areas compared to other regions. Large, western urban areas had 1.6% inflation over the year, twice the national average.
In July prices fell most drastically in the midwest. The midwest urban index dropped 0.5% and in Chicago prices fell 0.8% month over month. The south urban index also declined in July, down 0.2%. Month-over-month, prices fell more in smaller cities.
| Urban Population | 12-month | August |
| over 1.5 million | 1.3% | 0.1% |
| 50,000 to 1.5 million | 0.7% | 0.1% |
| under 50,000 | 0.8% | -0.1% |
| Urban Regions | 12-month | August |
| Northeast | 1.1% | 0.1% |
| Midwest | 0.6% | 0.1% |
| South | 1.0% | 0.1% |
| West | 1.6% | 0.1% |
Outlook for the Economy
The next FOMC meeting is on September 21st. According to the CME Group’s FedWatch tool, the markets are pricing in an 82% likelihood that the Federal Reserve will leave rates unchanged at this meeting. The same tool predicts that rates will remained unchanged throughout the year with a probability of just under 50%.
Given the unprecedented nature of the current low interest rate environment, policy may need to be adjusted. Policymakers are beginning to reconsider the central bank’s framework – which aims to maintain an annual inflation rate of 2%. According to John Williams, president of the Federal Reserve Bank of San Francisco:
“There is simply not enough room for central banks to cut interest rates in response to an economic downturn when both natural rates and inflation are very low. [A higher inflation target] would imply a higher average level of interest rates and thereby give monetary policy more room to manoeuvre”.
by Emily Cross Leon | Jul 21, 2016 | Definitions
According to the BLS’s monthly inflation report, consumer prices climbed 0.3% in June, down slightly from 0.4% in May. However, with seasonal adjustments, inflation was 0.2% in both May and June. For the year ending in June, inflation was 1%, in-line with the year ending in May. Expectations had been for marginally higher numbers in June. Overall, inflation appears steady but sluggish and remains stubbornly below the Fed’s 2% target.
Much of the volatility in the CPI reflects volatility in the price of gas. The positive trend in the core index over the past 18 months is driven by steady growth in the price of housing and cost of services. The special aggregate index for services encompasses about 63% of the items in the all-items index and was up 2.8% year-over-year in June. The remainder of the items in the CPI are categorized as commodities. The special aggregate index for commodities declined 2.0% over that period.
(source: advisorperspectives.com)
The core or all-items index excluding food and energy (two sectors with volatile prices that may not reflect true underlying economic strength) climbed 0.2% in June for the third month in a row. This measure of core inflation points to some underlying price pressure and is a positive sign for the US economy. Year-over-year, core prices were up 2.3%, significantly higher than the 10-year annual average core rate of 1.9% and above the 2% target.
Monthly Inflation
Much of the inflation in June can be attributed to a 4.4% (non-seasonally adjusted) monthly rise in gasoline prices. Shelter and transportation prices also pushed higher. Shelter prices were up 0.3%, with both the rent index and the owners equivalent of rent index up by that same amount. The transportation services index was up 0.3% in June because of a 3.2% spike in rental car prices. In May the rental car index was up 4.8%.
Overall food prices were down 0.1% with seasonal adjustments in June. The index for food at home fell 0.3% while food away from home climbed 0.2%. Declines in the index for meat, poultry, fish and eggs and the index for dairy and dairy related products, down 0.7% and 0.3% respectively, impacted prices at the grocery store.
Seasonally Adjusted Monthly % Change in CPI-U by Category (2016)
| January | February | March | April | May | June | July |
| All Items | 0 | -0.2 | 0.1 | 0.4 | 0.2 | 0.2 | 0.0 |
| Food | 0 | 0.2 | -0.2 | 0.2 | -0.2 | -0.1 | 0.0 |
| Energy | -2.8 | -6.0 | 0.9 | 3.4 | 1.2 | 1.3 | -1.6 |
| Gasoline | -4.8 | -12.5 | 2.2 | 8.1 | 2.3 | 3.3 | -4.7 |
| Fuel Oil (non seasonally adjusted) | -6.5 | -2.9 | 1.7 | 1.9 | 6.2 | 3.7 | -1.5 |
| Electricity | -0.7 | -0.2 | 0.4 | -0.3 | -0.2 | -0.5 | 0.5 |
| Utilities (piped gas service) | -0.6 | 1.0 | -0.7 | 0.6 | 1.7 | -0.4 | 3.1 |
| Energy Services | -0.7 | 0.1 | 0.2 | -0.1 | 0.2 | -0.5 | 1.0 |
| All Items Less Food and Energy | 0.3 | 0.3 | 0.1 | 0.2 | 0.2 | 0.2 | 0.1 |
| Services Less Energy Services | 0.3 | 0.3 | 0.2 | 0.3 | 0.4 | 0.3 | 0.2 |
| Shelter | 0.3 | 0.3 | 0.2 | 0.3 | 0.4 | 0.3 | 0.2 |
| Transportation Services | 0.4 | 0.2 | 0.2 | 0.7 | 0.3 | 0.3 | -0.2 |
| Medical Care Services | 0.5 | 0.5 | 0.1 | 0.3 | 0.5 | 0.2 | 0.5 |
Apparel prices dropped a seasonally adjusted 0.4% in June after jumping 0.8% in May. The index for used cars and trucks, which accounts for over 2% of the all items index, declined by 1.1% in June, adding to May’s 1.3% decline.
Annual Inflation
The annual 1% inflation rate for the year ending in June was largely due to growing prices for shelter and medical care. The shelter index increased 3.5% year-over-year as the price of moving, storage and freight climbed 12.1%. Rent of shelter, which accounts for nearly a third of the all-items index, was a major contributor to inflation for the year ending in June. The rent index was up 3.8% year-over-year, while the index for owner’s equivalent of rent was up a similar 3.2%.
Medical care service prices increased 3.8% over 12-months and were bolstered by higher prices for health insurance and hospital services. The indexes for food and apparel were also marginally higher for the year, gaining 0.3% and 0.4% respectively. Within the food index, prices for food at home declined an annual 1.3%, with declines in four of the six grocery store indexes. The price of meat, fish, poultry and eggs fell 5.0% over the year ending in June. Meanwhile, the index for food away from home gained an annual 2.6%
Over the same period, the energy index declined 9.4%, including drops of 15.3% in energy commodity prices and 2.5% in energy service prices. The 15.4% decline in gas prices, which represents around 3.3% of the CPI and close to half of the energy index, was a major factor impacting inflation over the year.
Inflation By Region
June inflation was higher in western cities at 0.6% compared to the national average of 0.3%. Year-over-year, inflation was concentrated in larger western cities. The index for western urban centres with populations over 1.5 million was twice the national average at 2%. In San Francisco, consumer prices climbed 2.7% over the year.
| Urban Population | 12-month | August |
| over 1.5 million | 1.3% | 0.1% |
| 50,000 to 1.5 million | 0.7% | 0.1% |
| under 50,000 | 0.8% | -0.1% |
| Urban Regions | 12-month | August |
| Northeast | 1.1% | 0.1% |
| Midwest | 0.6% | 0.1% |
| South | 1.0% | 0.1% |
| West | 1.6% | 0.1% |
Outlook for the Economy
The US economy appears to be strengthening, especially when compared to much of the world where volatility is high. The US dollar is rallying in anticipation of a rate hike before the end of the year. According to the CME Group’s FedWatch tool, the markets are pricing in a probability of about 50% that the Federal Reserve will raise interest rates before year-end.
Given today’s economic climate of low but stabelizing commodity prices; slow global growth with high levels of uncertainty; and a strengthening currency deflating the price of imports, near term inflation will probably not accelerate quickly, if at all. It will have to come from growth in employment. This will stimulate housing prices and increase consumer demand while higher wages will be passed along to consumers in the form of higher prices.

