-v3")
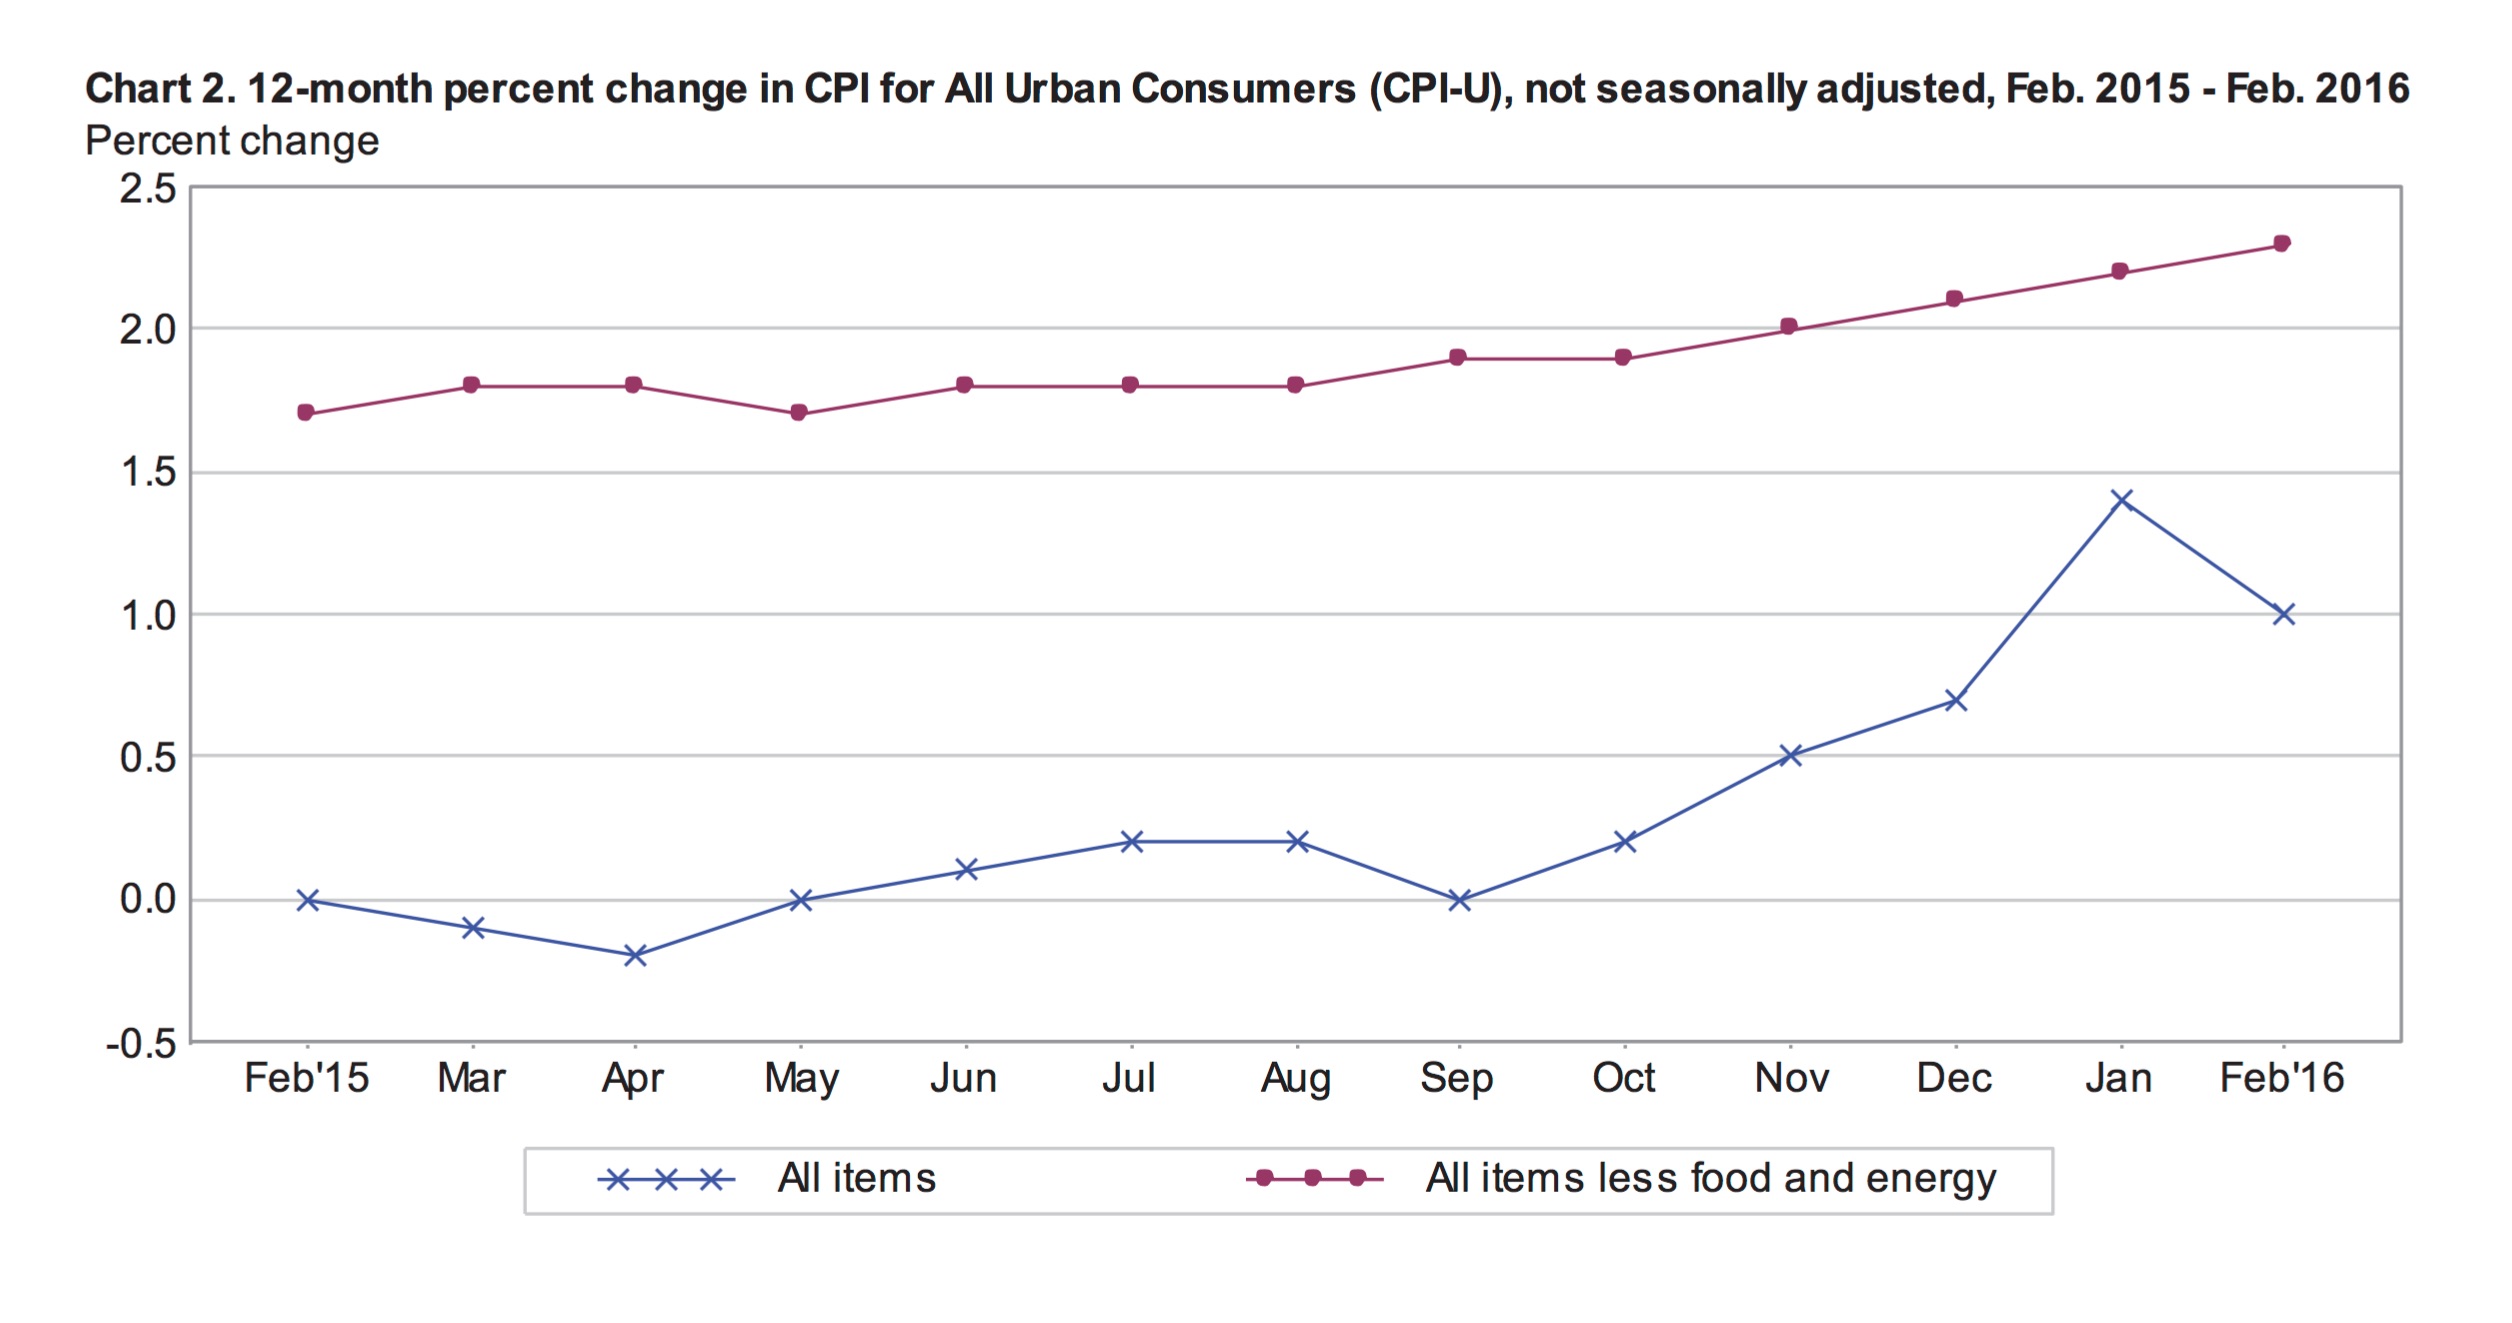
Headline inflation, measured by the Consumer Price Index for all Urban Consumers (CPI-U), was 1% for the year ending in February compared with 1.4% for the year ending in January. Prior to seasonal adjustments, consumer prices were reportedly up 0.1% in February and 0.2% in January. On a seasonally adjusted basis, the CPI-U fell 0.2% in February and was flat in January.
Today’s inflation report from the BLS was slightly stronger than expected. Gas prices plummeted 13% throughout the month to easily offset price pressure in other components of consumer spending such as rent and medical care. Stripping out the impact of declining energy prices, the index for all items less energy increased an annual 2.1% and climbed 0.3% in February with monthly seasonal adjustments. Core inflation (which eliminates both food and energy) was 0.3% for the month, marginally higher than the market’s forecast of 0.2%. Core prices appear to be gaining momentum.
Seasonally Adjusted Prices in February
February’s 13% decline in the cost of gasoline led to a 6% decline in the energy index. The energy index, which accounts for about 6.7% of total consumer spending, declined 2.8% in January. The cost of energy services was up 0.1% in February following two monthly declines of 0.7%. The price of utility services (piped gas) was significantly higher (1%) for the month following 5 months of consecutive declines. The transportation index slid 2.5% in February. The prices of new and used cars and trucks were higher while the index for motor vehicle parts and equipment slid 0.1%.
Seasonally Adjusted Monthly % Change in CPI-U by Category (2016)
| January | February | March | April | May | June | July | |
|---|---|---|---|---|---|---|---|
| All Items | 0 | -0.2 | 0.1 | 0.4 | 0.2 | 0.2 | 0.0 |
| Food | 0 | 0.2 | -0.2 | 0.2 | -0.2 | -0.1 | 0.0 |
| Energy | -2.8 | -6.0 | 0.9 | 3.4 | 1.2 | 1.3 | -1.6 |
| Gasoline | -4.8 | -12.5 | 2.2 | 8.1 | 2.3 | 3.3 | -4.7 |
| Fuel Oil (non seasonally adjusted) | -6.5 | -2.9 | 1.7 | 1.9 | 6.2 | 3.7 | -1.5 |
| Electricity | -0.7 | -0.2 | 0.4 | -0.3 | -0.2 | -0.5 | 0.5 |
| Utilities (piped gas service) | -0.6 | 1.0 | -0.7 | 0.6 | 1.7 | -0.4 | 3.1 |
| Energy Services | -0.7 | 0.1 | 0.2 | -0.1 | 0.2 | -0.5 | 1.0 |
| All Items Less Food and Energy | 0.3 | 0.3 | 0.1 | 0.2 | 0.2 | 0.2 | 0.1 |
| Services Less Energy Services | 0.3 | 0.3 | 0.2 | 0.3 | 0.4 | 0.3 | 0.2 |
| Shelter | 0.3 | 0.3 | 0.2 | 0.3 | 0.4 | 0.3 | 0.2 |
| Transportation Services | 0.4 | 0.2 | 0.2 | 0.7 | 0.3 | 0.3 | -0.2 |
| Medical Care Services | 0.5 | 0.5 | 0.1 | 0.3 | 0.5 | 0.2 | 0.5 |
Every other major component of the CPI-U was higher in February after seasonal adjustments. The largest positive change was a 1.6% monthly increase in the price of apparel, which was also up 0.6% in January following 4 months of declines. In February, prices were mixed within the apparel sector with major moves in the prices for jewelry and watches, up 3.2% and 8.9% respectively.
The cost of food was 0.2% higher in February including a 0.1% increase in the cost of food away from home and 0.2% increase in the price of food at home. Notable hikes at the grocery store include the price of fresh whole chicken, up 2.2% for the month and fresh fruit, up 2.3%. At the same time, the index for bacon and related products was down 3.1% in February. The overall cost of meat declined for the third consecutive month, down 0.2%.
Shelter costs, which account for about one third of the overall price index, were 0.3% higher in February. Hotel costs and moving costs are included in the shelter index and were up 1% and 3.1% respectively. The index for household furnishing and supplies slipped 0.2% in February compared with a decline of 0.1% in January.
The medical care index was up 0.5% in February, matching January’s growth rate. The index for medical care commodities rose 0.6% in February following an increase of 0.4% in January. Higher medical commodity prices were impacted by a 1.1% monthly spike in the price of medicinal drugs. The medical care services index increased by 0.5% in February, in line with January. Health insurance was reportedly 1.3% more expensive in February following a price increase of 1.1% in January.
12-Month Inflation
Overall prices grew by 1% over the 12-months ending in February, well below both the Fed’s target inflation rate of 2% and January’s 12-month inflation rate of 1.4%. While commodity prices fell 1.6% year over year in February, the overall cost of services was up 2.6%.
Food prices rose 0.9% despite an annual decline in the cost of food at home, down 0.3%. For the year ending in February, the price of meat fell 4.8% and milk prices were down 5%, while eggs were 6% more expensive. Apples and tomatoes posted sharp gains, up 7.9% and 10.8% respectively. The index for food away from home was up 2.6% year over year, led by higher costs for food at schools
Overall medical care costs were 3.4% higher for the year. Medical services were up 3.9%, including 5.1% higher prices for hospital service costs. The transportation index fell 3.4% year over year despite a 5.1% climb in the index for motor vehicle insurance. A 12.5% annual decline in the energy index includes a 32.1% decline in the cost of fuel oil and a 20.7% decline in the price of gas.
Across the Country
For the year ending in February, large west cost cities experienced higher inflation than the rest of the country. LA and San Francisco posted annual inflation rates of 2.4% and 3.0% respectively and prices in Seattle were up 2.2%. Prices were up 0.7% in cities in the northeast, and only 0.4% in the midwest.
In February, the northeast posted 0.2% higher prices, above the national average. Prices in the midwest were reportedly flat for the month and larger urban areas in this region saw monthly declines. In Chicago, prices fell 0.2% in February.
Outlook for the Fed
Stronger than expected underlying price pressures, as indicated by February’s core monthly inflation, will support the Federal Reserve’s intention to continue increasing interest rates. While they are not likely to move rates today, the likelihood of a second rate hike in the first half of the year is growing. A strong US dollar and cheap energy has quelled inflation but these factors may be temporary. Momentum in the prices of shelter and medical care point to underlying economic strength.


Emily is a Canadian financial blogger with multiple degrees in economics and extensive professional experience as a financial analyst. She was formerly a Ph.D. candidate at the University of Guelph's School of Agricultural Economics. Before that, she received an MA from the University of San Francisco in International Development Economics. She also has a BA in Math with a minor in Economics.
