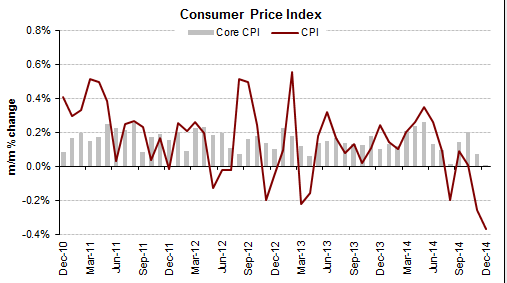
Friday’s December CPI report from the Department of Labor gave us a headline figure of -0.4% from the November reading. The drop in the most widely-cited inflation gauge was right in line with consensus estimates, although the core CPI (-ex food and energy) was slightly below consensus expectations, coming in flat from the prior month. Economists were hoping to see a slight tick up of 0.1% in December on non-food and non-energy price components.
The year-over-year change in headline CPI now stands at a paltry (or at best, “tame”) 0.8%, largely due to the relentless selloff in crude oil & energy prices in the past six months. The aggregate energy index component of the CPI – which makes up about 8.5% of the total headline figure – fell the most since late 2008 last month, dropping 4.7% on a seasonally-adjust basis.
Looking further into the energy index, gasoline continues to give most Americans a de facto tax break, with gas prices falling a stunning 9.4% last month alone, and over 21% in the past twelve months.
Given the lag time between crude and refined products like gasoline, and the continued selloff in core energy commodities, we can fully expect to see this downward pressure on inflation data for the next few months at minimum.
A minor amelioration to the deflationary aspects of energy is the rise in food costs, which were up 0.3% last month after a 0.2% rise in November. The food index is now up 3.4% year over year, but the total net effect of the commonly removed items of food and energy is still a net drag on overall inflation.
Looking at other components of core CPI, medical care costs rose 0.5% in December with a 0.9% rise in pharmaceutical costs. Apparel costs fell 1.2%, while air travel costs fell a sharp 5.0%:
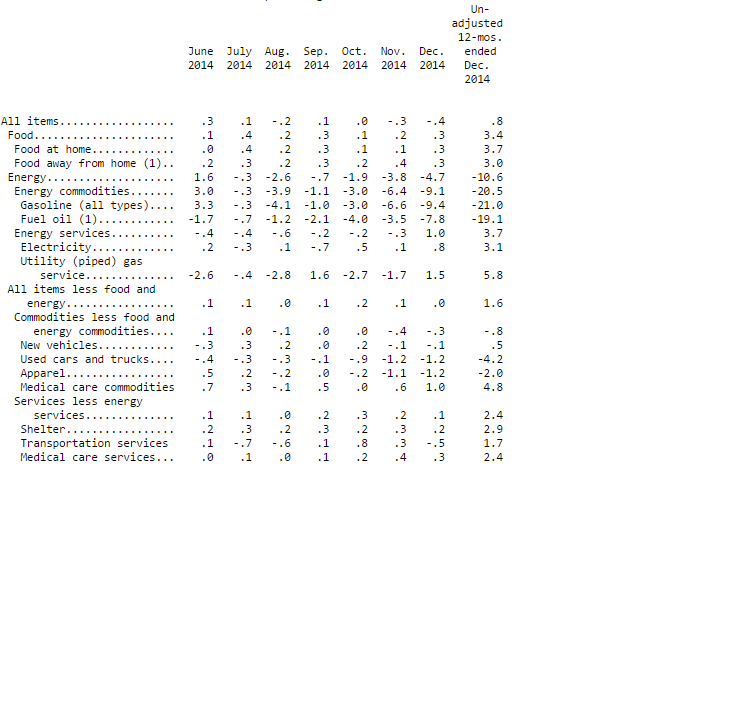
Source: Bureau of Labor Statistics
What Today Means for Fed-Speak and Interest Rates
Regardless of your stance on whether they should be, the fact is that the Fed is looking around the globe right now, and taking many things into account when deciding the optimal time to begin raising short-term interest rates.
Last month we showed the distribution charts for how the big money was betting on the matter; at the time the consensus was for a rate hike in July or September 2015. Today’s CPI data points – following the similarly-tracking PPI from yesterday, which was down 0.3%, the most since 2011 – are starting to convince people that the late summer timeline could be way off. We may, in fact, see no rate increases in 2015 at all.
Courtesy of: Haver Analytics
Because at present, we aren’t just tracking a little bit below the Fed’s target of 2% core inflation – we are well below it. And that’s assuming the Fed really does want to exclude the food and energy components entirely – which to their credit is precisely what they did when those components were volatile to the upside a few years ago.
But the massive deflationary force of today’s energy commodities, combined with a surging U.S. dollar and very real deflationary fears in Europe, Japan, and even China, has really got the Fed and investors on their toes.
There won’t be a press conference today from Janet Yellen to discuss recent economic indicators, but San Francisco Fed Chair John Williams (a new addition to the FOMC this year and a relative interest rate dove) will likely make some public comments on the rate outlook, vague as they may appear in print.
We expect him to use the opportunity of today’s weak inflation data to enter some more ambiguity into the rate hike discussion, hoping to push the market towards more of a stance of “maybe 2015, maybe not”.
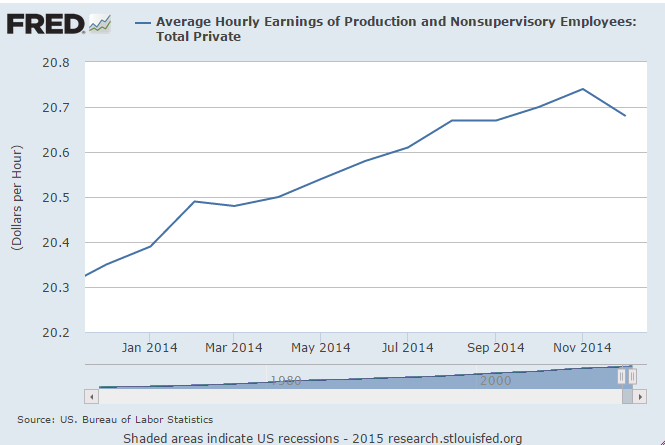
While the CPI is certainly a vital statistic, we’ve been told by Fed officials – and Fed Chair Yellen herself – that the indicators they’re studying the most right now are the Personal Consumption Expenditures and the Average Hourly Earnings gauges. The latter has actually been tracking slightly negative in recent months, contradicting the headline jobs figures (which show sustained growth) and the drop in the unemployment rate. Real average hourly earnings as reported this morning were up just a hair, but actually down nominally. Average earnings fell slightly, but the net effect of headline deflation last month means that technically, folks have a few more pennies’ worth of purchasing power.
What Today Means For Investors
If investors have just been looking at sovereign debt markets the past few weeks, they may claim that the deflationary effect has been staring us all right in the face. The yield curve continues to flatten; the benchmark 10 year was trading at a yield of 1.746% early Friday, while the 5 year traded at 1.231% and the 2 year note offered a miniscule 0.463% yield.
Given the spread between 10’s and 2’s, we can actually expect to see – and I can’t believe I’m saying this – more flattening on the long end, i.e. even lower rates. So at least in the short-term, this once in a generation bull market in treasuries doesn’t appear to have an end date.
Stock market futures rose modestly higher after the 8:30 a.m. CPI release, as the prospect of “lower rates for longer” could, in a bubble, set up well for equities. But the deflation argument is gathering steam and could be an asset value killer all around. While the drop in crude can very justifiably be all about supply issues, the recent and sharp drop in copper is a different story. It’s a crucial base industrial metal that seems to have no price support right now, even after having its biggest one-day decline in six years earlier this week.
With so many muddled currents swirling around the geopolitical financial landscape right now, the onus is really on us as investors and analysts to find truly applicable data sets. We here continue to promote an objective discussion of the real price pressures in the global economy, and to that end we’ll be exploring different ways of examining data points and asset class potential.


Ryan is a financial analyst & forecaster. He has 20 years of experience in asset modeling, investment analysis/general dd, portfolio management, and macroeconomic analysis. To that end, he has worked extensively with equities, fixed income, commodities, private equity, currencies, and derivative products. His commentary and educational library appear on Investopedia.com, and analysis has appeared in Barron’s, WSJ.com, TheStreet.com, and Forbes.com.