-v3")
Inflation seemingly took a breath in March. According to Friday’s report from the Bureau of Labor Statistics, prices climbed 2.4% over the 12-months ending in March. Markets had expected an annual rate of 2.6% after February’s five-year peak at 2.7%. For the month, consumer prices inched up 0.1% in March. However, with seasonal adjustments the CPI-U posted a 0.3% decline, the largest one month drop since January 2015, when the all items index fell 0.6% with seasonal adjustments. Only two month ago, monthly inflation was at its highest level since February 2013.
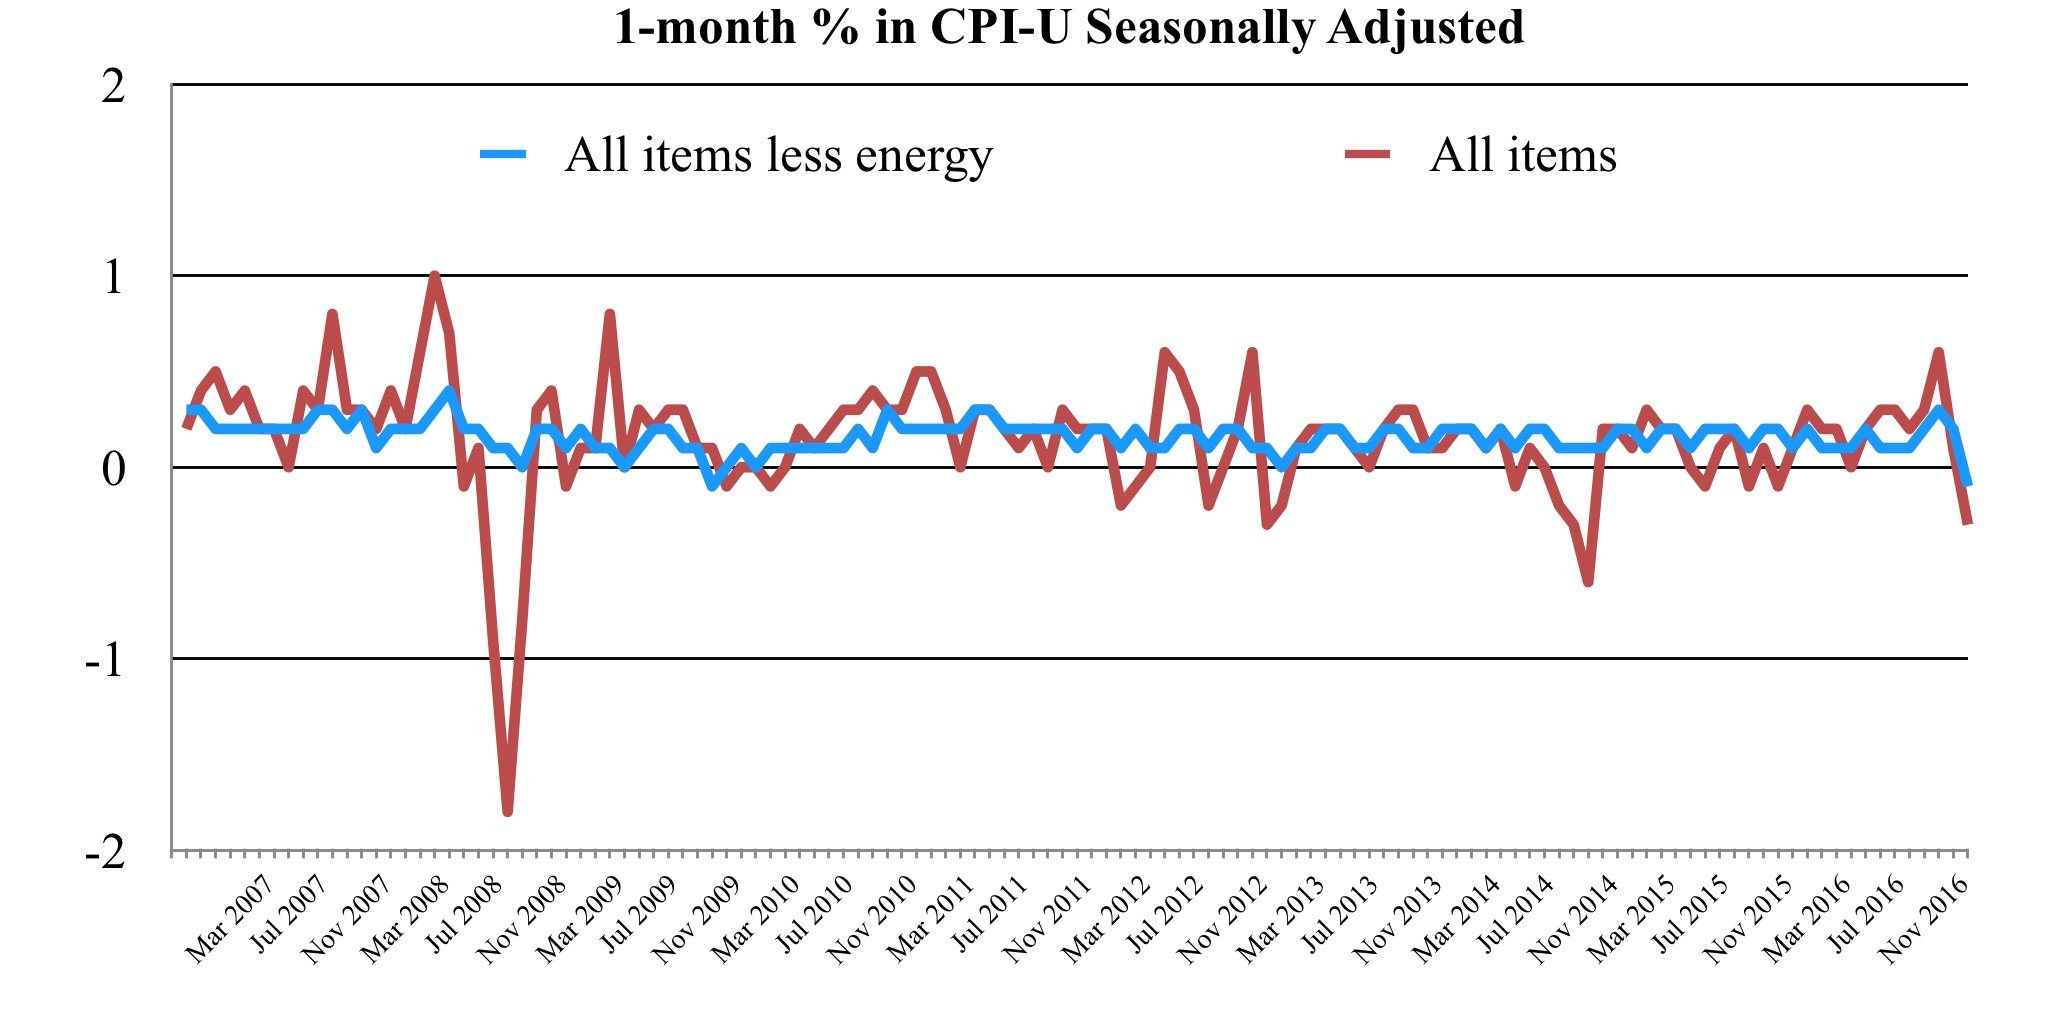
Whether the decline in March represents a temporary blip on the radar or true underlying economic weakness remains to be seen. It is worth noting that when energy is excluded, the CPI-U has grown at a relatively stable rate over the past decade (represented by the blue line in the chart above). Gasoline represents roughly 3.3% of the CPI-U and half of the energy index; it has increased in price by nearly 20% over the past year, despite a 6.2% decline in March. Extreme volatility in the energy index, has been, and continues to be the dominant force impacting headline monthly inflation. Interestingly, March’s monthly decline (excluding energy) is the sharpest in the past 10 years.
March Monthly Prices
Core prices (excluding food and energy) dropped 0.1% with seasonal adjustments in March, after increasing 0.2% in February. March was the first month that seasonally adjusted core inflation dropped below zero since January 2010. Outside of the core index, food prices climbed 0.3% to more than offset a larger decline in the energy index, which fell 3.2%. Food accounts for around 14% of the all-items index, nearly twice the weight of energy.
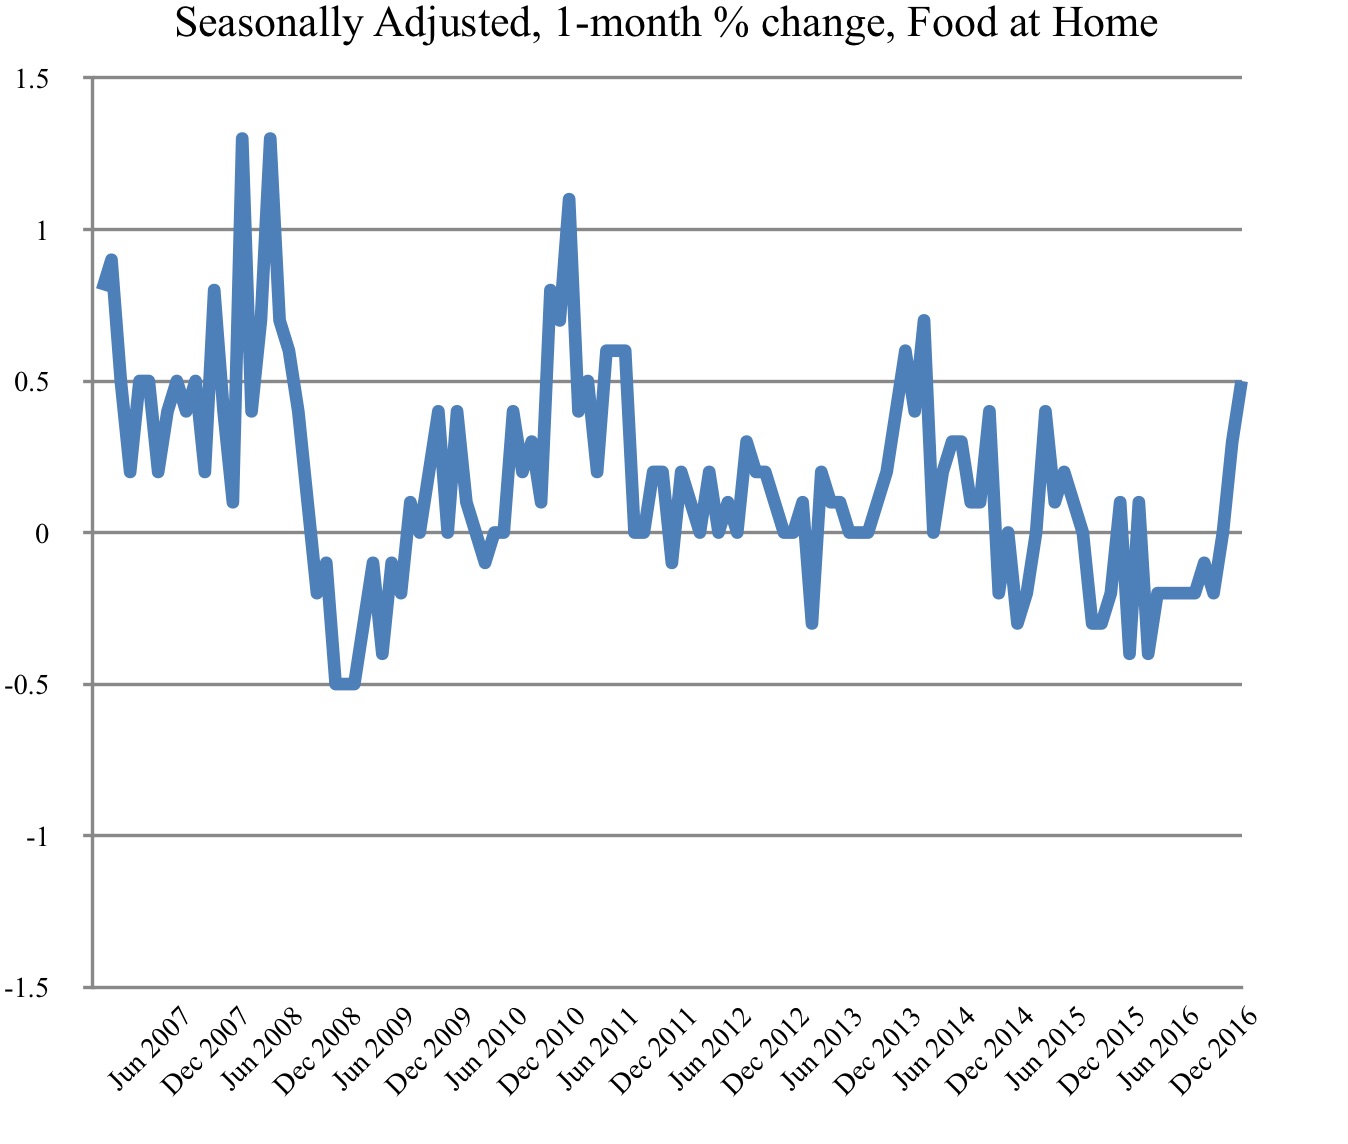
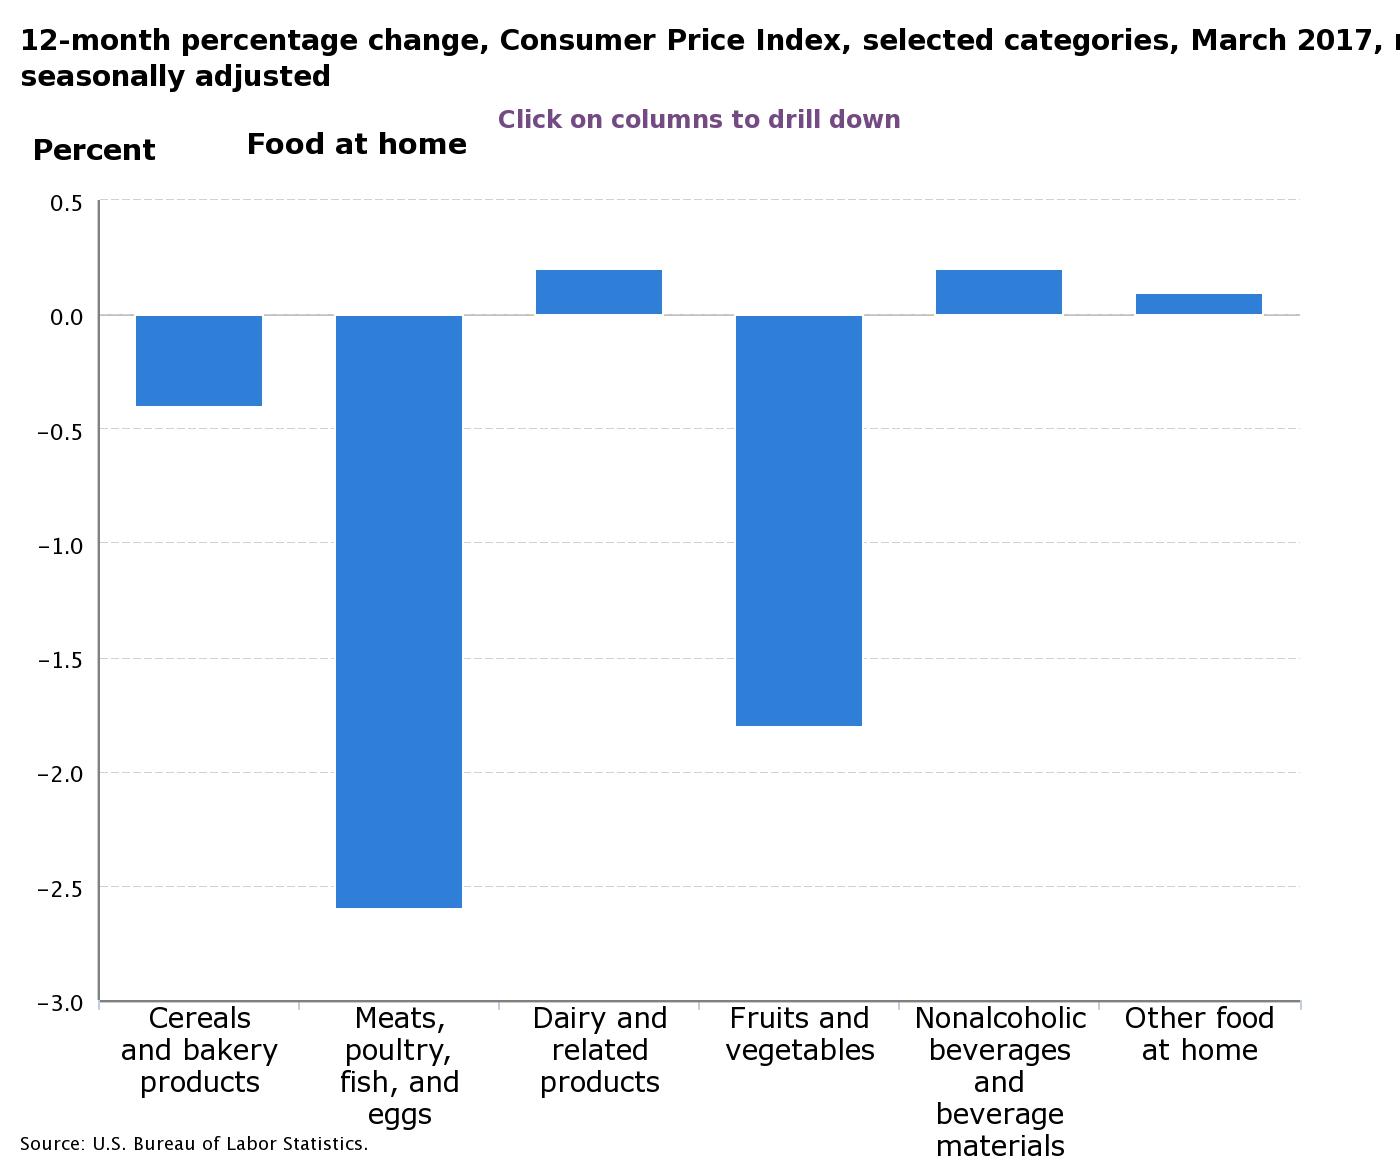
Grocery store prices were up 0.5% in March. Prices were higher in four of the six major grocery store components; the index for other food at home slipped 0.1% and the index for dairy and related products fell 0.6%. The chart below illustrates the volatility of food prices since 2007; even with seasonal adjustments this index fluctuates drastically each month. Since 2014, the index for food at home has posted more months of declines than growth. In recent months, grocery store prices have clearly spiked.
Within the core index, shelter is by far the largest component of consumer spending. The index for shelter added 0.1% in March and 0.3% in February with seasonal adjustments. The price of medical care services was also up 0.1% in March; higher costs for hospital services (up 0.3%) were offset by lower costs for physician services (down 0.4%). The seasonally adjusted price of new vehicles fell for the second month in March, down 0.3% compared to 0.2% in February. Similarly, the index for used cars and trucks fell 0.9% in February adding to declines in both January and February.
Annual Inflation
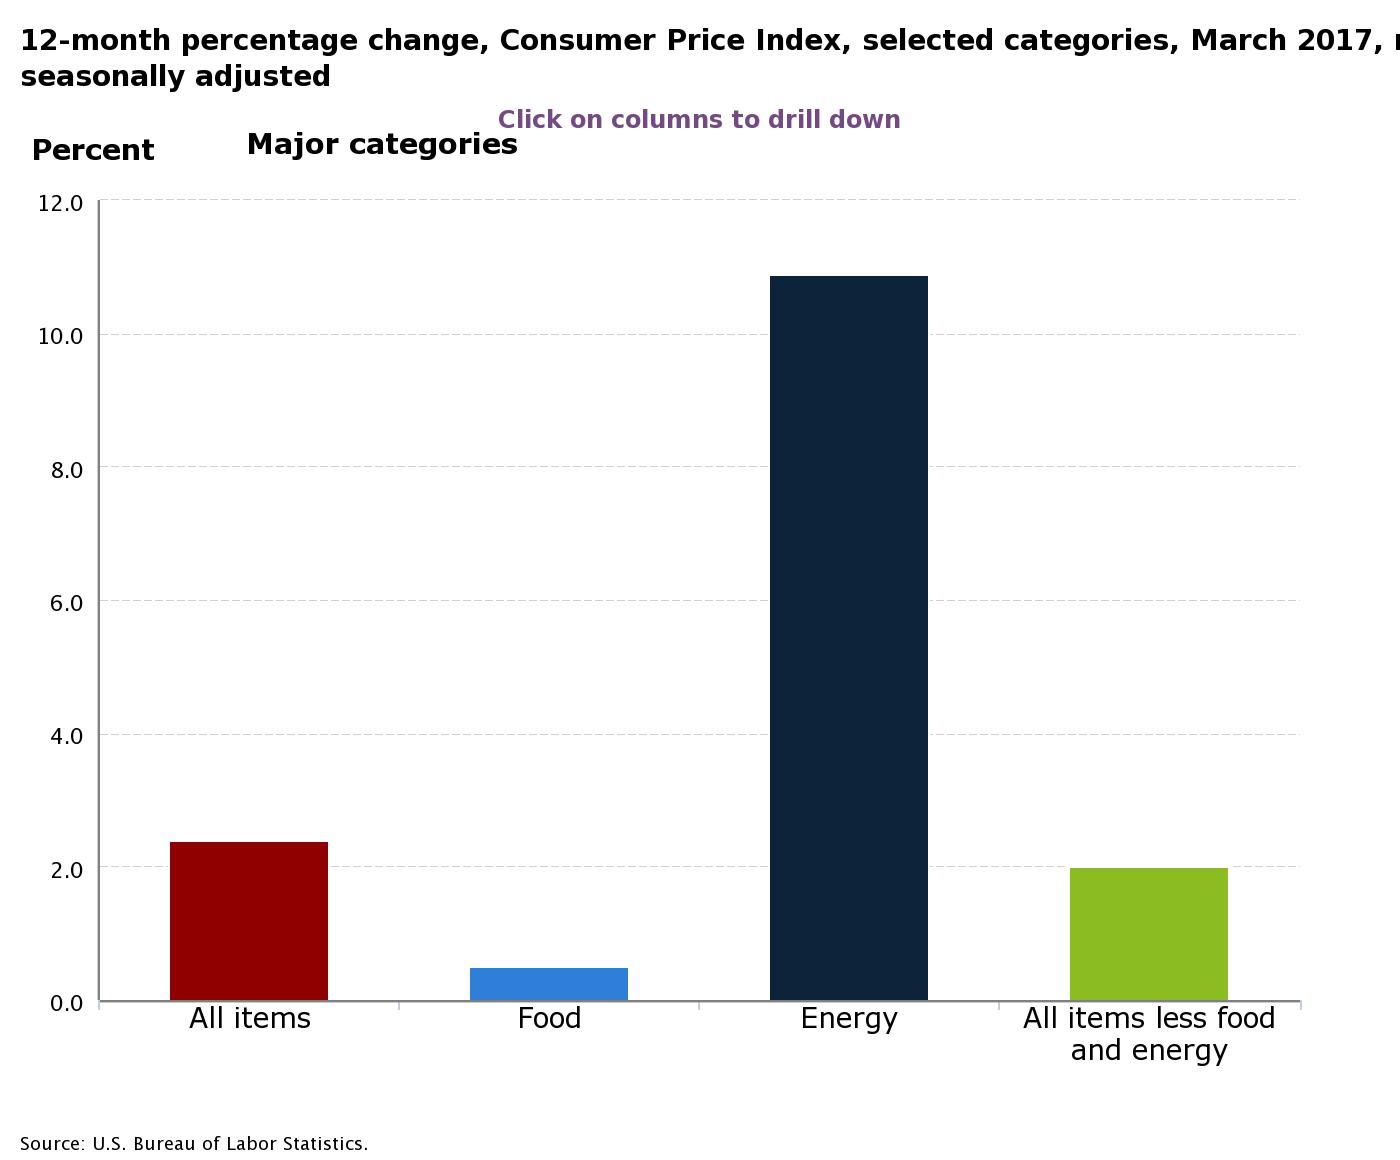
Core prices climbed 2.0% year-over-year in March, slightly less than the all items index. Meanwhile, energy prices shot up 10.9% as energy commodities (mostly gasoline) surged 19.8% and energy services were up a more modest 3.4% annually. The food index inched up 0.5% over the 12-months ending in March. Grocery store prices fell 0.9% over the year, but this was offset by higher prices for food away from home; that index climbed an annual 2.4%.
Core commodity prices (commodities less food and energy commodities) slumped over the year ending in March, down 0.6%. This includes a 4.7% decline in the index for used cars and trucks. Apparel prices were up just 0.6% year-over-year. On the other hand, the medical care commodities index posted a 3.9% increase.
Over the year, the price of shelter rose 3.5%. Shelter is categorized as a service and service prices were up overall on an annual basis in March. The transportation and medical care service indexes were both higher, up 3.8% and 3.4% respectively. Within the transportation services index, motor vehicle insurance prices jumped 8.0% compared to a year earlier. However, declines in the price of wireless telephone services were the largest on record. That index fell 11.4% year-over-year.
Economic Outlook
The Fed has increasingly expressed their intention to continue raising interest rates, citing positive economic news and burgeoning inflation. The Fed aims to maintain an annual inflation rate close to 2% and they are generally more interested in the core index. When prices are rising faster than their target, higher interest rates prevent the economy from overheating. On the other hand, sluggish inflation is a sign of weak consumer demand and discourages current investment. Friday’s negative report may force the fed to reconsider the pace of rate hikes going forward. Inflation is not the Fed’s only mandate, they also aim to maintain stable and full employment.


Emily is a Canadian financial blogger with multiple degrees in economics and extensive professional experience as a financial analyst. She was formerly a Ph.D. candidate at the University of Guelph's School of Agricultural Economics. Before that, she received an MA from the University of San Francisco in International Development Economics. She also has a BA in Math with a minor in Economics.
