
November CPI Signals Tepid U.S. Inflation
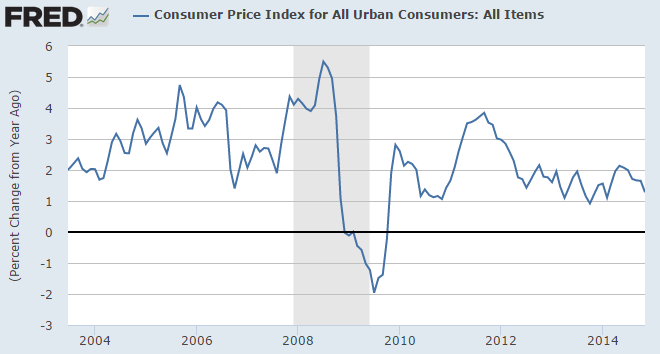
This morning we saw the November CPI print a headline figure down 0.3% on a seasonably-adjusted basis, a sharper drop than the expected decline of 0.1%. It also reached a 10 month low of 1.3% as an annualized inflation rate. The Bureau of Labor Statistics release was nominally the biggest drop in 6 years, as plummeting crude oil and energy costs outweighed small rises in other indexes like housing and healthcare.
10 year historical
Ex-food and energy, the “core” CPI rose 0.1% in November, in line with expectations, and is currently running on a 1.7% annual pace. The two components are typically removed from most long-term inflation assessments for their volatility, and this is true now more than at any time since 2008. But they combine to make up over 23% of the total CPI calculation, so they cannot be swiped off the table by any means.
The energy index component of the CPI posted its largest monthly decline since 2008, a drop of 3.8%, while the trailing 12 month drop is over 10% across the energy commodity index. Economists expect this cost to continue plummeting for consumers, and this was the fifth straight month of declines on the back of crude oil spot prices that are down 50%+ across the globe. Gas prices were down a sharp 6.6% in the month as measured by the BLS.
Indexes for housing, healthcare, airfares, and alcoholic beverages rose in November, while the indexes for apparel, new & used autos, recreation, and consumer personal care products all declined.
The Chain-Weighted CPI fell slightly in November, to 236.151.
Market Reaction Muted
S&P futures stayed mainly in line after the release of the report, going from 12-16 points positive to just under 9 points after the report. And in early trading, U.S. equity indices were broadly higher as investors and analysts looked to bottom-fish the recent selloff during what is historically one of the best single trading weeks of the year.
The effect of the CPI on equity and fixed income markets is hard to parse out today as there is so much going on geopolitically; Russia continues to do whatever it can to stabilize the ruble, while astonishing news is coming out regarding new trade liberalization talks with Cuba.
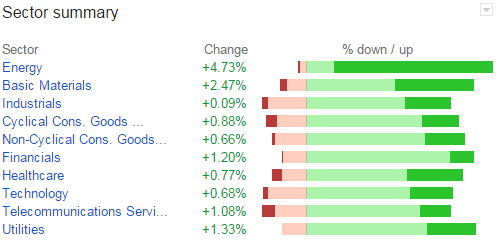
Treasury markets sold off a bit across the curve, as investors felt confident that the Fed would remain measured in their approach to monetary policy tightening. Risk appetites were up, as evidenced by some stabs being taken at buying up energy stocks:
All eyes now move forward in the day to Janet Yellen and the FOMC, which are wrapping up their last sit-down of the year followed by the announcement of their near-term forecast at 2 p.m. EST. There will also be a press conference by Chair Yellen at 2:30 p.m.
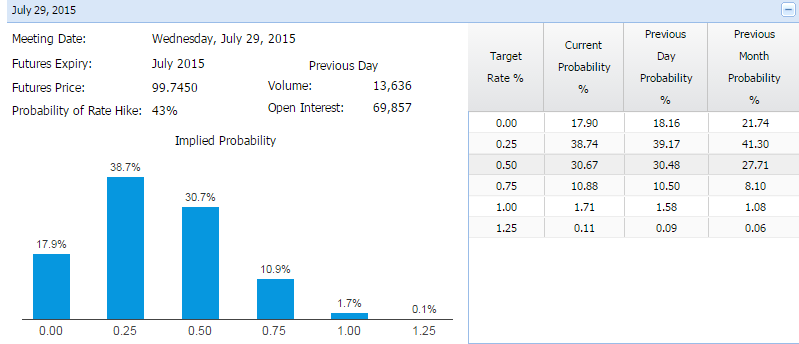
The broad expectation prior to this morning’s CPI release was that the Fed removes the “considerable period of time” language in its telegraphing ritual. Janet Yellen and company want to signal to the market that a future rate hike could be right around the corner, although the last look at the Fed Funds futures curves still indicate that we shouldn’t expect a hike before the second quarter (July) of 2015.
(screenshot courtesy of the CME Group)
What Today Means For Fed-Speak and Rates
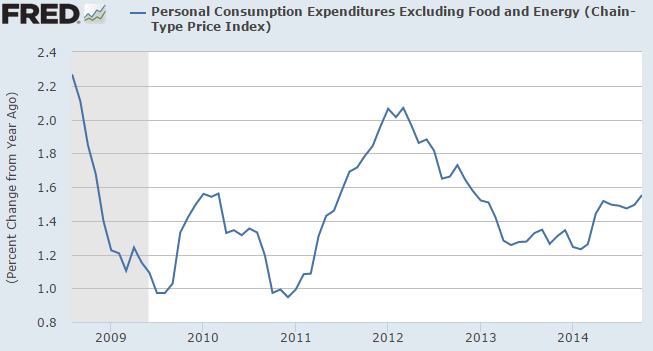
Today’s CPI drop comes after three straight months of 1.7% annualized rates. All in all, we don’t see much change the overall storyline that the United States is running well below the Fed’s target rate of 2% inflation. And this 2% is already a “readjustment” to the new global norm of low, low interest rates. Also, the Fed’s generally preferred inflation indicator – the PCE – is running at or below even the piddly price growth we’re seeing in the CPI.
There is also a lower level of inflation going on in hourly wages than in the CPI; Ms. Yellen has touched on this metric repeatedly as a sign that there is still a lot of slack in the labor market.
But this morning’s report of a 0.6% monthly rise in real average hourly earnings – the largest rise in about six years – all but assures that the FOMC will indeed position their language so that markets are ready for rate hikes in 2015. This economy is just running too smoothly to continue neglecting the work that needs doing to normalize U.S. interest rate policy.
Future Outlook
We can expect to see the effect of ever-lower energy prices begin to slowly creep into the price levels of non-energy index components. The savings will pass through the PPI and wholesale level, then on to the consumer starting in 2015.
This is a trend that will continue for some time, as this data set is already looking into the rearview, while crude futures continue to slide by the day. So even if we’re looking at the core CPI number with energy taken out, it should not be surprising to see 1.5% run-rate clips for a little while.
The Fed will likely look through the current volatility in crude oil as a “one-off”, much like they did in 2011 when many commodities spiked higher and there was a fear among some of a spike in inflation. It didn’t happen then. The one-off we see now in energy is a deflationary event, which is potentially more dangerous as we are already in a zero rate environment.
With GDP predicted to rise a healthy 2.9% next year and slack quickly evaporating from the labor market, the Fed has all the cover in the world to raise rates. Our best guess is that Yellen will remove the “considerable period” language – a hawkish move – then look to the press conference to reiterate previously stated concerns about deflationary pressures coming from other areas around the globe.