
Financial commentary and analysis is usually heavily peppered with “since Lehman” or “Post-Lehman” comparison statistics and conjecture. 2008 were some of the darkest days ever for financial markets; the losses worldwide were truly staggering and we are still wrestling with the consequences of this epic event to this day.
The world has changed a great deal since Lehman closed its doors – the financial world in particular has changed. The policy response from governments and monetary authorities around the world were amongst the most aggressive monetary policy moves of the modern era. As a result, we are now living in the midst of a giant financial experiment with all the theories, uncertainty, fear, greed and hope associated with finance jostling for equilibrium.
The Federal Reserve and other central banks throughout the world have been engaged in loose monetary policy, quantitative easing, ZIRP, and NIRP without issue despite the dire warnings of opponents who see the surge in the money supply as the precursor to rampant inflation and a hyperinflationary currency collapse. These fears for the most part have not transpired. Inflation has remained subdued through this period, and a lot of head scratching has ensued.
We are in uncharted territory, but there can be no argument about some of the major economic themes that have transpired “Post-Lehman” – the most astounding of which has been a complete collapse in the velocity of money throughout the economy. This metric above all others, helps explain why the expansionary monetary policy regimes throughout the world have managed to avoid triggering bouts of high inflation. The low velocity of money statistics also reveal just how fractured the economic recovery has been in the United States – where the exuberant valuation levels of financial markets are not borne out by developments in the real economy.
What is the velocity of money?
The velocity of money refers to how fast money circulates within the economy from one person to the next. Velocity of money is an important tool for gauging the rate at which money within the economy is used for purchasing goods and services. Analysts will often take the velocity of money as part of their consideration when determining how well the overall economy is performing. A high velocity of money indicates an active economy, and by consequence, is likely performing well. A low velocity of money will usually cause alarm bells to start ringing for economists. Low velocity of money is usually the precursor of slower growth and the onset of deflationary conditions.
Another element we need to take into consideration is the overall money supply of the economy. The money supply has many different measures, but economists usually narrow these down into two distinct measures known as M1 and M2.
The M1 definition refers to the most liquid assets in the economy, namely cash and checking deposits. M2 broadens the definition of the money supply by also including “near cash” assets such as savings deposits, time deposits, and other money market mutual funds which can be converted into cash relatively quickly.
How much has money supply increased since the start of QE?
As a consequence of the Federal Reserve’s QE program, the money supply of the United States as measured by M1 has increased by over 100% since September 2008. Increasing the money supply on this scale has never occurred before – the exponential nature of the M1 chart illustrates this well.
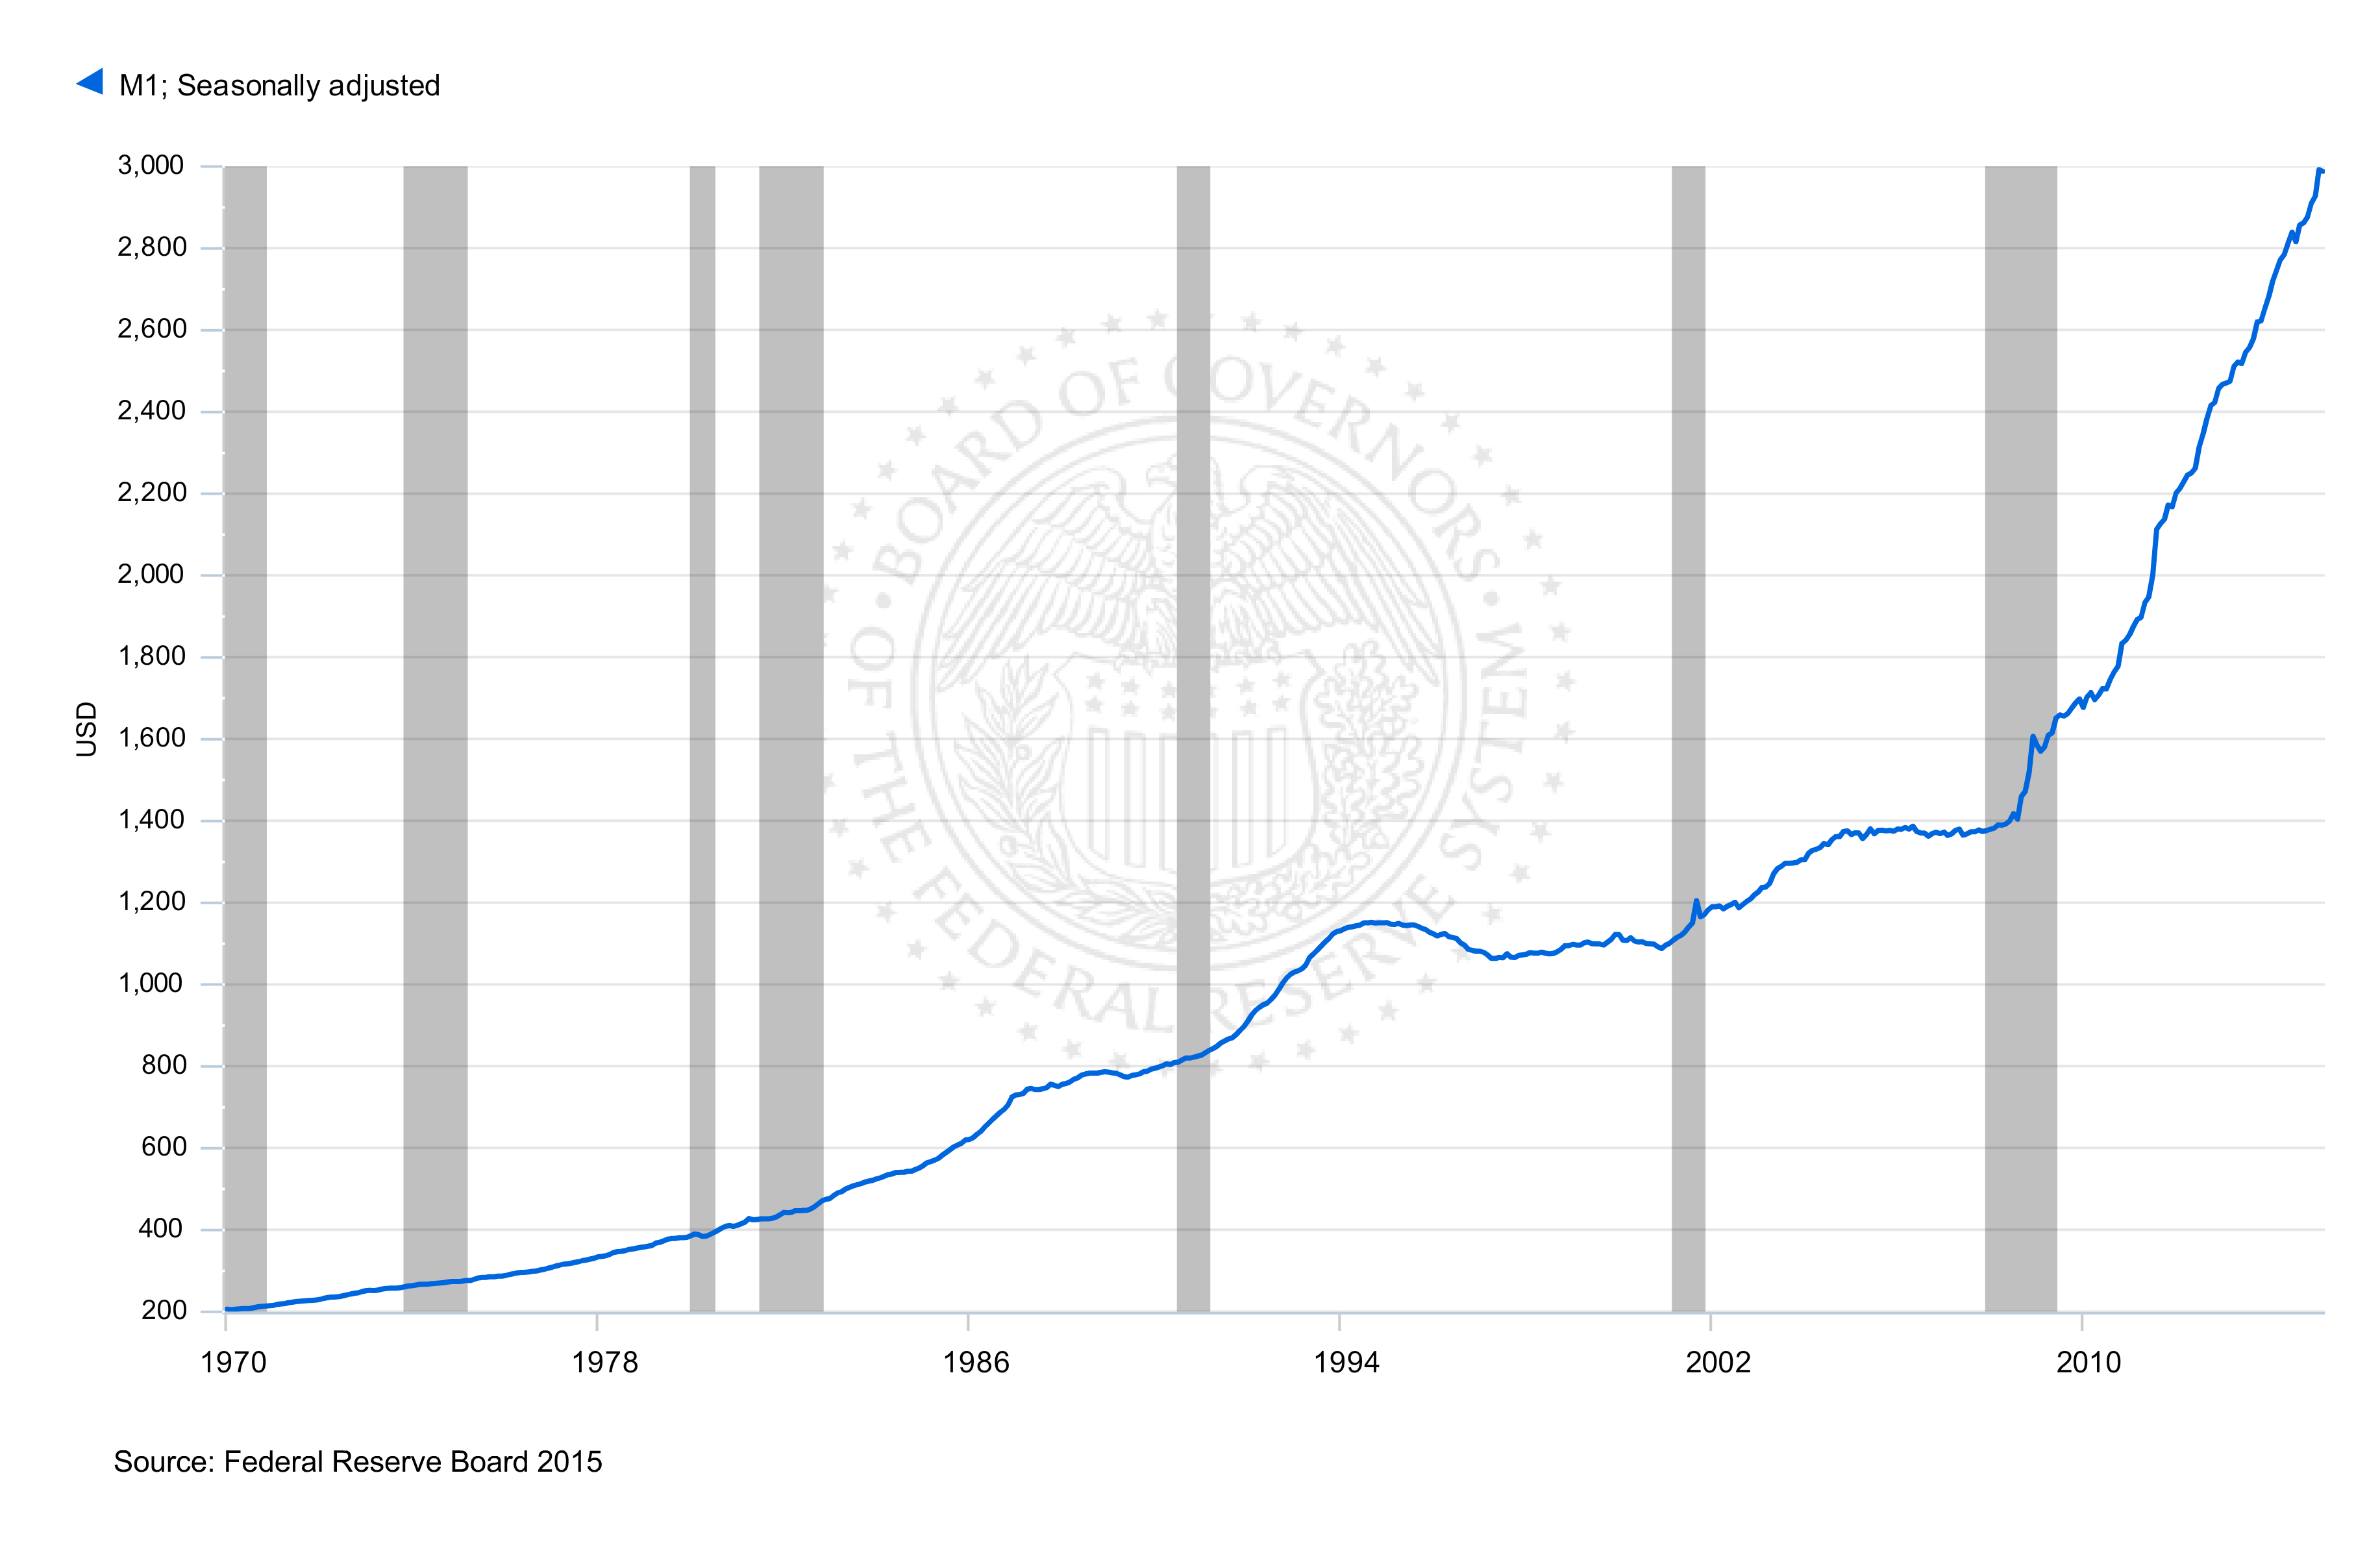
Despite the dramatic increase in the overall money supply – we are still concerned about deflationary pressures within the economy. So what has been happening with all of this extra money? Banks for the large part, have been hoarding this cash as excess reserves within the system. The transmission mechanism through credit growth has been sluggish at best – and therefore the velocity of money has been crashing.
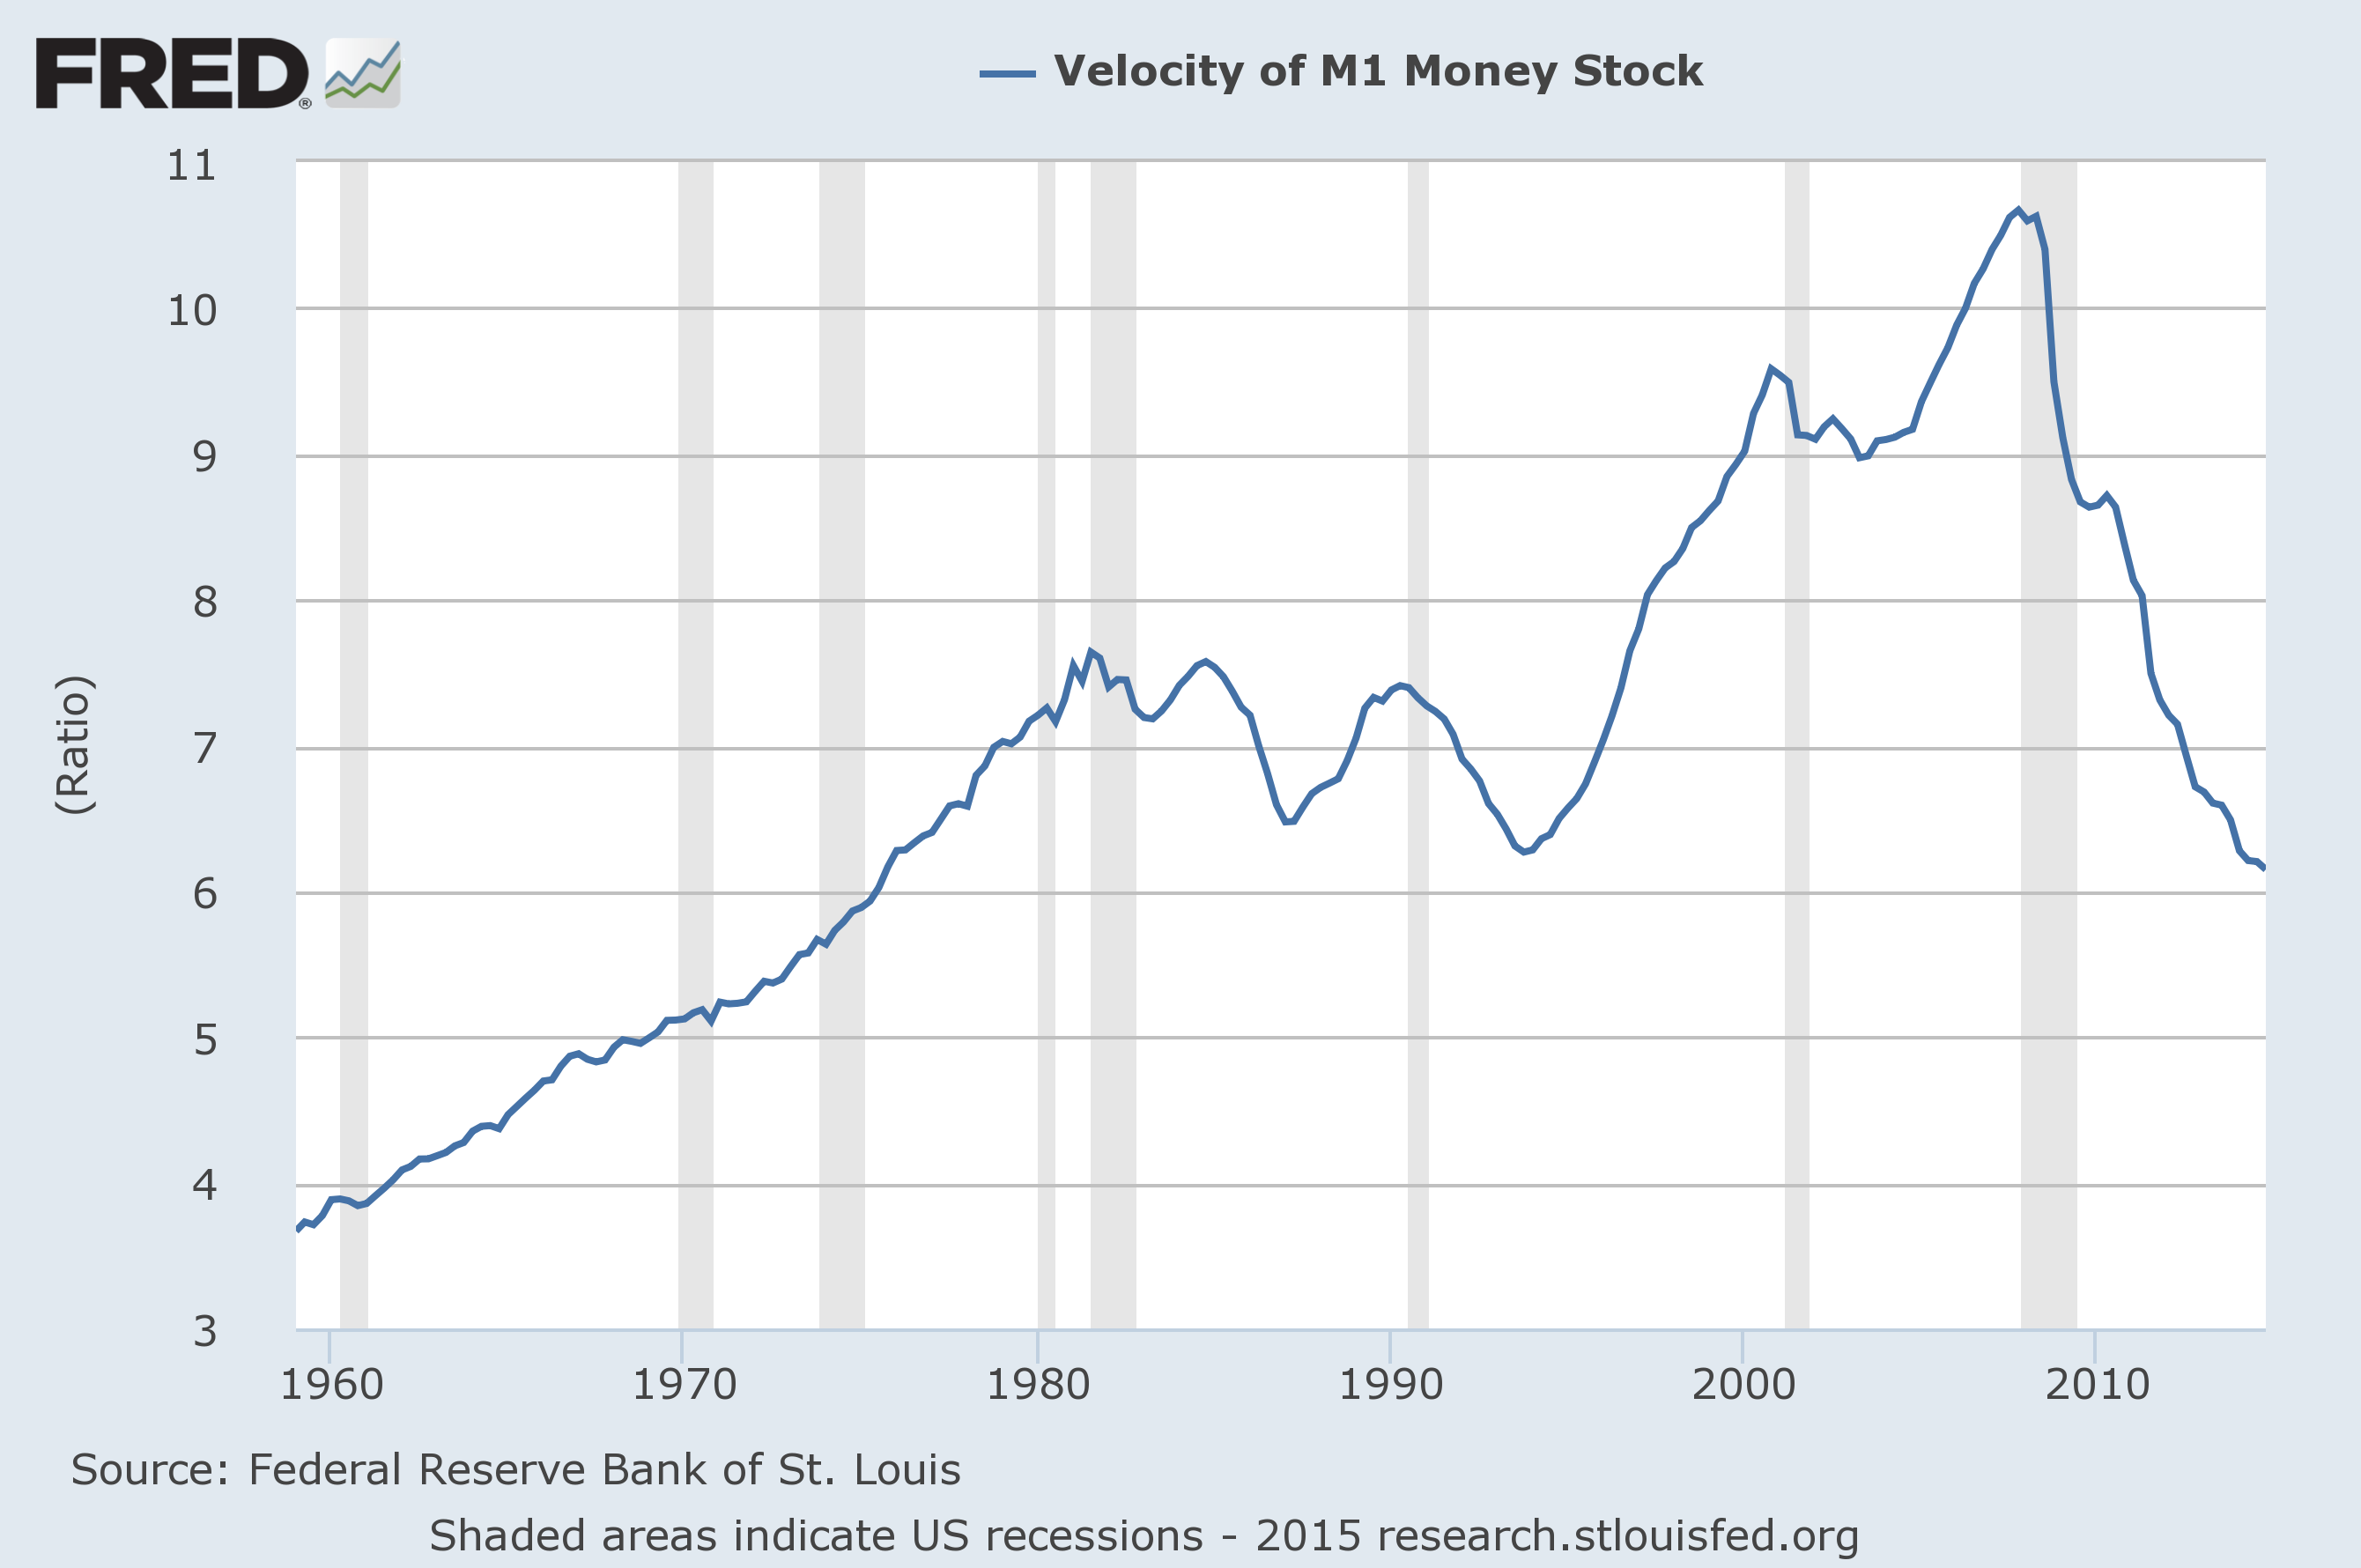
The Velocity of Money has been in freefall since 2008
The velocity of money has crashed “Post-Lehman” – the chart below shows by just how much! The implications of this are obvious. Money has been tied up in the financial sector – banks have been unwilling to lend to the “real sector” and the recovery has been going at a snail’s pace as a consequence. Financial markets by contrast, have been soaring with various markets around the word frequently taking out all time highs.
What happens next?
Looking forward from our current position is difficult. On one hand, the deflationary pressures weighing down the economy are still at large but the massive increase in the money supply has the potential to stoke serious inflationary pressures going forward. Central bank around the world have all squeezed the toothpaste tube and the contents are out. The next chapter in the “Post-Lehman” story will undoubtedly be dominated by how to get the money supply genie back into the bottle. Time will tell.

Andrew McCarthy is an expert in all things inflation. He has a Bachelors in Economics and has been working in the finance industry for over two decades.