by Liam Hunt | Jun 13, 2023 | Monthly CPI Updates
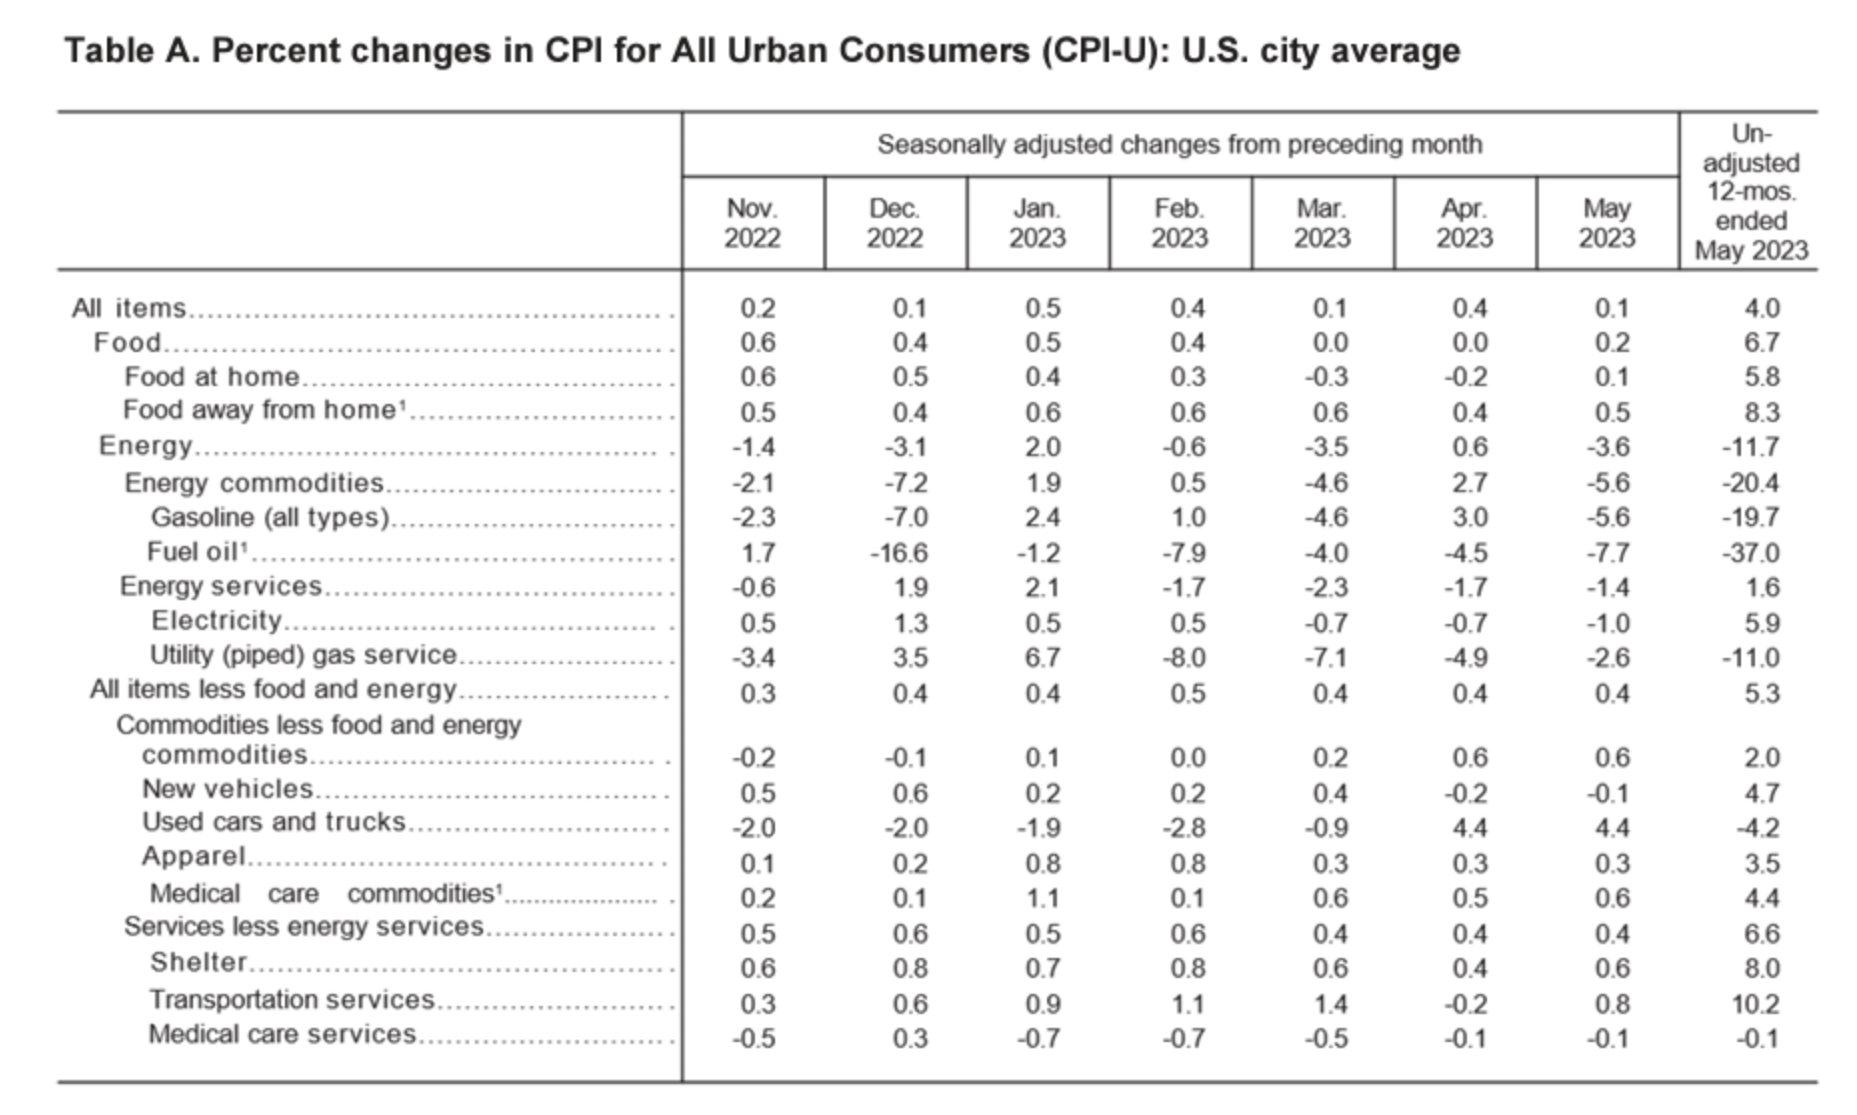
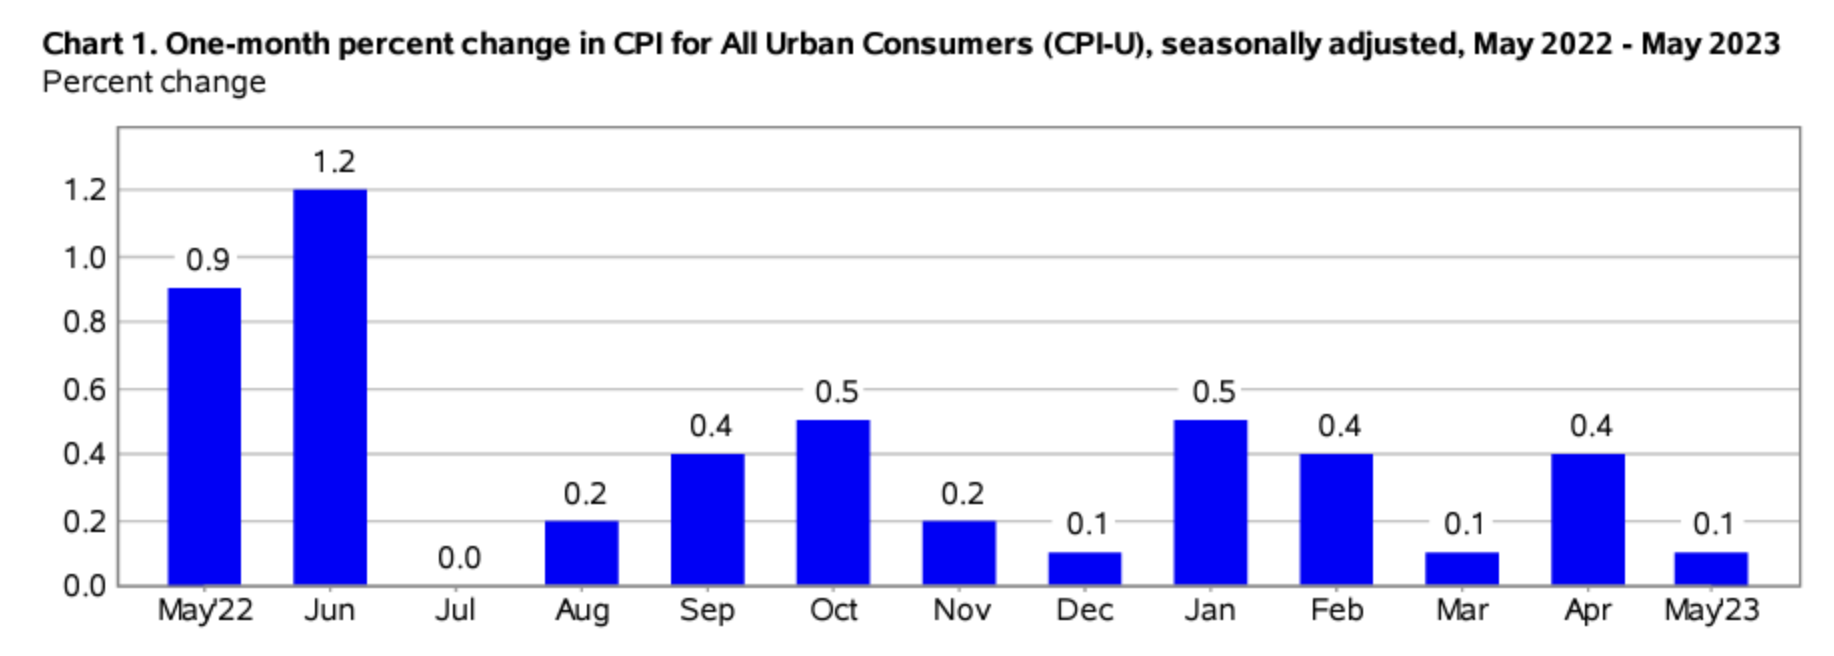
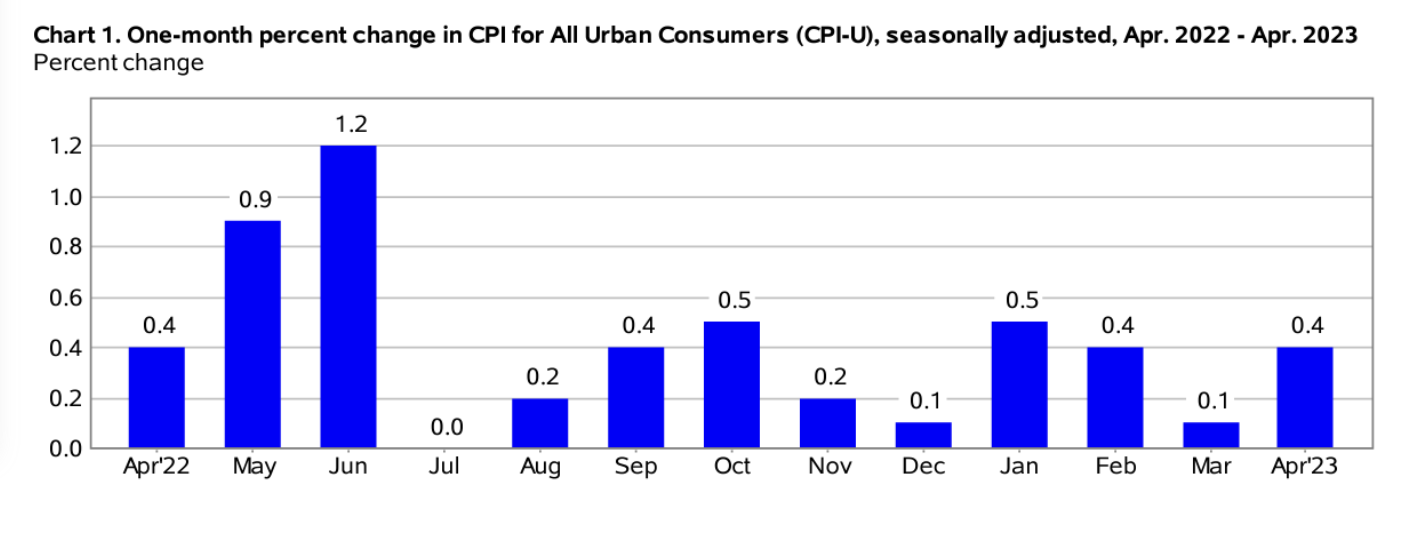
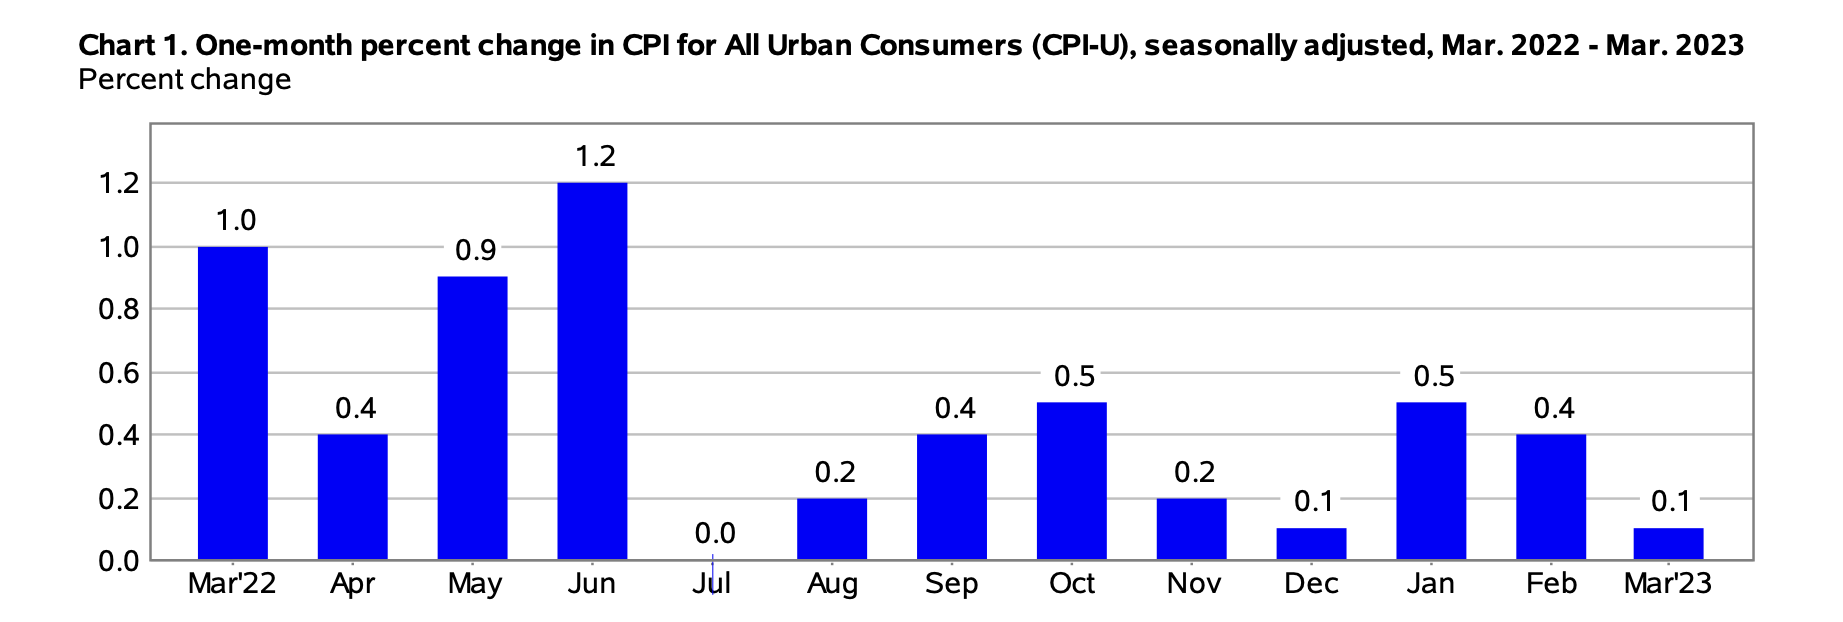
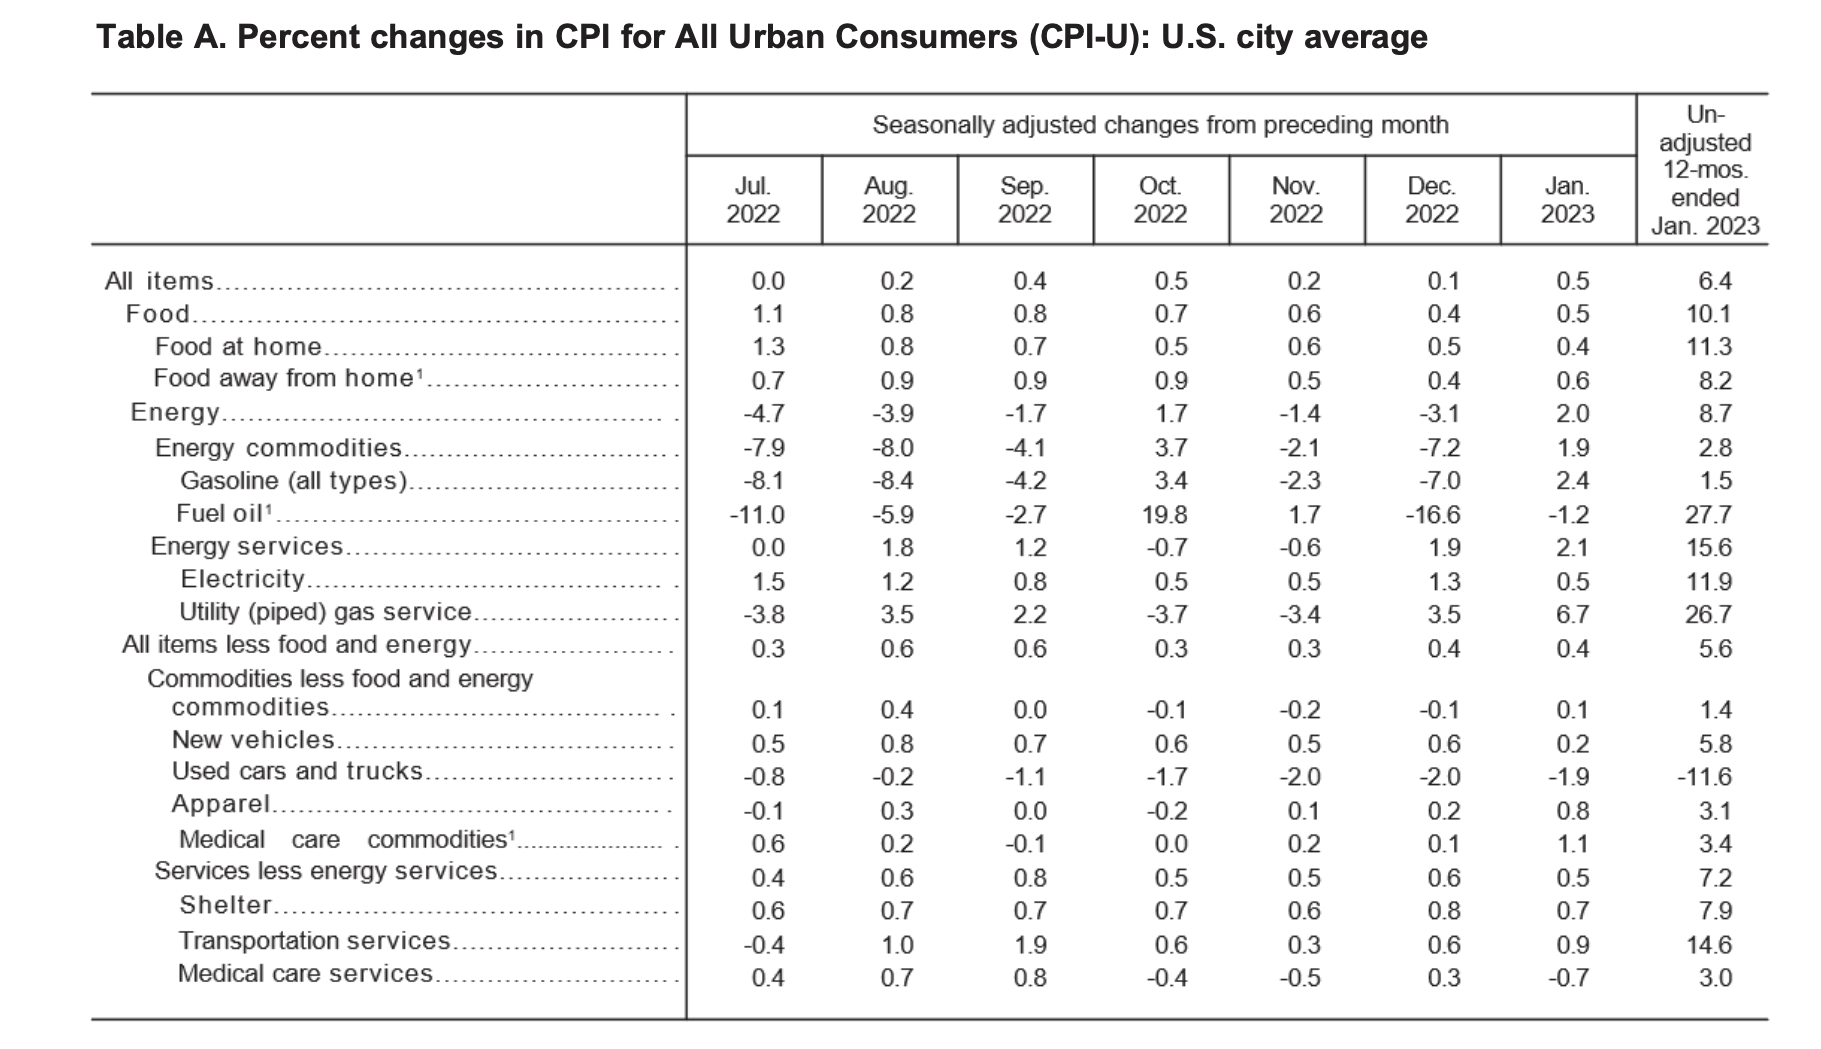
The Consumer Price Index for All Urban Consumers (CPI-U) increased by 0.1% on a seasonally unadjusted basis in May 2023, according to the Bureau of Labor Statistics report published June 13. Year-over-year, before seasonal adjustment the all-items index grew by 4.0%, constituting a major deceleration in the CPI-U from April’s 4.9% reading.
May’s rosy CPI report is the lowest since March 2021’s 2.6% reading, at a time when pandemic-era inflation was just getting started. This month’s CPI report came in far better than expected by many economists and experts. For instance, Morningstar expected only a “little slowdown” in May’s inflation rate compared to April, which would be an understatement when describing May’s nearly 20% reduction in monthly inflation. As a result, financial markets rose and priced in a near-guarantee that the Federal Reserve will not raise interest rates later this week.
In short, the May 2023 CPI report indicates that the Federal Reserve’s monetary tightening policy is working as intended. However, today’s CPI numbers are still double the Fed’s target inflation rate of 2%—an aspirational figure that may be difficult or outright impossible to reach without future rate hikes.
Source: Bureau of Labor Statistics
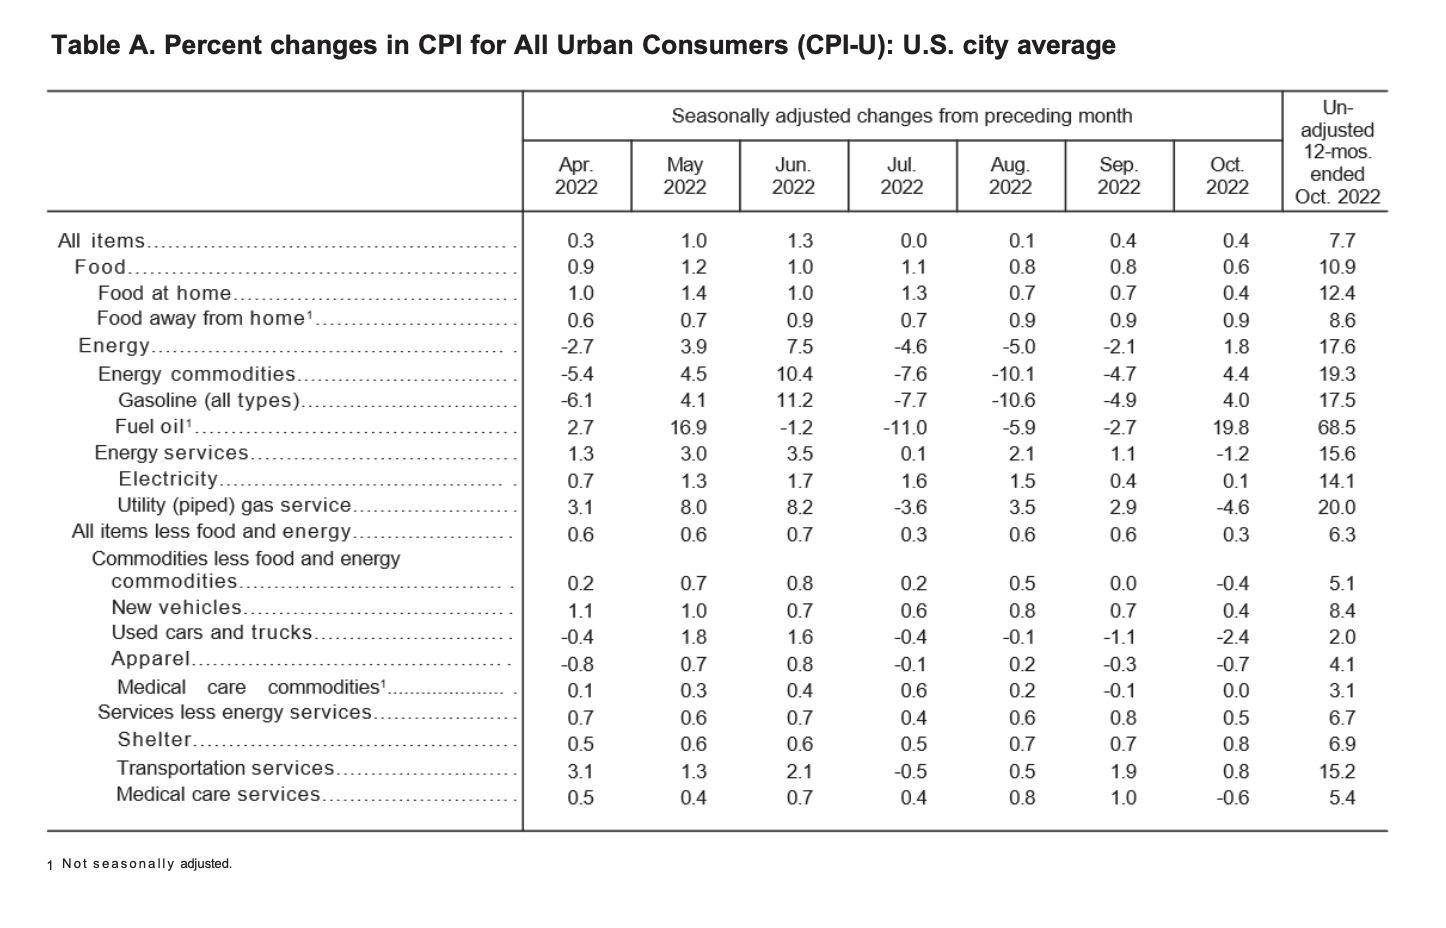
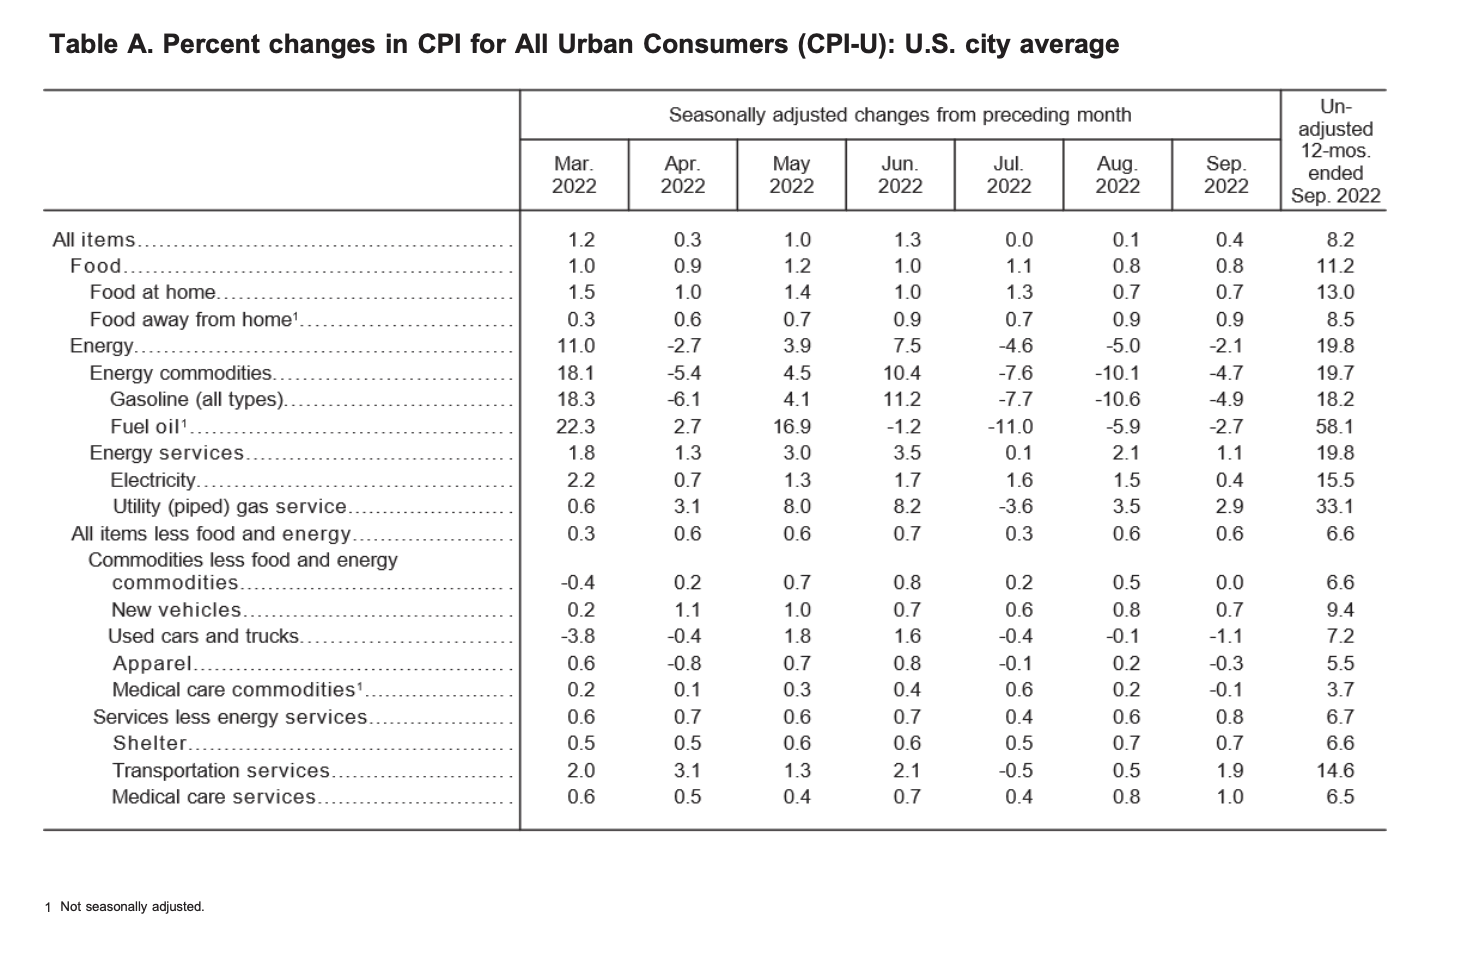
May’s impressive monthly CPI figure (0.1) came in significantly lower than the previous month’s (0.4) while matching the month-to-month reading in March. The April “blip” in the monthly CPI report can be largely explained by the base-year effect seen between April 2021 and 2022 due to the Russian invasion of Ukraine, an event that saw immediate and large-scale price increases in oil, gas, and certain natural resources. These prices then partially settled in the subsequent months.
As depicted in the table above, the May 2023 CPI figure was largely driven by increases in consumer costs for logistics and transportation services, shelter, and food away from home.
Food Prices
The food index rose 0.2 percent in May after going unchanged in April, representing a core market segment where consumer prices rose compared to the month prior. Regarding food at home, the index slightly increased (0.1%) after decreasing (-0.2%) in April. Half of the grocery store food price indexes increased in May as well, most notably the fruits and vegetables index (1.3%). However, the meats, poultry, and eggs index dropped (-1.2%), with strong price decreases in eggs (-13.8%). This marks the lowest monthly decrease in egg costs in over 70 years (January 1951).
On the year, the food away from home index rose by 8.3 percent, with full-service meals rising 6.8 percent and limited-service meals rising 8.0 percent. Over the same period, food at home rose 5.8 percent on the year with cereals and bakery items asserting the most upward pressure on the index (10.7%).
Energy Prices
The energy index fell in May (-3.6%) after rising in April (+0.6%) and falling in March (-3.5%). Notably, gasoline prices dropped (-5.6%) after a considerable increase in the previous month (+3.0%). Concurrently, natural gas fell by 2.6 percent in May, continuing on price decreases over the previous two months. Fuel oil and electricity prices also fell, by 7.7 percent and 1.0 percent, respectively.
In sum, all energy costs fell in May, which mostly added to a continuing trendline of falling energy prices ongoing since March. However, electricity prices are still up on a 12-month basis, rising by 5.9 percent since May 2022.
Core May 2023 CPI
Regarding the core CPI data for May 2023 (inflation less food and energy), the index rose 0.4% month-over-month in May, matching its pace in both April and March. Below is an itemized breakdown of the main price fluctuations seen within May’s core CPI reading:
- Shelter index: +0.6% (+0.4% in April)
- Used cars and trucks: +4.4 (+4.4% in April)
- Motor vehicle insurance: +2.0%
- Rent index: +0.5%
- Lodging away from home: +1.8%
- Medical care index: +0.1% (unchanged in April)
- Household furnishings: (-0.6%)
- Airline fares: (-3.0%)
Source: Bureau of Labor Statistics
Seasonally Unadjusted CPI Data for May 2023
Before seasonal adjustments, the CPI-U for May 2023 increased (+0.3%) for the month, rising to an index level of 304.127. Since these figures are unadjusted, they include regular seasonal price fluctuations that generally occur at the same time and by the same margins every year.
This Year, Guard Your Wealth From Inflation
May’s CPI report may seem optimistic, but the U.S. dollar is continuing to decline in value at twice the speed that the Federal Reserve would prefer. The result is that American families have less purchasing power than they did last year, and their paychecks haven’t kept pace. While inflation is coming back down to Earth, the average American household has lost the equivalent of $7,400 in annual wages due to inflation and rate hikes.
Fortunately, you can mitigate the adverse effects of inflation. Consider speaking to your financial advisor about diversifying your investment portfolio with alternative assets that may help insulate your savings from the devaluation of the U.S. dollar.
Scarce physical assets such as gold and silver have historically outperformed traditional securities during most recessions, economic crises, and periods of high inflation. For many investors, gold functions as an inflation hedge, providing a much-needed store of value when fiat assets depreciate. As such, it is sought after by many notable investors—like Ray Dalio and Kevin O’Leary—as a strategic risk management tool.
To get started with gold or silver investing, open an account today with one of the best-rated gold IRA service providers. While you’re at it, be sure to stay up-to-date on inflation news in the months ahead. You can easily keep tabs on how inflation is impacting your household’s purchasing power by using our free CPI inflation calculator tool that tracks the effects of inflation on your purchasing power.
by Liam Hunt | May 10, 2023 | Monthly CPI Updates
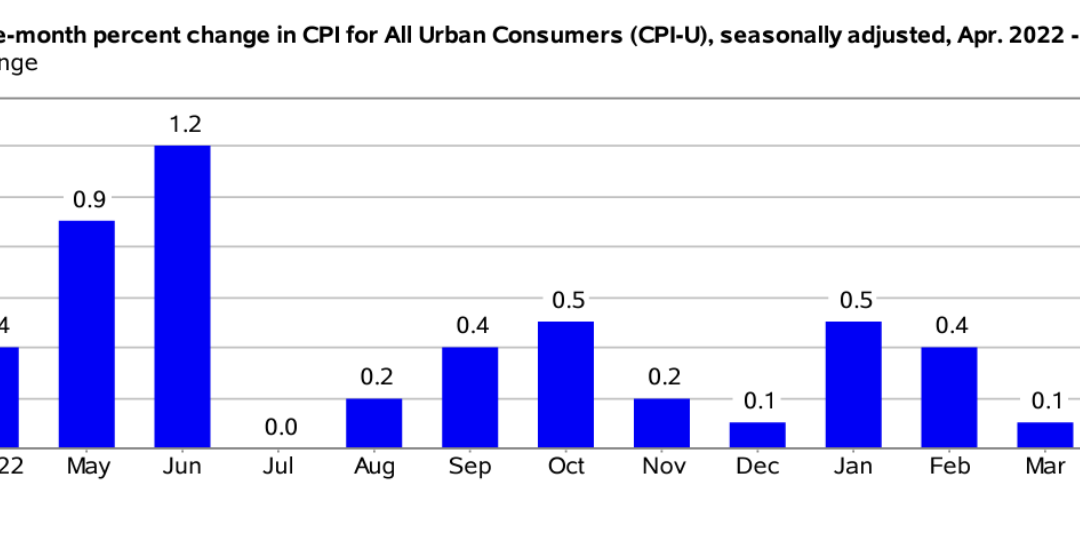
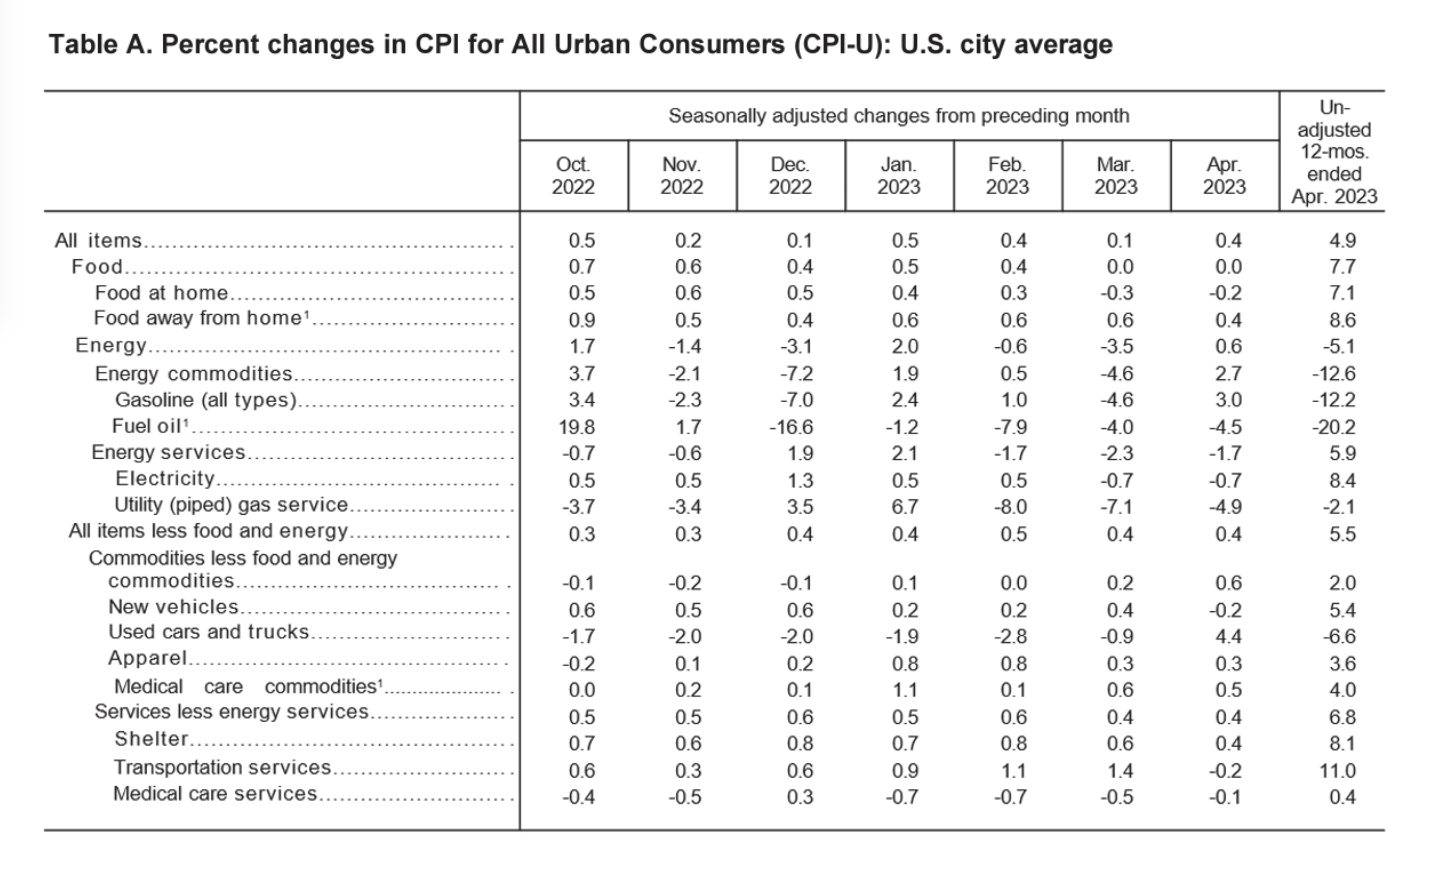
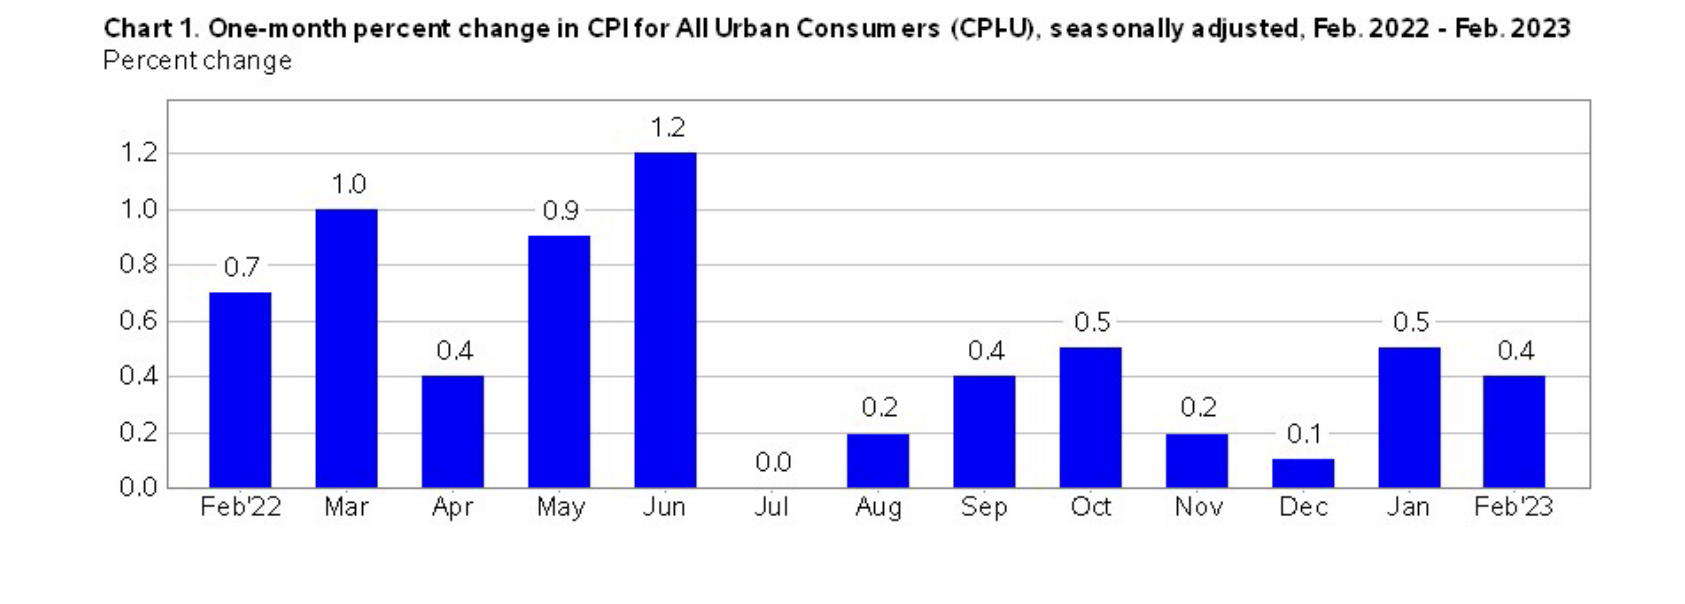
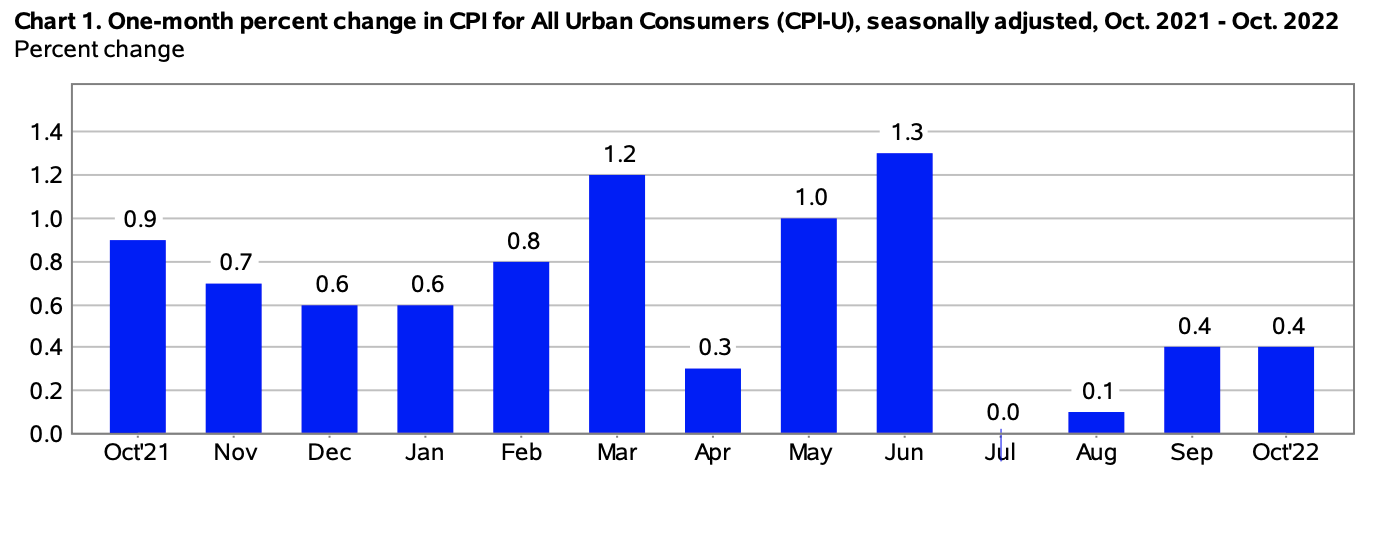
The Consumer Price Index for All Urban Consumers (CPI-U) increased by 0.4% on a seasonally unadjusted basis in April 2023, according to the Bureau of Labor Statistics report published May 10. Year-over-year, before seasonal adjustment the all-items index grew by 4.9%, which is slightly down from 5.0% in March.
Overall, the April 2023 CPI report came in better than expected for market watchers. Independent observers generally expected a steady inflation rate of 5.0% for April, so the slightly better-than-expected results of 4.9% generated a jump of 150 points in the Dow Jones.
This month’s CPI report indicates that the Federal Reserve’s hawkish monetary policy is working as intended, as inflation has been continually trending downward for the better part of a year. However, there remains a long road ahead to get to the 2.0% target rate that the Fed has maintained as a policy aspiration.
Source: Bureau of Labor Statistics
April’s monthly CPI figure (0.4) came in significantly higher than the previous month’s (0.1). This is due to the fact that March 2022 saw significant increases in oil, gas, and natural resource prices during the early days of the Russian invasion of Ukraine, creating a skewed base-year effect.
Overall, heightened consumer costs for shelter, used cars and trucks, and gasoline were the main drivers behind April’s 2023 CPI increase.
Food Prices
The food index went unchanged in April, while the food at home index fell (-0.2%), which is a deceleration from the previous month’s drop of (-0.3%). Fortunately for American families, four out of six grocery indices fell in April, providing some relief at the supermarket checkout. Notably, fruits and vegetables fell (-0.5%), and meats, poultry, fish, and eggs fell as well (-0.3%).
By contrast, certain food items increased in price. Most notable were cereals and bakery goods, which increased (+0.2%) in April, although they rose by an even higher margin during the previous month (+0.4%).
Energy Prices
Energy costs rose in April (+0.6%) after falling (-3.5%) in March. Gasoline, in particular, rose by +3.0% whereas the natural gas index declined (-12.2%) on the year. At the same time, the fuel oil index also dropped off precipitously (-20.2%) while electricity costs rose by +8.4%. In other words, energy costs either rose or fell by varying margins depending on the segment of the market and the specific energy type.
Core April 2023 CPI
The core CPI data for April 2023, which refers to the monthly CPI figure less food and energy, rose 0.4% month-over-month in April, matching its pace in March. Below, we’ve shared a brief breakdown of the main price movements seen within April’s core CPI reading:
- Shelter index: +0.4% (+0.6% in March)
- Used cars and trucks: +4.4%
- Motor vehicle insurance: +1.4%
- Airline fares index: (-2.6%)
- New vehicles: (-0.2%)
- Medical care index: (-0.3%)
- Shelter index: +8.1% (comprising 60% of the core CPI’s total increase)
Source: Bureau of Labor Statistics
Seasonally Unadjusted CPI Data for April 2023
Prior to seasonal adjustment, the CPI-U data for the month increased (+0.5%), rising to an index level of 303.363. Due to their unadjusted nature, these data include normal price fluctuations that regularly occur at the same time and by the same margins every year.
Protect Your Portfolio from Inflation in 2023
Every month, the U.S. dollar loses value, and the relative purchasing power of the American consumer declines. To combat the negative effects of inflation, consider speaking to your financial advisor about diversifying your investment portfolio with alternative assets that may help insulate your savings from the devaluation effects of inflation.
Hard assets such as gold and silver have historically performed well during periods of economic uncertainty and high inflation. As an inflation hedge, its often sought after by investors looking to actively manage risk in their investment strategy. To get started with gold or silver investing, consider opening an account with one of America’s best gold IRA service providers. The current top-ranked provider of gold IRAs is Noble Gold—you can read an exclusive review of Noble Gold here.
To keep tabs on inflation in the months ahead, don’t forget to use our exclusive CPI inflation calculator tool to see how macroeconomic conditions are affecting your purchasing power.
by Liam Hunt | Apr 12, 2023 | Monthly CPI Updates
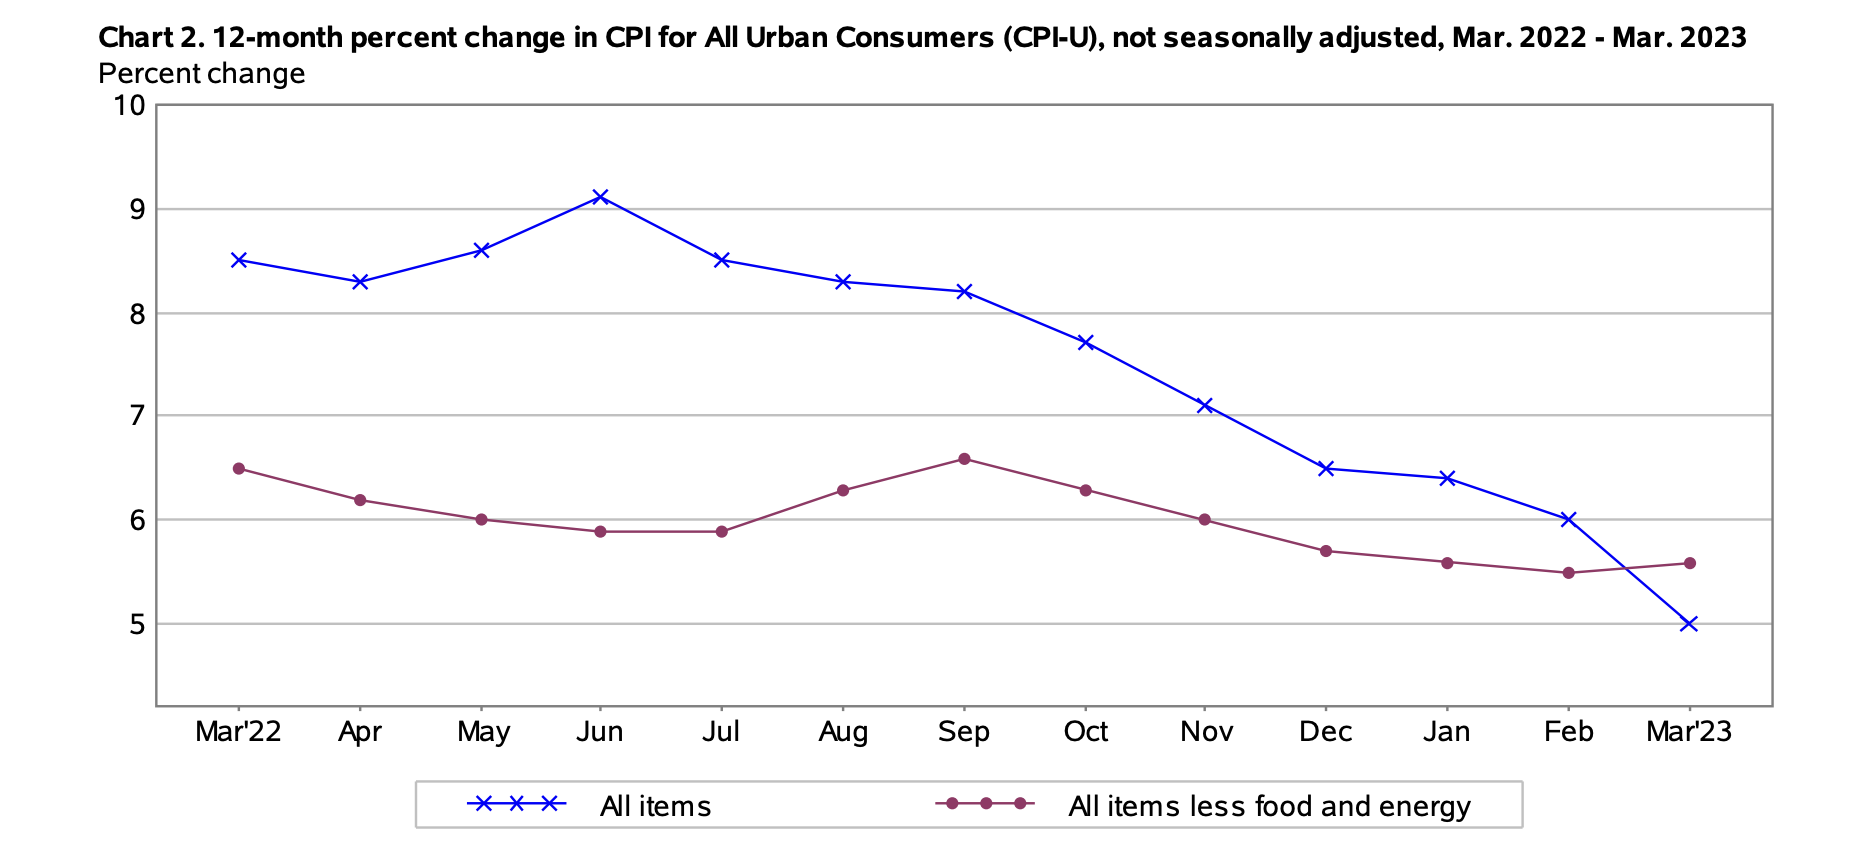
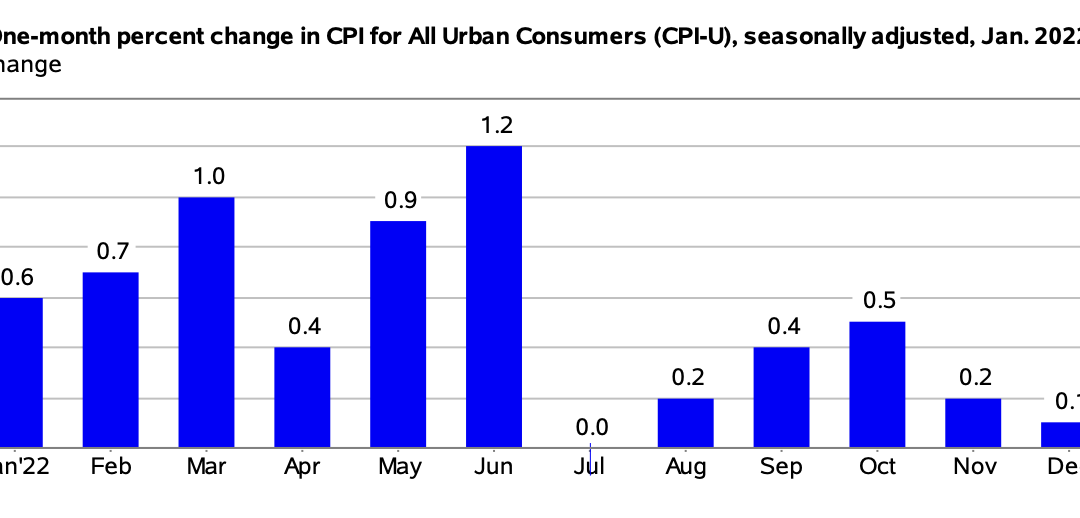
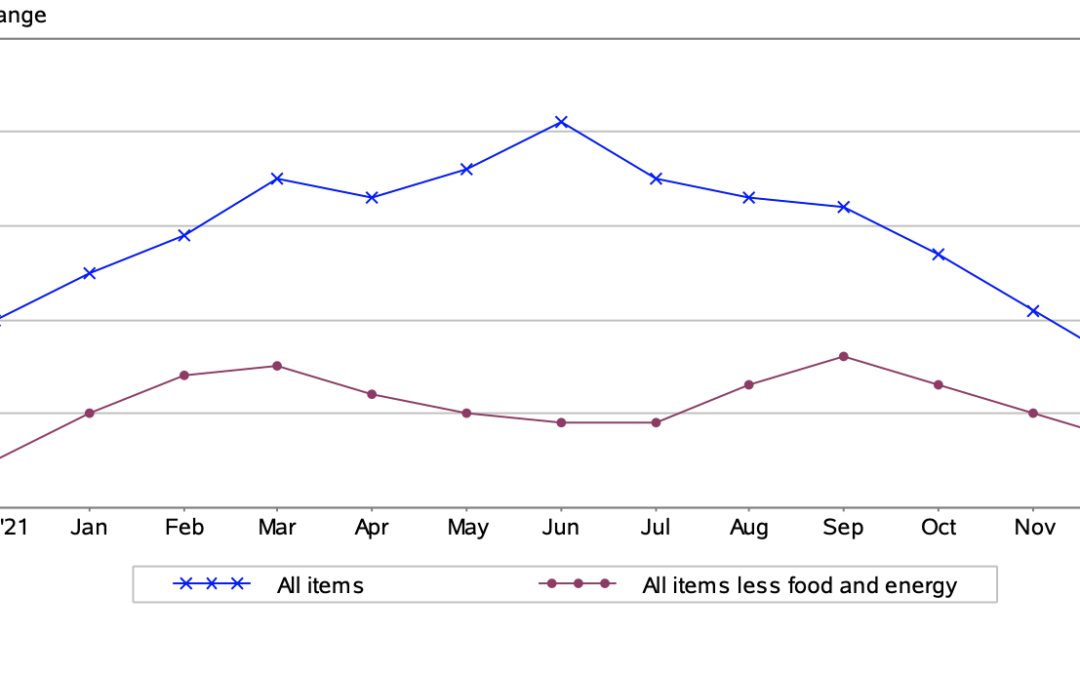
The Consumer Price Index for All Urban Consumers (CPI-U) increased by 0.1% on a seasonally adjusted basis, per the Bureau of Labor Statistics. Year-over-year, before seasonal adjustment the all-items index grew by 5.0%, which is down from 6.0% in February.
March’s CPI data is in step with a continuing trend of inflation deceleration that has been ongoing all year after peaking at 9.1% in June of last year. According to a Yahoo Finance report, consumer prices in March came in less than expected, which was around 5.2%.
In short, the March 2023 CPI-U data indicates a cool-off is still underway, with deceleration trending toward the Fed’s target rate of 2.0% by next year.
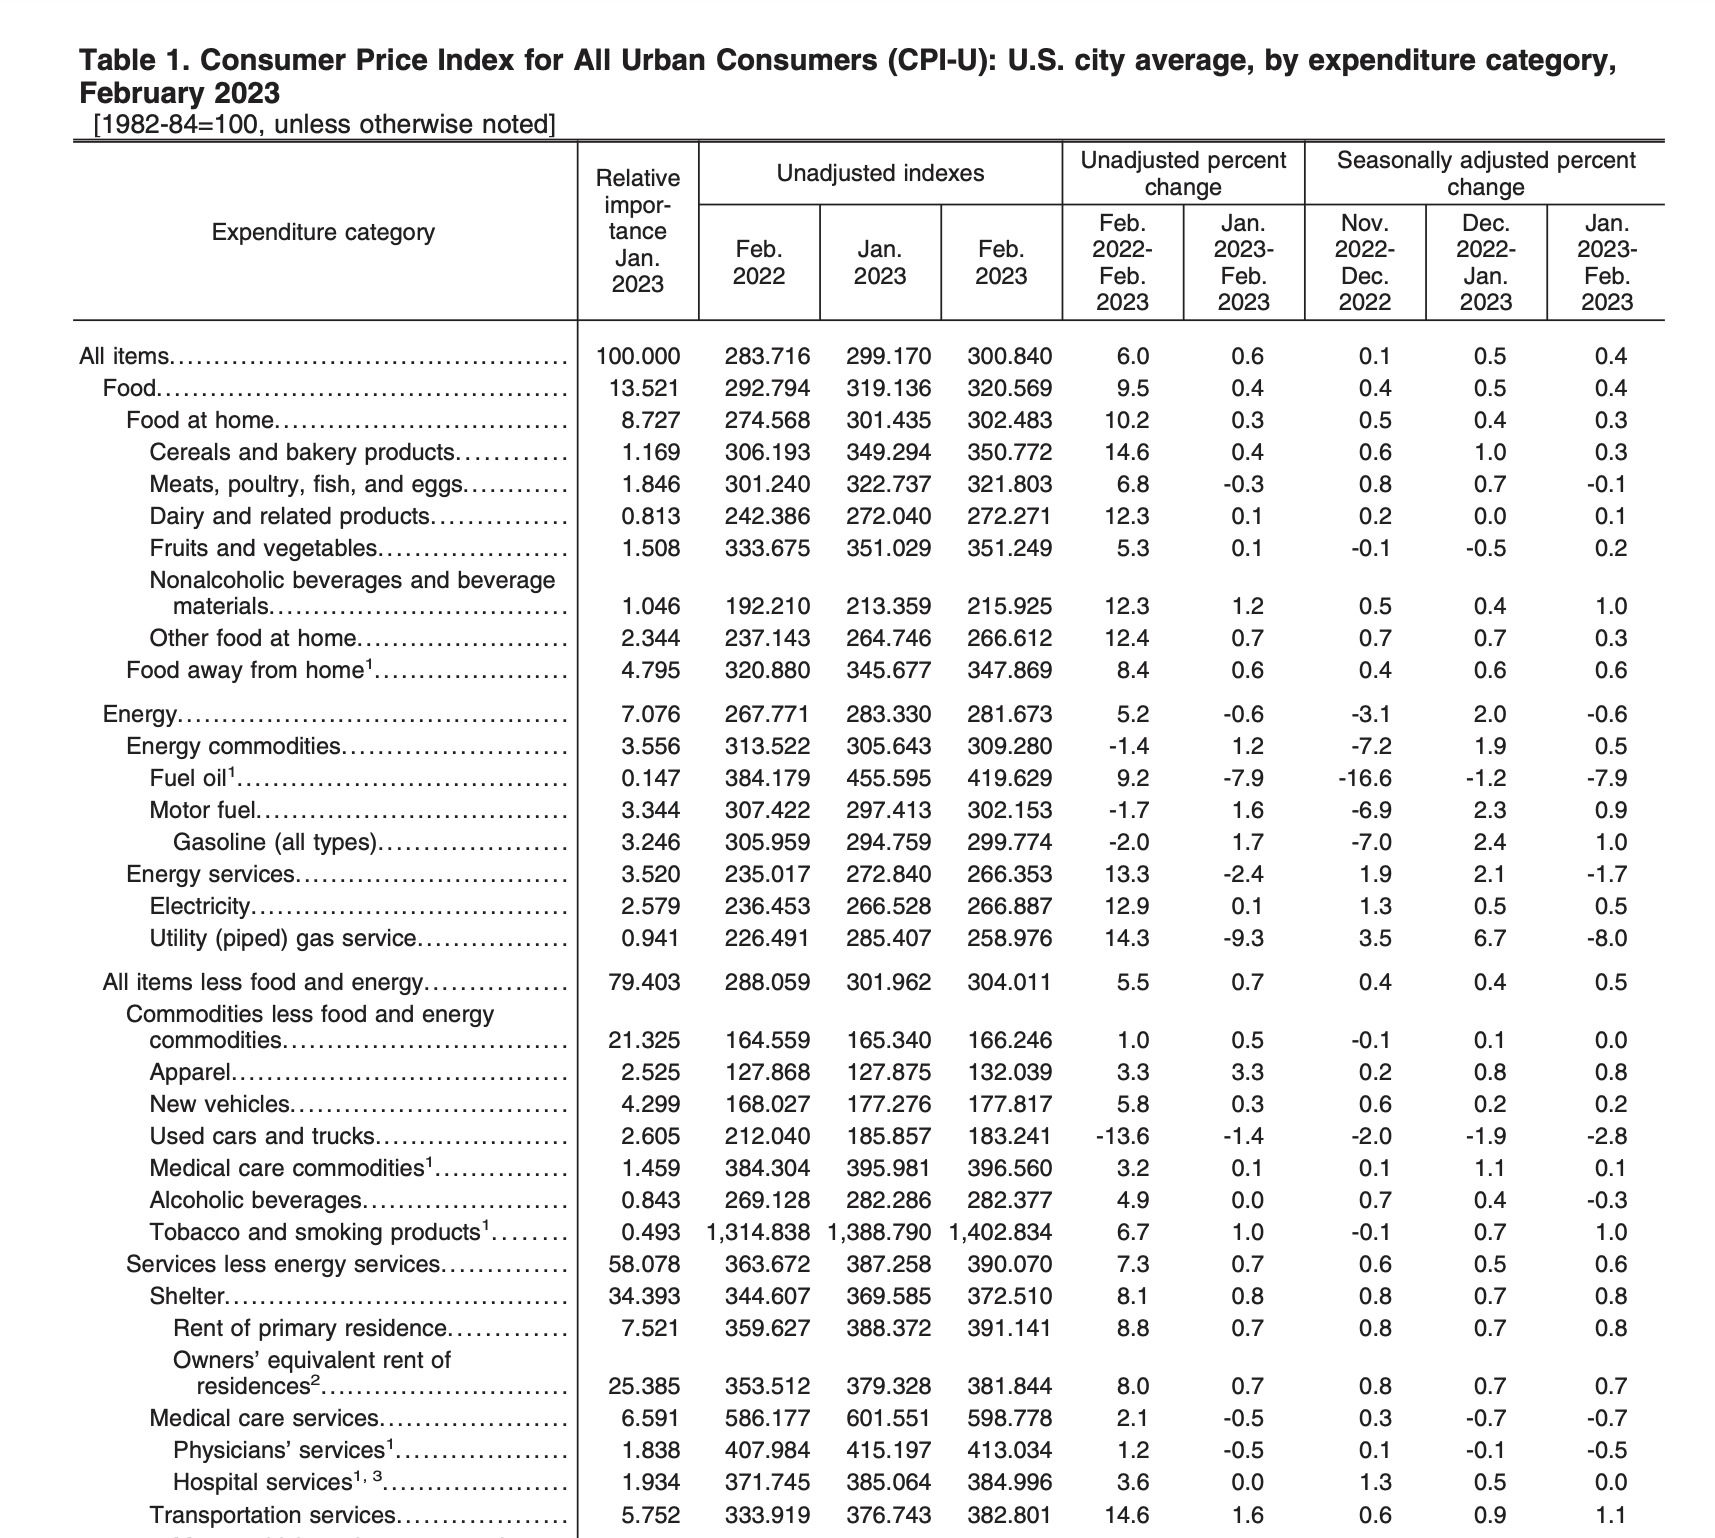
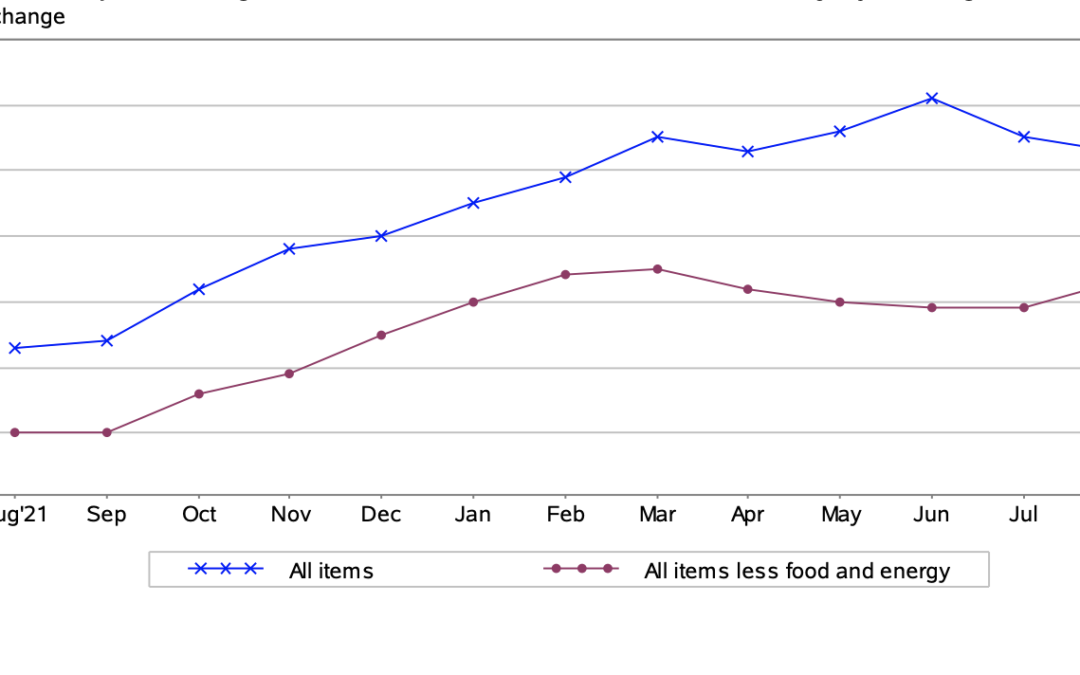
Shelter costs were the major driving force in March’s inflation figure. Although the energy index declined in March and the food index remained unchanged from last month, the index for all items less food and energy rose 0.4%. Overall, the March 2023 CPI increase (5.0%) constituted the smallest year-over-year (Y-o-Y) increase since May 2021.
Source: Bureau of Labor Statistics
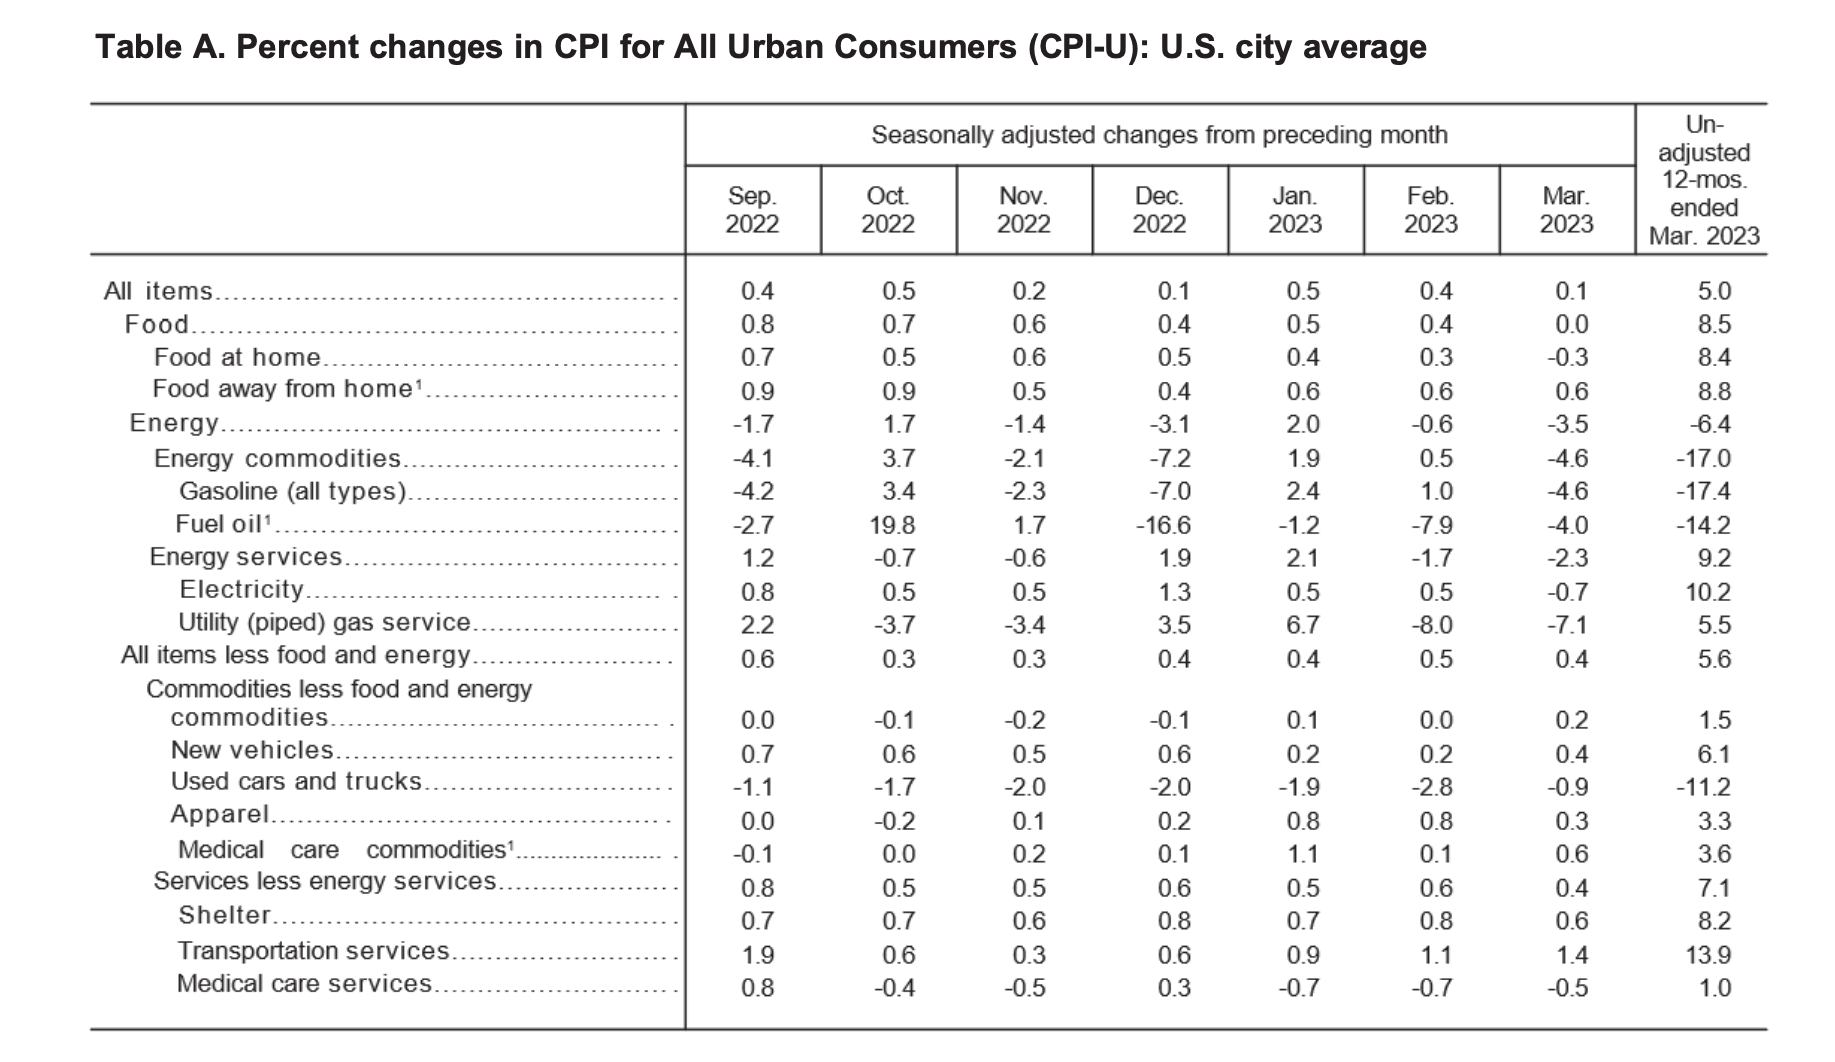
As indicated in “Table A” below, energy prices, including gasoline, as well as used cars and trucks put significant downward price pressure on the CPI in the month of March. Meanwhile, food at home (8.5%), food away from home (8.8%), and transportation services (13.9%) asserted a lot of upward pressure that more than offset the price reductions in the energy sector.
Most significant is the drop in energy prices which, compared to February 2023, saw dramatic price drops. This can largely be attributed to the major price increases in oil and gas following the Russian invasion of Ukraine in March of last year.
Largest Y-o-Y Drop Since May 2021
The most important story in the March 2023 CPI report is that inflation is dramatically cooling off from its mid-2022 high point. In fact, this month saw the smallest Y-o-Y increase in the CPI-U since May 2021. This appears to indicate that the Federal Reserve’s hawkish interest rate policy appears to be working as intended, and that future rate hikes are likely to continue (albeit at a slower pace) until the target 2% inflation benchmark is reached.
Core CPI Still Cause for Concern
Overall, the core CPI (CPI-U less food and energy) is still hot, coming in at 0.4% after a 0.5% increase in February. This is due primarily to rent increases and increases in the homeowners’ equivalent rent indices increasing by 0.5% in March. Therefore, policymakers are likely to target rent and housing affordability concerns through legislative efforts in order to mitigate the negative effects of housing costs on the CPI.
Ready to Protect Your Retirement Savings?
While inflation appears to be cooling, high interest rates and cost-of-living increases are taking a toll on the average American family. With inflation still far above the Fed’s target benchmark, investors are losing more and more of their savings every year due to the depreciation of the U.S. dollar.
Want to learn more about how inflation is impacting American households? Check out our exclusive calculator widget, and don’t forget to subscribe to our monthly newsletter if you haven’t already—this way, you can stay informed of the latest CPI developments immediately after they’re released.
Source Cited: https://www.bls.gov/news.release/pdf/cpi.pdf

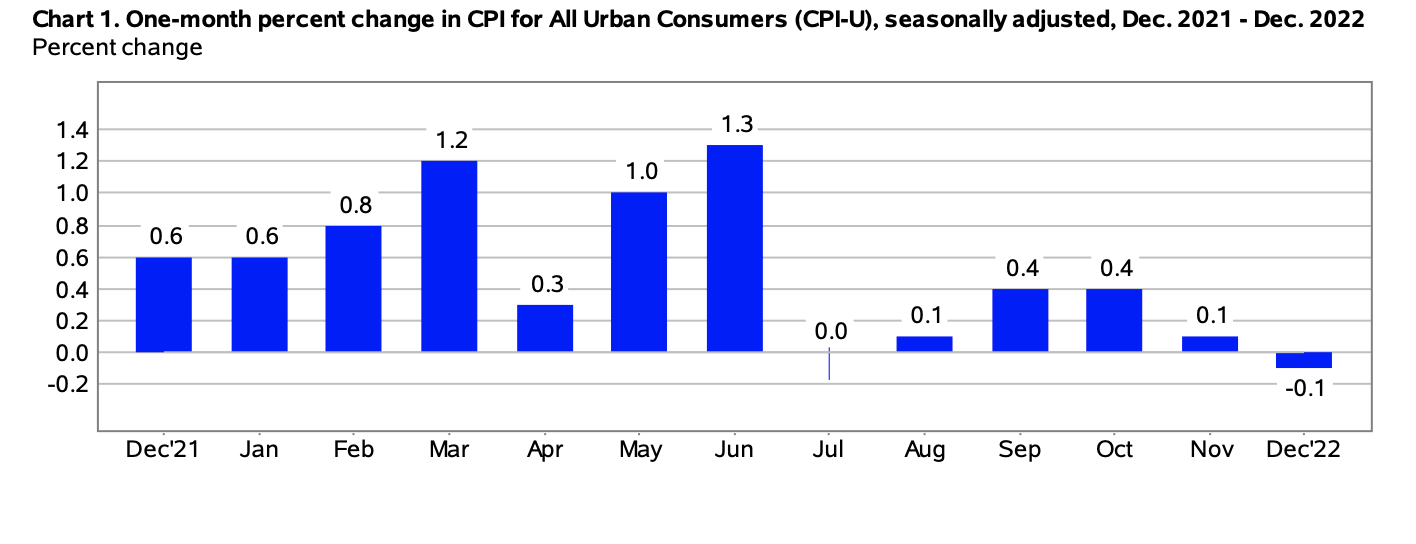
by Liam Hunt | Mar 14, 2023 | Monthly CPI Updates
The Consumer Price Index for All Urban Consumers (CPI-U) increased by 0.4% on a seasonally adjusted basis, per the Bureau of Labor Statistics. Year-over-year, before seasonal adjustment the all items index grew by 6.0%, which is down from 6.4% in January.
According to CNBC, the biggest culprits driving inflation this month were eggs (+55.4%), butter and margarine (26.9%), and airfare (26.5%). The greatest counterweights were televisions (-14.8%) and used cars and trucks (-13.6%), which both cooled down considerably.
February’s CPI data continues a general deceleration of inflation that has been ongoing for several months, and which represents a considerable cooling off from the pandemic-era peak of 9.1% in June 2022. Prior forecasts pegged February’s seasonally adjusted CPI to come in at 6.0%, which turned out to be exactly on the money. However, core CPI came in a little hotter than expected, by precisely one-tenth of one percent at 0.4% (5.5% year-on-year).
Source: U.S. Bureau of Labor Statistics
Food
In February, the food index rose by +0.4% while the food at home index rose at a slightly lesser pace of +0.3%. Compared to January, five out of six food categories increased, including nonalcoholic beverages and dairy and related products.
On the other hand, certain food categories fell, including poultry, fish, and eggs, which decreased (-0.1%) in February, which constitutes the first decrease in this food category in 14 months (December 2021).
Energy
When it comes to energy prices, the energy index fell (-0.6%) in February, following a fairly large 2.0 percent increase in January. Bringing the CPI-U down was the natural gas index, which dropped by the largest margin since 2006 (-8.0%).
Over the past 12-month period, the energy index hiked +5.2%, whereas the fuel oil index rose +9.2% in the same period alongside electricity at +12.9% and natural gas at +14.3%.
Gasoline costs fell (-2.0%) in February, providing much-needed price relief at the pump for American consumers.
Source: U.S. Bureau of Labor Statistics
All Items Less Food and Energy (February 2023 Core CPI)
February 2023’s core CPI came in at 0.5%, which represents a slight increase over many market watchers’ expectations of 0.4% and constituting a rise from 0.4% in January. Driving up the core CPI was the shelter index, which rose 0.8% and the index for rent which went up 0.8% as well. Lodging away from home rose by 2.3% in February.
Within the core CPI, the shelter index was the greatest driver of the index’ larger-than-anticipated outcome in February. Additional upward pressures were asserted by prices for motor vehicle insurance by +14.5% and household furnishings at +6.1%. However, numerous areas within the core index fell, including the medical care index (-0.5%) and the index for physicians’ services (-0.5%).
Inflation Matches Expectations in February: Interest Rate Relief to Come?
Given that February’s CPI report matched analysts’ expectations, we may see Federal Reserve Chairman Jerome Powell announce a temporary off-ramp of the central bank’s quantitative tightening policy. As speculated on CNBC Television on Tuesday, the current crisis at Silicon Valley Bank, with the threat of a contagion spilling over into over sectors of the U.S. and global economy, it may be in the Fed’s best interest to pause rate hikes following the next Federal Open Market Committee meeting on March 21 and 22.
In short, February’s report indicates that the Fed’s hawkish interest rate policy, which has seen multiple .25 and .50 basis point hikes as of late, has been largely successful in restraining inflation. This month’s CPI came in exactly where experts predicted they would, with the slight exception of the core CPI which was only a bit hotter than anticipated. Given the ongoing systemic problems in the lending market, we may, however, see the Fed’s interest rate policy relaxed through the spring, which may temporarily give rise to a new rebound period in the inflation rate.
Curious about how inflation is impacting your retirement and the economy at large? Check out our calculator widget to see how the CPI is affecting your financial freedom, and don’t forget to subscribe to our monthly newsletter if you haven’t already—this way, you can stay abreast of the latest CPI developments as soon as they’re released.
Source Cited: https://www.bls.gov/news.release/cpi.nr0.htm
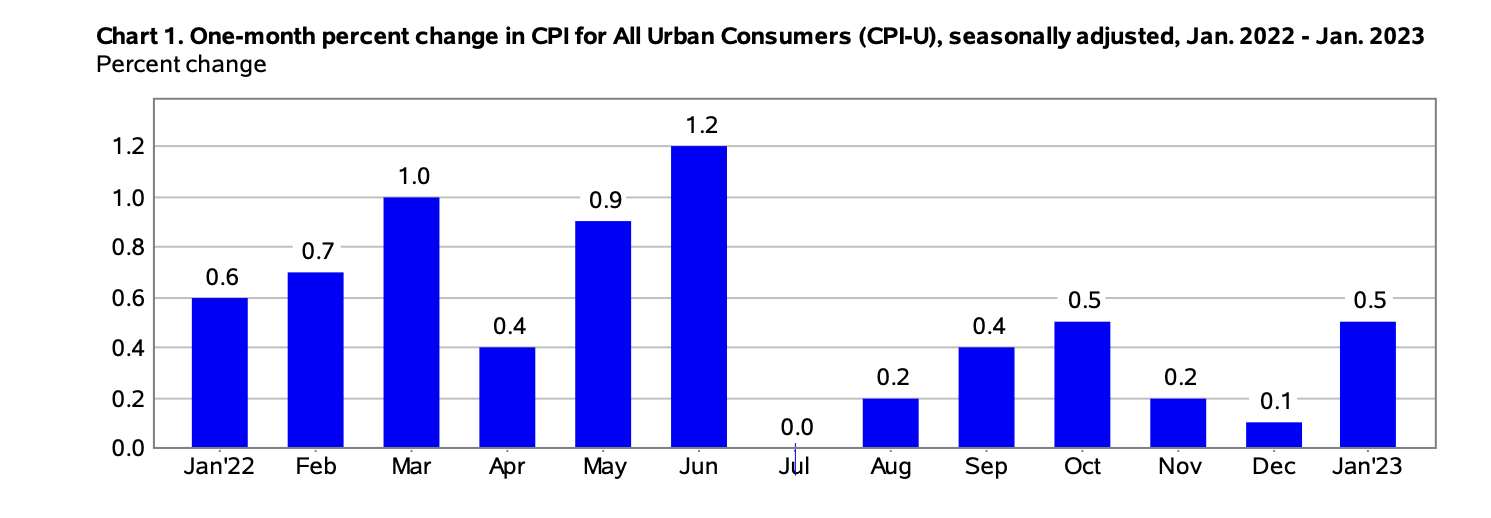
by Liam Hunt | Feb 14, 2023 | Monthly CPI Updates
The Consumer Price Index for All Urban Consumers (CPI-U) increased by 0.5% on a seasonally adjusted basis, reported the Bureau of Labor Statistics. Year-over-year, before seasonal adjustment the all items index grew by 6.4%.
The primary contributing variable to the acceleration in the CPI-U was shelter, but other items such as food, gasoline, and home heating costs also applied upward pressure on the CPI-U.
Even though they represented a modest easing in inflation, January’s CPI figures, on the whole, came in slightly worse than analysts expected. For example, Bloomberg forecasted a deceleration to 6.2%—a whole 0.2 points below the actual figure.
Source: U.S. Bureau of Labor Statistics
Food
In January, the index for food rose by 0.5%, following a 0.4% rise in December 2022. Of the six major grocery store indices utilized by the BLS, four of them increased month-over-month. Meats, poultry, fish, and eggs increased by 0.7% in January while the egg cost index increased 8.5%.
By contrast, fresh fruits and vegetables lowered in price in January, falling 0.5%, while dairy prices remained the same as in December 2022.
Gasoline Prices
January’s gasoline prices increased 2.4% month-over-month. Before seasonally adjusting, the price at the pump rose by 3.2%. Therefore, consumers paid considerably more to fill their car’s gas tank in January compared to the month prior.
Energy
The energy index rose 2.0% in January and 8.7% year-over-year, representing a stark increase due in large part to the ongoing Russian invasion of Ukraine. Over the past 12-month period, the fuel oil index rose 27.7% while electricity costs rose 11.9% and natural gas rose 26.7%.
Source: U.S. Bureau of Labor Statistics
All Items Less Food and Energy
January 2023’s CPI report indicated that the core index (i.e., less food and energy) rose 0.4%. Main contributors to the rise in the core index were shelter costs, motor vehicle insurance, recreational costs, clothing and apparel, and household furniture and goods. Those that decreased, by contrasted, were used cars and trucks, healthcare costs, and airfare.
The shelter index was the single strongest factor in January’s rise in the core CPI. The shelter index alone rose 7.9% compared to last year, which was responsible for roughly 60% of the total upward pressure on January 2023’s CPI less food and energy.
In sum, while continuing a multi-month downtrend in overall inflation, January 2023’s CPI report was higher than many market watchers expected.
Want to learn more about how inflation is impacting the economy? Take a look at our calculator widget to keep tabs on how the CPI is impacting your financial life, and don’t forget to subscribe to our monthly newsletter if you haven’t already.
Source Cited: https://www.bls.gov/news.release/cpi.nr0.htm
by Sarah Bauder | Jan 12, 2023 | CPI
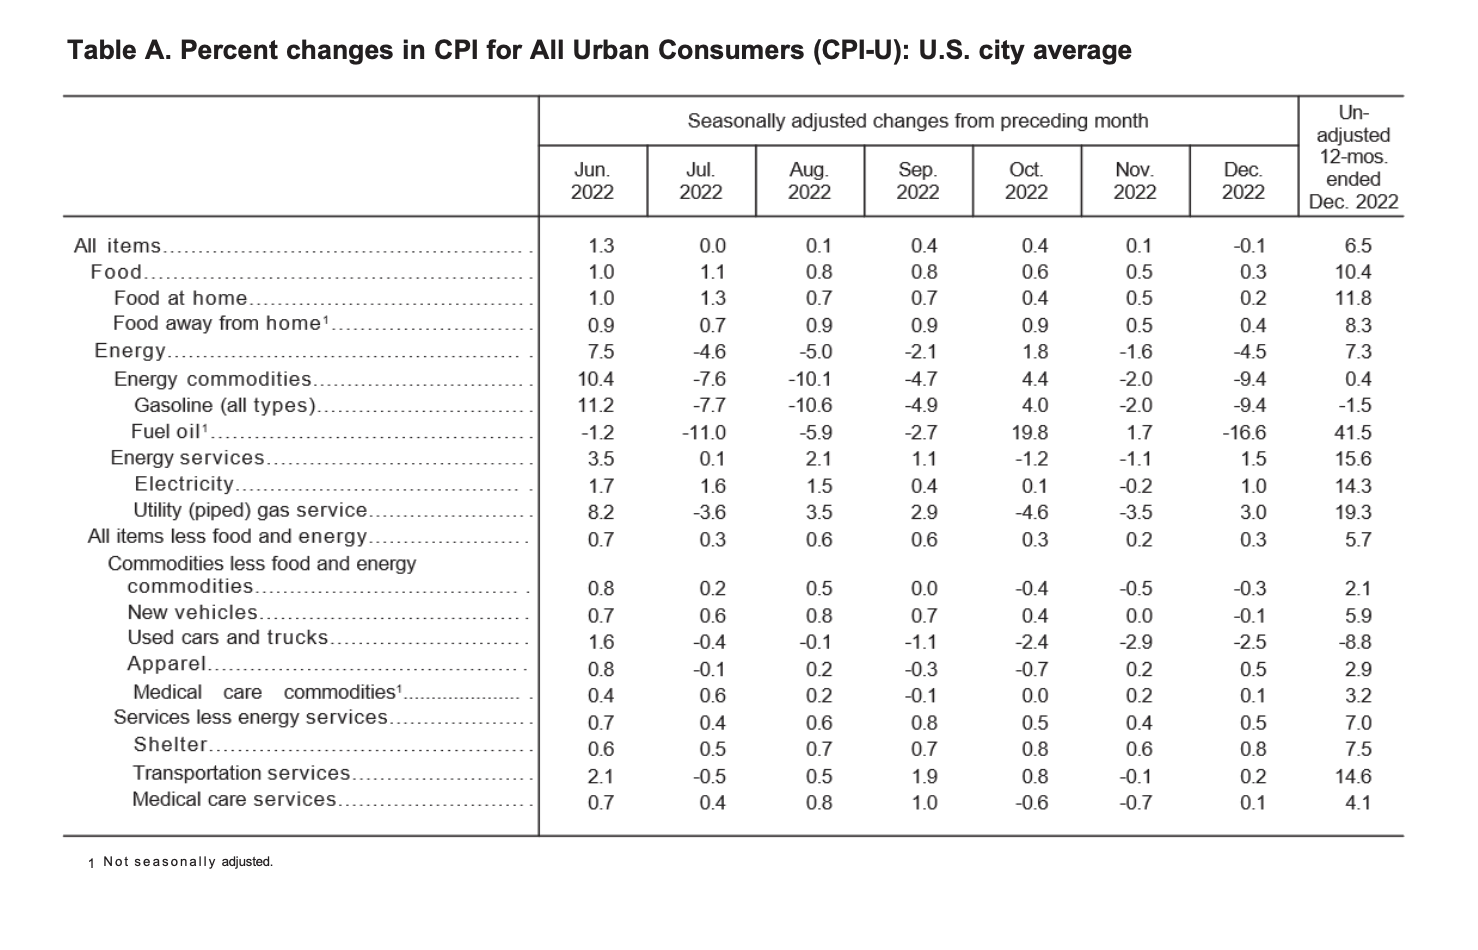
The Consumer Price Index for All Urban Consumers (CPI-U) decreased by 0.1% on a seasonally adjusted basis, reported the Bureau of Labor Statistics. Year-over-year, before seasonal adjustment the all items index grew by 6.5%.
The primary contributing variable to the deceleration in inflation was the drop in the price of gasoline. The price of foodstuffs at grocery stores increased, as did shelter costs, albeit at a slower pace.
Despite the fact that inflation in the United States appears to be slowing down, the Federal Reserve has indicated that more interest rate hikes will transpire into 2023 to curtail the soaring cost of living.
(Source: U.S. Bureau of Labor Statistics)
Food
In December, the index for food rose by 0.3%, after a 0.5% increase from the previous month. Over the last 12-month span, American consumers have paid 11.8% more for food items from grocery stores.
Grocery items that saw price increases in December included meats, poultry, fish, and eggs. Conversely, the prices for fresh fruits and vegetables and bakery products declined. Moreover, American consumers paid more to dine out in restaurants in December.
Gasoline Prices
In December, American consumers again paid less to gas up their vehicles. The price of gasoline dropped by 9.4% over the month, after the 2% decrease seen in November.
In December, prior to seasonal adjustment, the price of gasoline declined 12.5%.
Since this time last year, gasoline prices have decreased by 1.5%.
Energy
In December, the index for energy dropped 4.5%. This was primarily due to the decline in gasoline prices. However, American consumers paid 3% more for natural gas and 1% more for electricity over the month.
Year-over-year, the index for energy grew by 7.3%. Since this time last year, fuel oil prices surged by 41.5%. Likewise, American consumers paid 19.3% more for natural gas and 14.3% more for electricity over the last 12-month period.
(Source: U.S. Bureau of Labor Statistics)
All Items Less Food and Energy
In December, the all items less food and energy index edged up 0.3%. Unfortunately, American consumers continued to pay more shelter costs. The index for shelter rose 0.8% over the month.
Both the index for rent and the index for owners’ equivalent rent (which is correlated to the value of housing prices) increased by 0.8%, respectively.
“The shelter index was the dominant factor in the monthly increase in the index for all items less food and energy, while other components were a mix of increases and declines,” explained the Bureau of Labor Statistics in its monthly report.
Over the last 12-month period, the composite index for shelter increased by 7.5% – the most significant contributor to the overall percentage increase of the all items less food and energy index.
Other composite indexes that saw percentage increases since this time last year include furnishings and operations (+6.7%), new vehicles (+5.9%), recreation (+5.1%), and medical care (+4.0%).
Year-over-year, the all items less food and energy index increased by 5.7%.
Want to learn more about how inflation is impacting the economy? Have a look at our table highlighting information regarding the 2022 CPI and Inflation Rate for the United States, try our calculator widget, and subscribe to our newsletter.
Source Cited: https://www.bls.gov/news.release/cpi.nr0.htm
by Sarah Bauder | Dec 13, 2022 | CPI
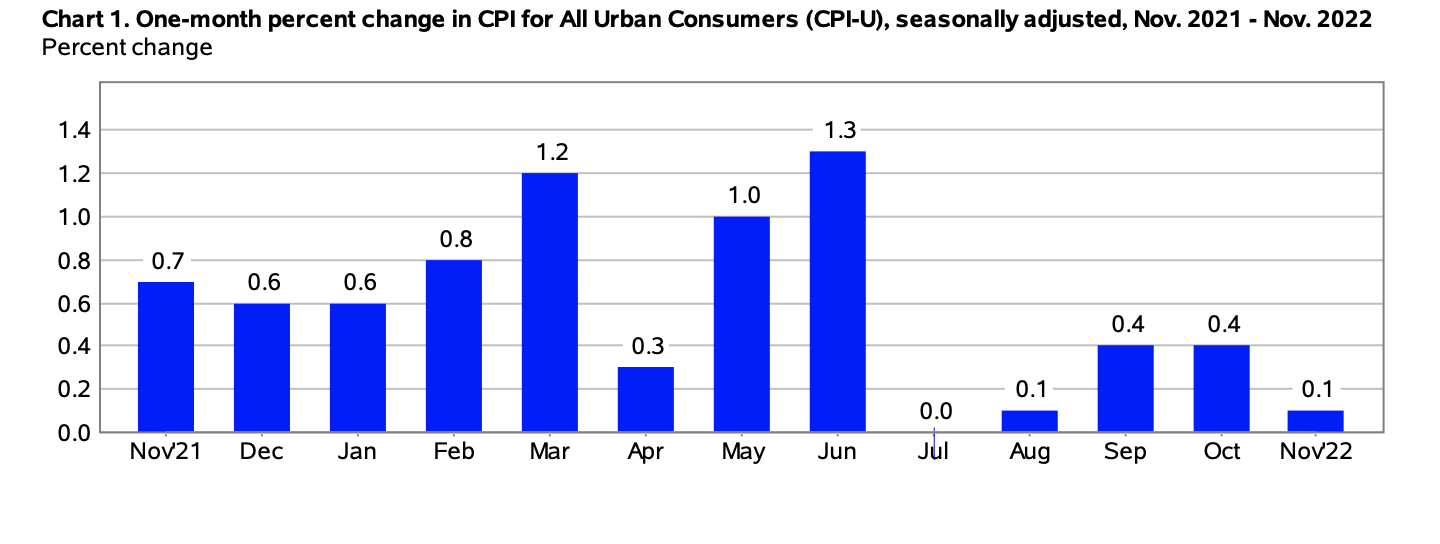
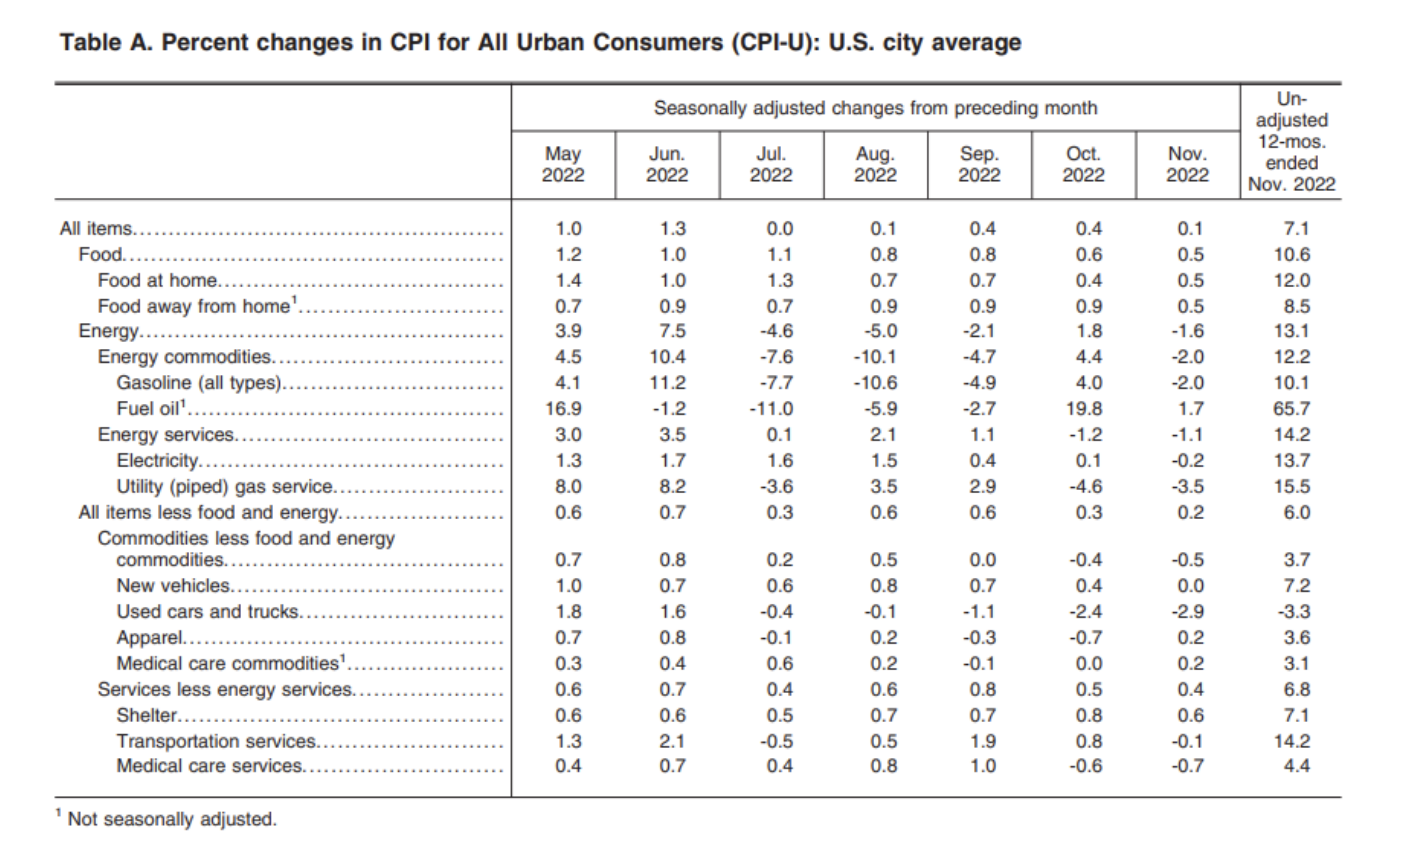
The Consumer Price Index for All Urban Consumers (CPI-U) rose by 0.1% on a seasonally adjusted basis in November, reported the U.S. Bureau of Labor Statistics. Year-over-year, prior to seasonal adjustment the all items index rose 7.1%.
The primary factor for the percentage increase seen in November was the rise in the shelter index. In addition, the cost of foodstuffs at grocery stores increased, while energy costs declined over the month.
“The index for shelter was by far the largest contributor to the monthly all items increase, more than offsetting decreases in energy indexes,” explained the Bureau of Labor Statistics in its monthly report.
For American consumers, this means that they paid more for shelter costs and foodstuffs at grocery stores. Despite the fact that inflation decelerated in November, many Americans are finding it challenging to meet their daily needs.
In November, based on the data inflation cooled in the United States. For its part, the Fed is expected to slow its interest rate hikes in December.
(Source: U.S. Bureau of Labor Statistics)
Food
In November, the index for food rose 0.5%. Moreover, foodstuffs purchased from a grocery store (the food at home index) increased 0.5% over the month. Over the last 12-month period, American consumers paid 12% more for food from grocery stores.
Grocery items that were the main contributors to the overall rise in the index included fruits and vegetables, cereal products, bakery products, and nonalcoholic beverages. Conversely, the composite index for meats, poultry, fish, and eggs dropped 0.2%, the index for beef fell 0.8%, and the pork index dropped 0.3%, respectively, in November.
The Price of Gasoline
American consumers paid less for gasoline at the pumps over the month. The price of gasoline declined by 2% in November, after the 4% rise seen the previous month.
In November, prior to seasonal adjustment, the price of gasoline dropped 3.6%.
Year-over-year, the price of gasoline has risen by 10.1%.
(Source: U.S. Bureau of Labor Statistics)
Energy
In November, the index for energy declined 1.6%, largely because of the decrease in the respective prices of gasoline, natural gas, and electricity.
American consumers paid 3.5% less for natural gas, and 0.2% less for electricity over the month.
Since this time last year, the index for energy grew by 13.1%. Year-over-year, the price of fuel oil skyrocketed an astounding 65.7%. In addition, American consumers paid 15.5% more for natural gas and 13.7% more for electricity since this time last year.
All Items Less Food and Energy
In November, the all items less food and energy index edged up 0.2%. Americans continued to pay more shelter themselves, as the index rose 0.6% over the month.
Furthermore, rent prices also increased by 0.8%, and the index for owners’ equivalent rent, which is correlated to the value of housing prices, rose 0.7% over the month.
The US Bureau of Labor Statistics noted that the index for shelter was the primary factor for the monthly rise in the percentage of the all items less food and energy index.
Year-over-year, the all items less food and energy index increased by 6%. Over the last 12-month span, the composite index for shelter rose 7.1%. Additionally, the index for medical care grew by 4.2% and new vehicles cost American consumers 7.2% more since thos time last year.
Want to learn more about how inflation is impacting the economy? Here is our table highlighting the 2022 CPI and Inflation Rate for the United States, try our U.S. inflation calculator, and subscribe to our newsletter.
Source Cited: https://www.bls.gov/news.release/archives/cpi_12132022.htm
by Sarah Bauder | Nov 10, 2022 | CPI
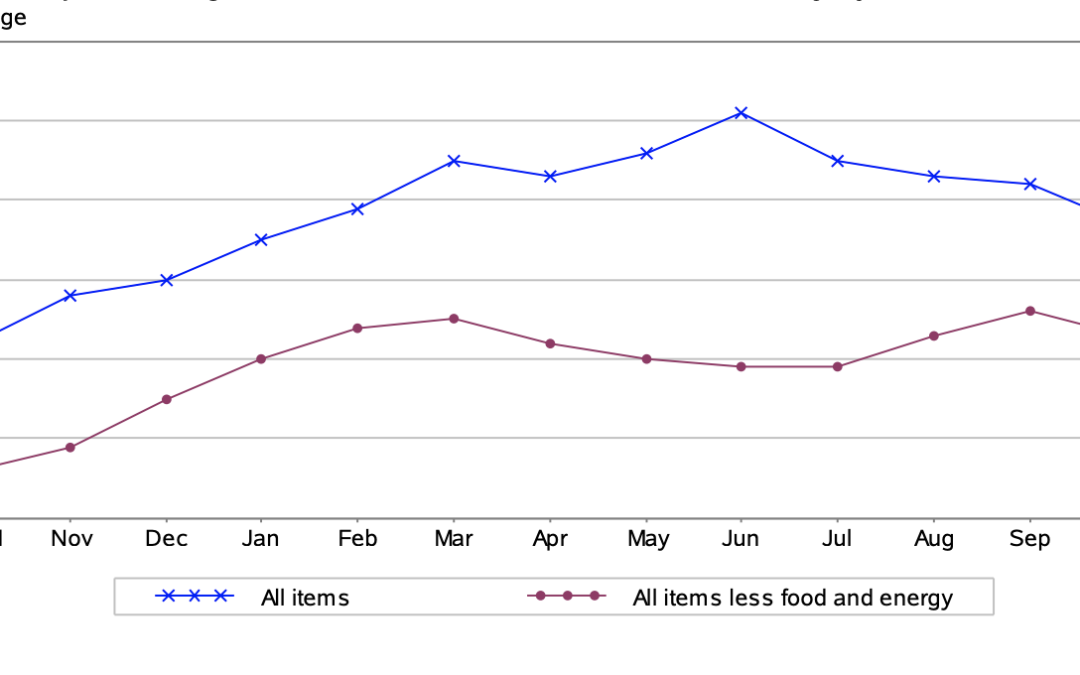
The Consumer Price Index for All Urban Consumers (CPI-U) edged up by 0.4% on a seasonally adjusted basis in October, reported the U.S. Bureau of Labor Statistics. This is the identical percentage increase seen in September. Year-over-year, prior to seasonal adjustment the all items index rose by 7.7%.
The primary contributors to the percentage rise seen in October were a rise in shelter costs, food, and the price of gasoline.
“The index for shelter contributed over half of the monthly all items increase, with the indexes for gasoline and food also increasing,” explained the Bureau of Labor Statistics in its monthly report.
For American consumers, this means they paid more for shelter costs, and food items at grocery stores, in addition to paying more at the gas pumps. Ultimately, this denotes that many Americans are still contending with meeting basic daily needs.
Despite the fact that core inflation decelerated in October, nonetheless, the Federal Reserve increased interest rates to their highest levels since 2008.
(Source: U.S. Bureau of Labor Statistics)
Food
In October, the index for food rose 0.6%. The index for food at home, which indicates foodstuffs at grocery stores increased by 0.4%. It should be noted that this marks the lowest monthly percentage increase seen since December 2021.
Since this time last year, American consumers have paid more for food items bought at grocery stores, as the index for food at home increased by 12.4%. Year-over-year, grocery items that were the main contributors to the overall increase in the index included cereals and bakery products, dairy and related products, in addition to meats, poultry, fish, and eggs.
Gas Prices
American consumers paid more at the gas pumps in October. Gas prices increased by 4% in October, after consumers enjoyed a bit of respite with lower prices for gasoline seen over the previous three months.
In October, prior to seasonal adjustment, the price of gasoline increased by 3.1%.
Over the last 12-month period, the price of gasoline rose by 17.5%.
(Source: U.S. Bureau of Labor Statistics)
All Items Less Food and Energy
In October, the all items less food and energy index increased 0.3%. American consumers continued to pay more for shelter, as the index grew 0.8% over the month. It should be noted that this is the largest monthly rise in shelter costs since August 1990.
Furthermore, rent prices also rose 0.7%, as did the index for owners’ equivalent rent by 0.6%, which is correlated to the value of housing prices.
Conversely, Americans paid less for medical costs in October. The index for medical care dropped 0.5%. Over the month, major medical care composite indexes saw percentage declines. The hospital services index fell 0.2%, and the price of prescription drugs dropped 0.1%.
Year-over-year, the all items less food and energy index increased by 6.3%. Over the last 12-month span, 6.9%. Likewise, the index for medical care increased by 5% since this time last year.
Want to learn more about how inflation is impacting the economy? Here is our table highlighting the 2022 CPI and Inflation Rate for the United States, try our U.S. inflation calculator, and subscribe to our newsletter.
Source Cited: https://www.bls.gov/news.release/archives/cpi_11102022.htm
by Sarah Bauder | Oct 13, 2022 | CPI
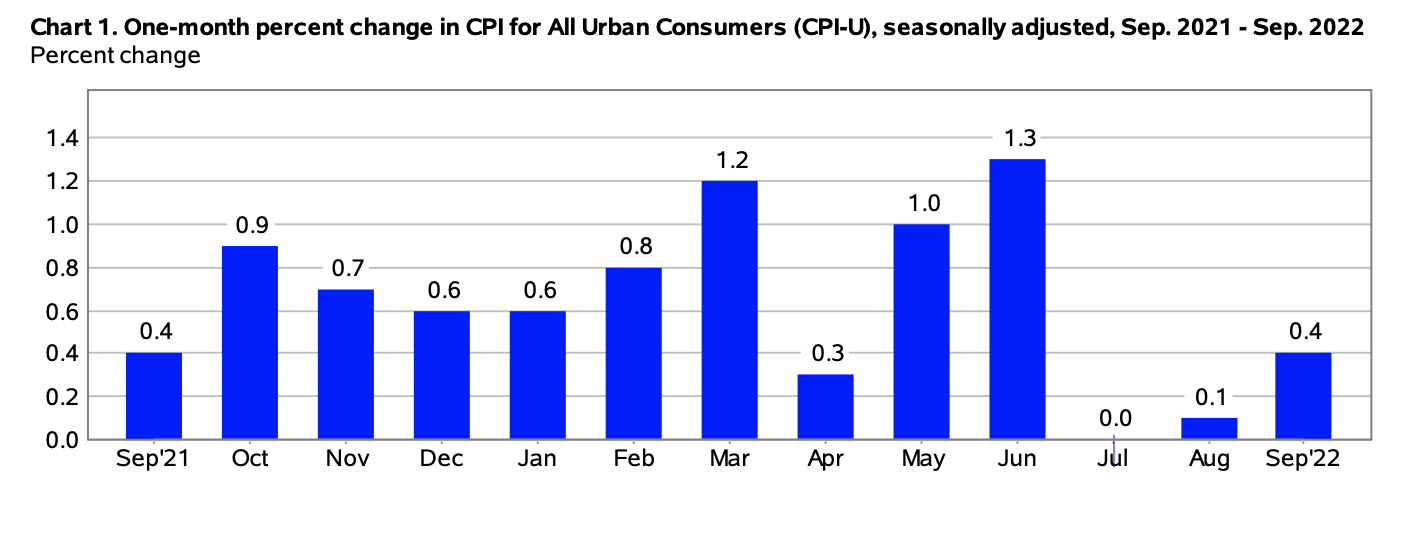
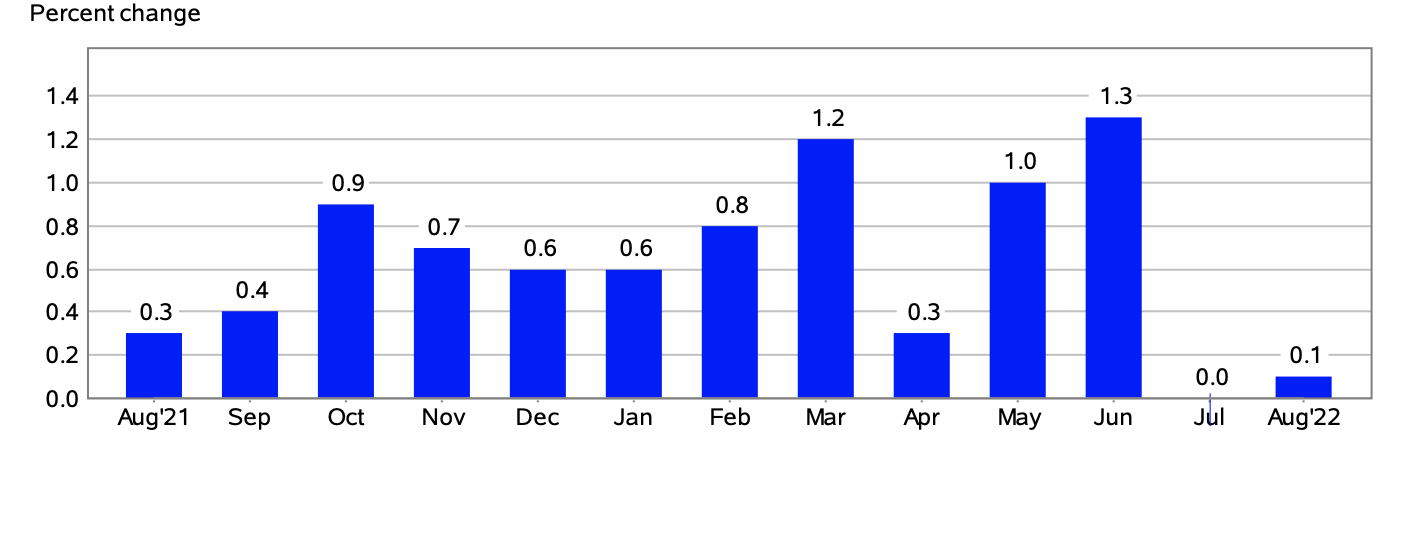
The Consumer Price Index for All Urban Consumers (CPI-U) increased 0.4% on a seasonally adjusted basis, reported the Bureau of Labor Statistics. Year-over-year, before seasonal adjustment the all items index grew by 8.2%.
The primary reason for the percentage increase seen in September was the food, shelter, and medical care indexes. However, a 4.9% decline in gas prices compensated for the percentage rise seen in other indexes.
For American consumers, unfortunately, this means an increase in the prices of foodstuffs from grocery stores. Likewise, Americans paid more for medical care and shelter costs in September. Although inflation cooled slightly for the month, prices for daily necessities continue to rise. Given this fact, the Federal Reserve has indicated that higher interest rates will remain, until the prices of goods begin to decline.
Energy
In September, the index for energy dropped 2.1%. Americans paid less at the pumps, as gasoline prices decreased over the month. Yet, the natural gas index rose 2.9%, as did the index for electricity, which edged up 0.4% in September.
Over the last 12-month period, the index for energy grew by 19.8%. Year-over-year, fuel oil prices skyrocketed by 58.1%. Furthermore, the price of natural gas soared 33.1%, and electricity prices 15.5% since this time last year.
(Source: U.S. Bureau of Labor Statistics)
Gasoline Prices
In September, American consumers once again paid less at the pumps. The price of gasoline declined 4.9% over the month. This marks the third consecutive monthly drop in the price of gasoline, after the 10.6% drop seen in August, and the 7.7% decrease in July.
In September, prior to seasonal adjustment, gasoline prices declined by 5.6%.
Year-over-year, the price of gasoline rose by 18.2%.
Food
In September, the index for food edged up 0.8%, the identical percentage increase seen in August. Over the last 12-month period, American consumers have paid 13% more for food items from grocery stores.
Foodstuffs that saw the largest price increase in September included fruits and vegetables (1.6%), cereals and bakery products (0.9%), meats, poultry, fish, and eggs (0.4%), and non-alcoholic beverages (0.6%). Furthermore, as in August, American consumers paid more to dine out in restaurants in September.
(Source: U.S. Bureau of Labor Statistics)
All Items Less Food and Energy
In September, the all items less food and energy index increased by 0.6%, the same percentage increase seen the previous month. American consumers continued to pay more shelter costs. The index for shelter rose 0.7% for the month.
The index for rent edged up by 0.8%, as did the index for owners’ equivalent rent, which is correlated to the value of housing prices. Furthermore, Americans paid more for medical care, as the medical care index increased by 0.8% in September. The physicians’ services index rose 0.5%, as did the hospital services index by 0.1%.
Conversely, Americans paid 0.1% less for prescription drugs in September.
Since this time last year, the all items less food and energy index grew by 6.6%. The Bureau of Labor Statistics noted that this was the largest year-over-year rise in the index in 40 years, specifically since August 1982.
Over the last 12-month period, the composite index for shelter increased by 6.6% – contributing to over 40% of the percentage rise in the all items less food and energy index.
Want to learn more about how inflation is impacting the economy? Have a look at our table highlighting information regarding the 2022 CPI and Inflation Rate for the United States, try our calculator widget, and subscribe to our newsletter.
Source Cited: https://www.bls.gov/news.release/archives/cpi_10132022.htm
by Sarah Bauder | Sep 13, 2022 | BLS, CPI
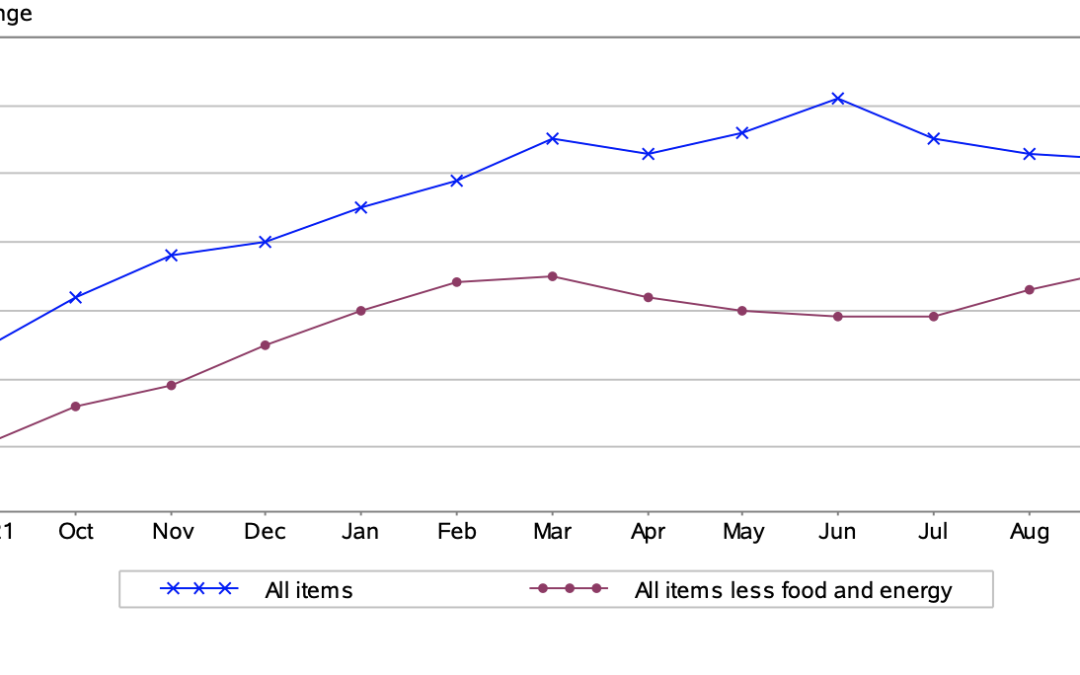
The Consumer Price Index for All Urban Consumers (CPI-U) edged up by 0.1% on a seasonally adjusted basis in August, reported the U.S. Bureau of Labor Statistics. Year-over-year, prior to seasonal adjustment the all items index rose 8.3%.
The principal reason for the percentage increase seen in August was a rise in the food, shelter, and medical care indexes. Conversely, there was a 10.6% decrease in the price of gasoline for the month which counteracted percentage increases seen with other indexes.
“The indexes for shelter, medical care, household furnishings and operations, new vehicles, motor vehicle insurance, and education were among those that increased over the month,” explained the Bureau of Labor Statistics in its monthly report.
For American consumers, this means that they paid more for foodstuffs at the grocery store, shelter costs, and medical care costs among other areas of everyday life. The continued acceleration in inflation means many Americans are still grappling with meeting basic daily needs.
Given the fact that inflation is still at historically high levels, last week the Fed indicated that there would likely be a significant increase in interest rates later this month.
(Source: U.S. Bureau of Labor Statistics)
Food
In August, the index for food rose 0.8%. Since this time last year, American consumers have paid 13.5% more for foodstuffs at grocery stores. It should be noted that this was the highest year-over-year percentage increase seen since May 1979.
Grocery items that were the main contributors to the overall rise in the index included fruits and vegetables, eggs, meat, poultry, fish, cereal products, bakery products, dairy products, and nonalcoholic beverages. In addition, American consumers paid more to dine out at restaurants in August.
The Price of Gasoline
Conversely, American consumers enjoyed a bit of respite at the gas pumps in August. The price of gasoline dropped by 10.6%. This is the second consecutive monthly decline in gas prices following a 7.7% drop at the pumps seen in July.
In August, prior to seasonal adjustment, the price of gasoline dropped by 12.2%.
Over the last 12-month period, gasoline prices soared 25.6%.
Energy
In August, the energy index decreased 5%, largely due to the decline in gas prices. Yet, American consumers paid 1.5% more for electricity over the month. Likewise, the natural gas index also rose by 3.5%.
Since this time last year, the index for energy increased by 23.8%. Year-over-year, the price of fuel oil skyrocketed an astounding 68.8%. Natural gas prices likewise soared 33% since this time last year. In addition, over the last 12-month period, American consumers paid 15.8% more for electricity – the largest year-over-year rise since August 1981.
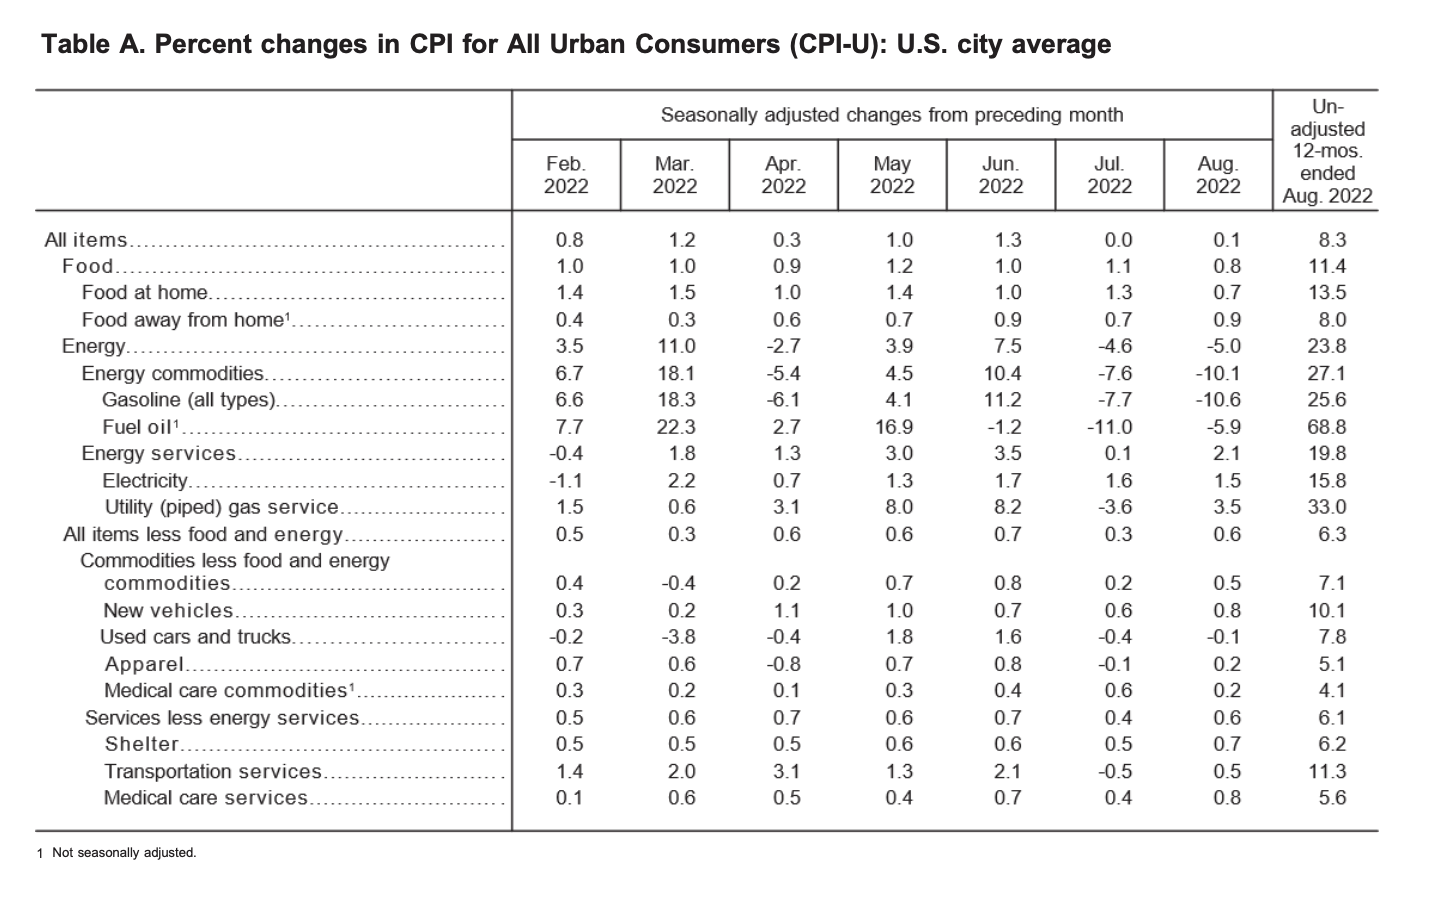
(Source: U.S. Bureau of Labor Statistics)
All Items Less Food and Energy
In August, the all items less food and energy index edged up 0.6%. American consumers continued to pay more for shelter, as the index rose 0.7% over the month.
Rent prices also increased 0.7%, as did the index for owners’ equivalent rent, which is correlated to the value of housing prices.
Moreover, Americans also paid 0.7% more for medical costs over the month. In August, all major medical care composite indexes saw percentage increases. The hospital services index rose 0.7%, the price of prescription drugs grew by 0.4%, and the physicians’ services index also edged up by 0.2%.
Over the last 12-month period, the all items less food and energy index increased by 6.3%. Year-over-year, the composite index for shelter increased by 6.2%, which contributed to roughly 40% of the total growth of the index for all items less food and energy.
Likewise, American consumers paid 5.4% more for medical care since this time last year.
Want to learn more about how inflation is impacting the economy? Here is our table highlighting the 2022 CPI and Inflation Rate for the United States, try our U.S. inflation calculator, and subscribe to our newsletter.
Source Cited: https://www.bls.gov/news.release/archives/cpi_09132022.htm