
Emily Cross Leon
Emily is a Canadian financial blogger with multiple degrees in economics and extensive professional experience as a financial analyst. She was formerly a Ph.D. candidate at the University of Guelph's School of Agricultural Economics. Before that, she received an MA from the University of San Francisco in International Development Economics. She also has a BA in Math with a minor in Economics.
by Emily Cross Leon | Jun 16, 2016 | Definitions
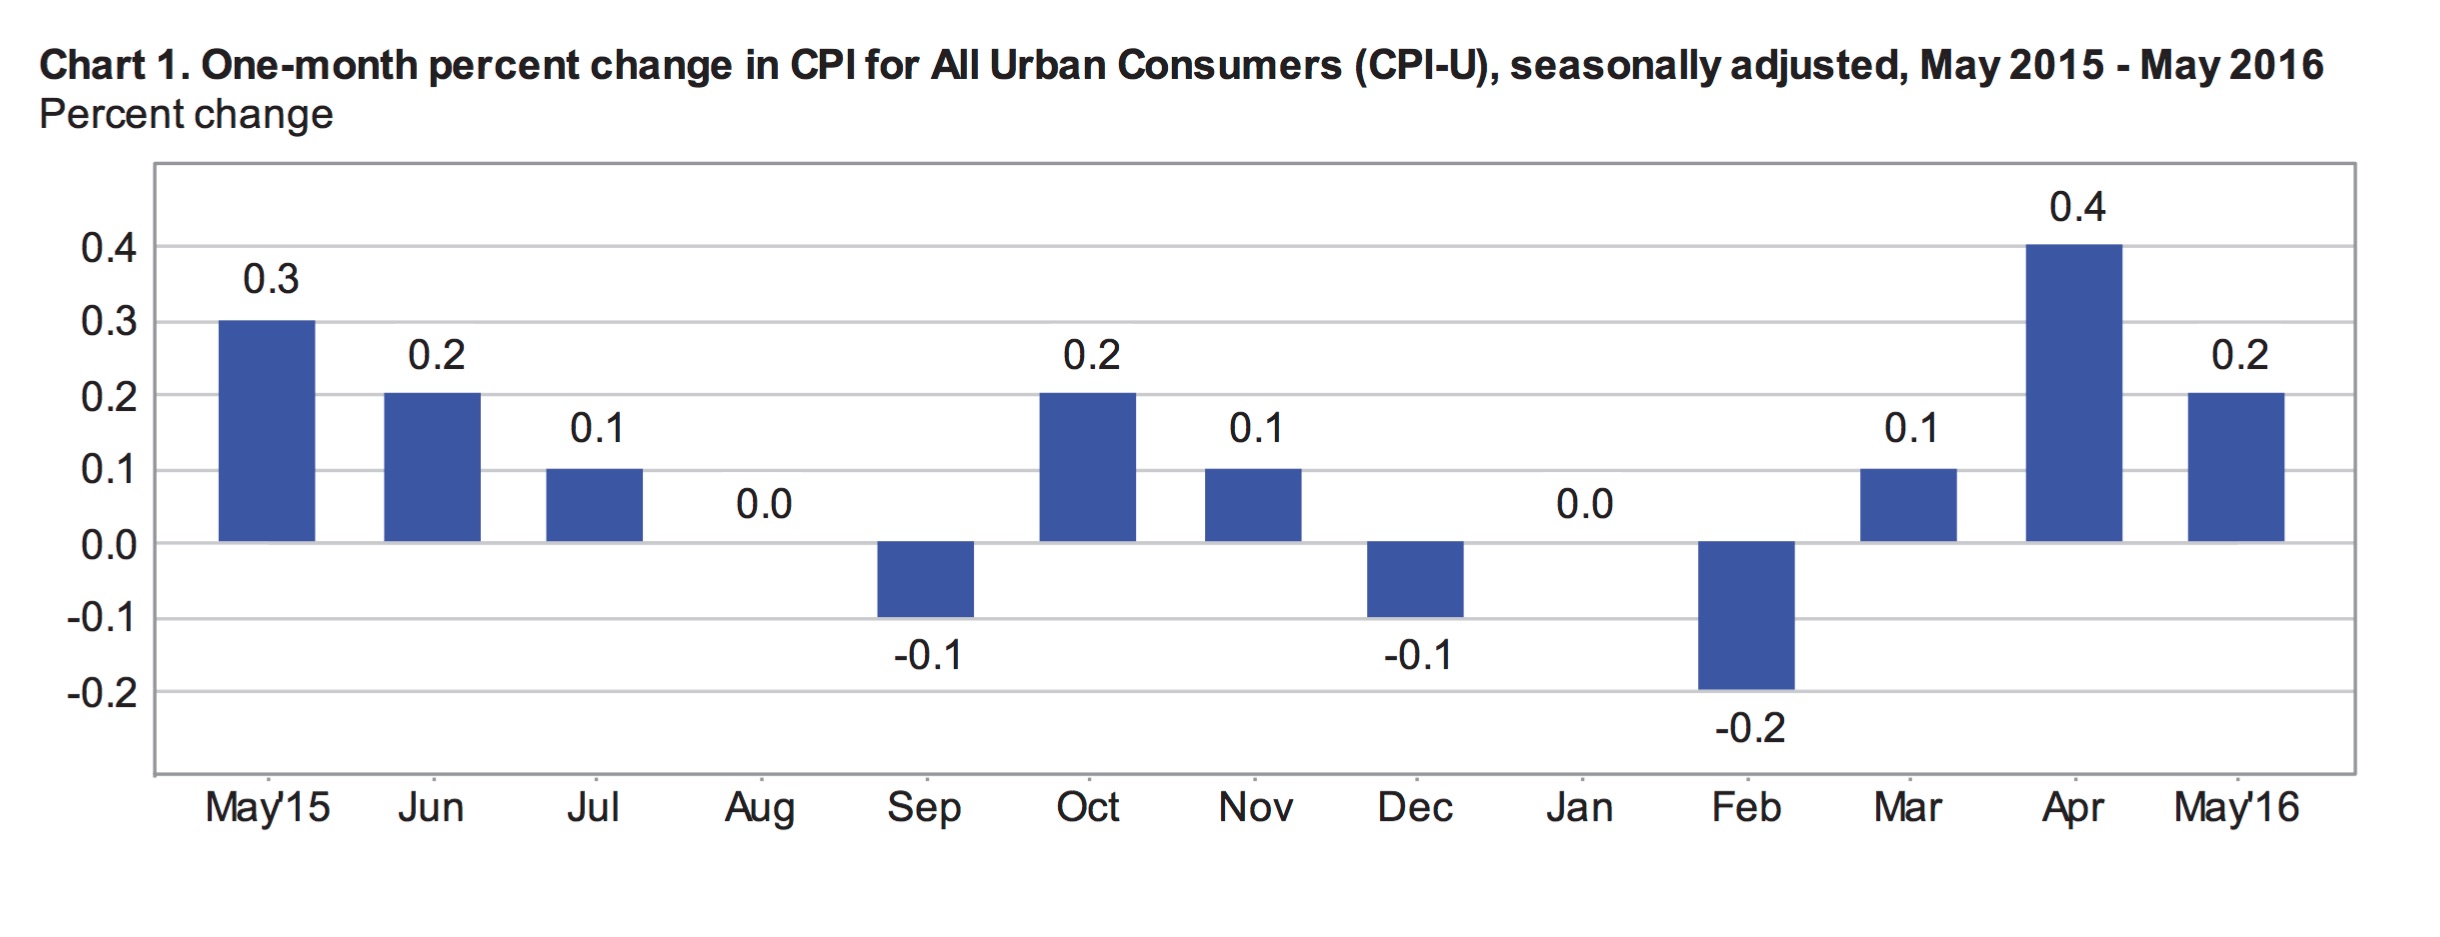
The Consumer Price Index for All Urban Consumers (CPI-U), a popular measure of inflation, climbed 0.4% in May according to today’s monthly report from the Bureau of Labor Statistics. With seasonal adjustments, inflation was 0.2% in May, down from 0.4% in April. Excluding food and energy, the seasonally adjusted index climbed 0.2% in May, matching the previous month’s core inflation reading. Economists surveyed by the WSJ prior to today’s report had expected the CPI to rise 0.3% in May.
For the year ending in May, prior to seasonal adjustments, prices climbed 1.0%, down from 1.1% for the year ending in April. An annual 10.1% decline in the energy index at the end of May had a significant impact on overall inflation. Energy comprises about 6.8% of the total CPI-U. The significant negative impact of falling energy prices is mostly the result of cheap gas (down 16.1% year over year and accounting for nearly 3.1% of the index). Overall food prices were up only 0.7% for the year ending in May. Excluding food and energy, prices climbed an annual 2.2% led by higher shelter and medical costs.
May Inflation
Food prices declined in May to offset higher prices for shelter, medical care and education. Food, which accounts for approximately 14% of the CPI-U is broken down into food at home (around 8%) and food away from home (about 6%). Food at home is divided into 6 major grocery store categories. The prices of food at home declined across the board in May with all six grocery store categories declining. The price of food away from home increased 0.2% in May.
Seasonally Adjusted Monthly % Change in CPI-U by Category (2016)
| January | February | March | April | May | June | July |
| All Items | 0 | -0.2 | 0.1 | 0.4 | 0.2 | 0.2 | 0.0 |
| Food | 0 | 0.2 | -0.2 | 0.2 | -0.2 | -0.1 | 0.0 |
| Energy | -2.8 | -6.0 | 0.9 | 3.4 | 1.2 | 1.3 | -1.6 |
| Gasoline | -4.8 | -12.5 | 2.2 | 8.1 | 2.3 | 3.3 | -4.7 |
| Fuel Oil (non seasonally adjusted) | -6.5 | -2.9 | 1.7 | 1.9 | 6.2 | 3.7 | -1.5 |
| Electricity | -0.7 | -0.2 | 0.4 | -0.3 | -0.2 | -0.5 | 0.5 |
| Utilities (piped gas service) | -0.6 | 1.0 | -0.7 | 0.6 | 1.7 | -0.4 | 3.1 |
| Energy Services | -0.7 | 0.1 | 0.2 | -0.1 | 0.2 | -0.5 | 1.0 |
| All Items Less Food and Energy | 0.3 | 0.3 | 0.1 | 0.2 | 0.2 | 0.2 | 0.1 |
| Services Less Energy Services | 0.3 | 0.3 | 0.2 | 0.3 | 0.4 | 0.3 | 0.2 |
| Shelter | 0.3 | 0.3 | 0.2 | 0.3 | 0.4 | 0.3 | 0.2 |
| Transportation Services | 0.4 | 0.2 | 0.2 | 0.7 | 0.3 | 0.3 | -0.2 |
| Medical Care Services | 0.5 | 0.5 | 0.1 | 0.3 | 0.5 | 0.2 | 0.5 |
The energy index increased by 1.2% in May following a monthly increase of 3.4% in April. Gasoline accounts for nearly half of the energy index. Gas prices were up 2.3% in May following gains of 2.2% and 8.1% in March and April. Within the energy index, electricity was the only component to post a decline in prices in May, down 0.2%.
The index for all items less food and energy was up 0.2% in May, matching the growth rate in April. Shelter is the major component in this index, accounting for over 40%. The price of shelter has grown steadily in recent months and continued this trend, posting a 0.4% increase in May following increases of 0.2% and o.4% in March and April.
12-Month Inflation
For the year ending in May, the CPI-U grew 1.0% following an annual rate of 1.1% in April. Inflation remains well below the Fed’s target as the energy index continues to quell annual numbers. The price of food has also failed to spark much inflation, climbing 0.7% over the 12-months ending in May. Stripping out food and energy, overall prices were up 2.2% year over year.
Shelter prices were a major contributor to inflation for the year as the cost of rent for primary residences increased 3.8% and the index measuring owners equivalent of rent grew 3.3%. Within the shelter index, water and sewer and trash collection services saw prices grow 4.1% over the relevant year.
Medical care service costs were reportedly 3.5% more expensive in May compared to a year earlier. Higher prices for prescription drugs, up 3.3% contributed to this but were buffered by lower prices for non prescription drugs, down 1.3% for the year. Over this period, the price of health insurance also grew 6.3%.
Motor vehicle insurance costs increased 6.6% for the year ending in May, pulling the transportation services index up an annual 3.2%. Within transportation services, the cost of airline fares dropped 3.1% year over year and the index for car and truck rentals grew 4.9% annualy. Over the same period, new vehicle prices slipped o.2% and the cost of used vehicles declined 2.3%.
Inflation by Region
May’s inflation was distributed relatively equitably across the country and across different size cities. At 0.3%, inflation was slightly below the national average. Northeastern states posted slightly higher inflation in May at 0.6% compared to 0.4% in the midwest and south and 0.5% in western urban areas. For the year, inflation was significantly higher in western states at 1.5% compared to a national average of 1%.
Over the year, inflation was lowest in medium size urban areas (populations between 50,000 and 1.5 million) at 0.6%. Larger and smaller sized cities saw prices growing much faster.
| Urban Population | 12-month | August |
| over 1.5 million | 1.3% | 0.1% |
| 50,000 to 1.5 million | 0.7% | 0.1% |
| under 50,000 | 0.8% | -0.1% |
| Urban Regions | 12-month | August |
| Northeast | 1.1% | 0.1% |
| Midwest | 0.6% | 0.1% |
| South | 1.0% | 0.1% |
| West | 1.6% | 0.1% |
Outlook
Today’s report comes on the back of the FOMC’s mid June meeting. The unanimous decision to leave rates unchanged at 0.25%-0.5% was the result of disappointing economic data, a stagnant labor market and uncertainty related to the looming possibility of Britain voting to exit the EU. The fed also lowered their interest rate projections for 2017 and 2018 but left open the possibility of another rate hike in 2016, possibly as early as next month.
by Emily Cross Leon | May 17, 2016 | Definitions
Headline inflation, measured by the Consumer Price Index for All Urban Consumers (CPI-U), was 0.5% in April according to today’s report from the US Bureau of Labor Statistics. With seasonal adjustments, prices were up 0.4%, the highest monthly rate since February 2013 and slightly above what markets had expected. A Bloomberg survey of economists showed a large range in inflation expectations for April, from 0.2% to 0.7%.
Overall, price levels were 1.1% higher for the year ending in April compared to 0.9% for the year ending in March. While annual inflation remains significantly below the Fed’s 2% target, core measurements suggest the US economy is slowly strengthening. Core annual inflation was 2.1% in April and 2.2% in March.
April’s Inflation
Inflation was broad based in April as the food and energy indexes both increased, as did the index for all items less food and energy. Prices at the pump were the main contributor to monthly inflation, up 8.1% with seasonal adjustments and 9.1% without adjustments. The energy index, which accounts for approximately 6.6% of the CPI-U and includes gasoline, climbed 3.4% in April.
Seasonally Adjusted Monthly % Change in CPI-U by Category (2016)
| January | February | March | April | May | June | July |
| All Items | 0 | -0.2 | 0.1 | 0.4 | 0.2 | 0.2 | 0.0 |
| Food | 0 | 0.2 | -0.2 | 0.2 | -0.2 | -0.1 | 0.0 |
| Energy | -2.8 | -6.0 | 0.9 | 3.4 | 1.2 | 1.3 | -1.6 |
| Gasoline | -4.8 | -12.5 | 2.2 | 8.1 | 2.3 | 3.3 | -4.7 |
| Fuel Oil (non seasonally adjusted) | -6.5 | -2.9 | 1.7 | 1.9 | 6.2 | 3.7 | -1.5 |
| Electricity | -0.7 | -0.2 | 0.4 | -0.3 | -0.2 | -0.5 | 0.5 |
| Utilities (piped gas service) | -0.6 | 1.0 | -0.7 | 0.6 | 1.7 | -0.4 | 3.1 |
| Energy Services | -0.7 | 0.1 | 0.2 | -0.1 | 0.2 | -0.5 | 1.0 |
| All Items Less Food and Energy | 0.3 | 0.3 | 0.1 | 0.2 | 0.2 | 0.2 | 0.1 |
| Services Less Energy Services | 0.3 | 0.3 | 0.2 | 0.3 | 0.4 | 0.3 | 0.2 |
| Shelter | 0.3 | 0.3 | 0.2 | 0.3 | 0.4 | 0.3 | 0.2 |
| Transportation Services | 0.4 | 0.2 | 0.2 | 0.7 | 0.3 | 0.3 | -0.2 |
| Medical Care Services | 0.5 | 0.5 | 0.1 | 0.3 | 0.5 | 0.2 | 0.5 |
The price of food was up 0.2% in April following a decline of that amount in March. The index for food at home increased 0.1% while the index for food away from home was up 0.2%. Within the food index, the most notable changes in April include; the price of eggs, down 6.3% and the price of tomatoes, down 4.7%. The index for fruits and vegetables also slipped 0.5% on a seasonally adjusted basis in April after declining 1.9% in March.
The index for all items less food and energy was up 0.2% in April after increasing 0.1% in March. This measure of core inflation eliminates items with highly volatile prices and is a good indicator of underlying price trends. According the current composition of the CPI, the index for all items less food and energy represents about 79.5% of overall consumer spending.
Within the core index, prices in April were 0.4% lower for household furnishings and supplies and 0.3% lower for apparel. Over the same period, the price of medical care commodities grew 0.4%, with prescription drug prices up 0.7% and nonprescription drug prices up 0.4%. The index for medical care services was 0.3% higher as the price of visiting dentists and eye doctors both increased by 0.7% in April. The cost of health insurance was 0.4% higher, following an increase of the same amount in March.
The index for transportation services, which is included in the core index, posted a seasonally adjusted inflation rate of 0.7%. This was largely driven by a 1.2% spike in the cost of motor vehicle insurance, although prices were higher across the board within transpiration services. The indexes for new and used vehicles, which are not included in transportation services but are part of the core index, both fell by 0.3% in April.
12-Month Inflation
The CPI-U grew 1.1% for the year ending in April despite a 8.9% decline in energy prices. For the year, the price of fuel oil declined 27.5%, and gas prices were 13.8% lower. The index for energy commodities dropped 14.2% compared to the index for energy services, which was only down 3.1% year over year.
Overall, food prices were up 0.9% over the 12 months ending in April. However, the price of food at home declined 0.3% while the price of food away from home increased by 2.7%.
The index for all items less food and energy gained 2.1% for the year. Within this index, commodities (commodities less food and energy commodities) declined 0.5%. Over the same year, the price of services (services less energy services) increased by 3.0%.
Inflation by Region
Inflation was distributed equitably across geographical regions in April. Prices grew marginally more in the Northeast, up 0.6% compared to the midwest, south and west (up 0.5%, 0.4% and 0.4% respectively). However, for the year ending in April, the western states recorded significantly higher inflation than the rest of the US, 1.8% compared a national average inflation rate of 1.1%.
Inflation was also stronger in bigger cities over the year ending in April. The average inflation rate for cities with populations over 1.5 million was 1.4% compared to 0.7% for cities with populations between 50,000 and 1.5 million. Large west coast cities were a major contributor to inflation over the past year. San Francisco, Seattle and Los Angeles recorded respective inflation rates of 2.7%, 2.5% and 2.0% – all well above the national average.
| Urban Population | 12-month | August |
| over 1.5 million | 1.3% | 0.1% |
| 50,000 to 1.5 million | 0.7% | 0.1% |
| under 50,000 | 0.8% | -0.1% |
| Urban Regions | 12-month | August |
| Northeast | 1.1% | 0.1% |
| Midwest | 0.6% | 0.1% |
| South | 1.0% | 0.1% |
| West | 1.6% | 0.1% |
Outlook
Today’s inflation report suggests the economy is moving in the right direction and increases the likelihood of rate hikes in the near future. Prior to today’s report, rate hikes had not been anticipated until at least December. However, there has been a lack of consensus among members the Fed regarding the current state of the US economy and the risks posed by turmoil in global markets. Today’s report suggests that the domestic economy is moving forward and tightening or raising rates to reign in growth and prevent bubbles, may be prudent. The Fed meets next on June 14th and 15th and there will likely be more agreement regarding the need to increase interest rates.
by Emily Cross Leon | Apr 14, 2016 | Definitions
Today’s inflation data will be a disappointment to the Federal Reserve as it does not support their intention to raise interest rates in the near term. In the absence of healthy underlying price pressure, the case for economic tightening is weak. According to this morning’s report from the Bureau of Labor Statistics, inflation appears more sluggish than expected.
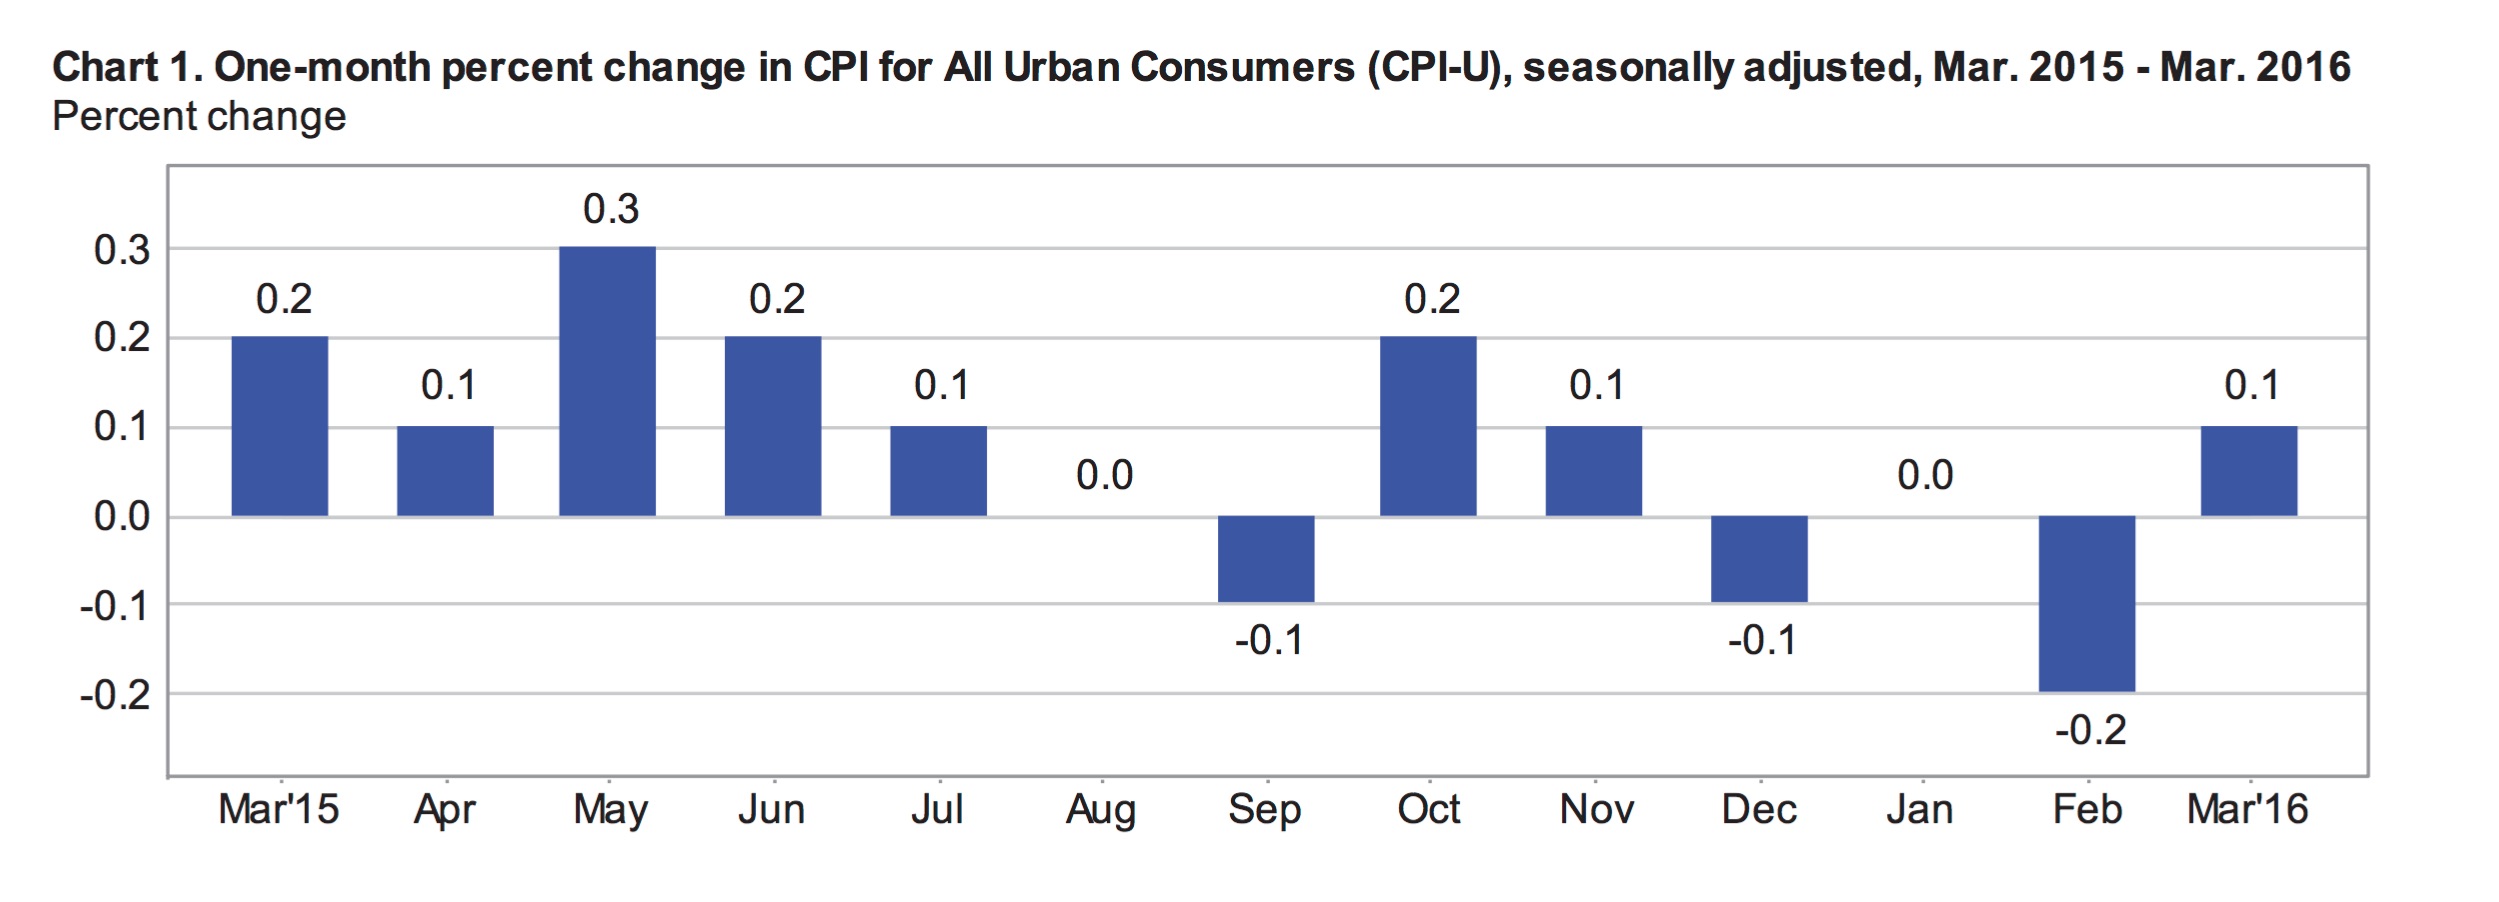
Headline inflation, as measured by the Consumer Price Index for All Urban Consumers (CPI-U) inched up 0.1% in March on a seasonally adjusted basis and 0.4% without adjustments. For the year ending in March, the CPI-U was up 0.9%, significantly below expectations, which were closer to 1.2% and well below the Fed’s 2% target rate.
Seasonally Adjusted Monthly Inflation
Data was mixed across economic sectors in March as declining food prices largely offset higher energy prices.
The food index fell 0.2% in March to wipe out February’s 0.2% increase in the price of food. Food at home decline 0.5% compared to an increase of 0.2% for the previous month. This is the largest monthly decline in food prices in nearly 7 years. Prices at the grocery store were basically down across the board with the index for ‘other food at home’ being the only one of the six grocery store categories to post higher prices in March. The most significant monthly declines were in prices for eggs, down 5.2% and for fresh fruits and vegetables, down 2.4%. On the other hand, the index for food away from home was up 0.2% in March.
The energy index was higher in March, up 0.9% on a seasonally adjusted basis following a 6.0% drop in February. Higher gas prices, up 2.2% with seasonal adjustments and 10.2% without adjustments, pushed the energy index into positive territory for the month. The gasoline index is still down 20.9% for the year. The transportation index (transportation commodities less motor fuel) fell 0.1% in March.
Prices for many retail consumer discretionary goods weakened in March. The price of household furnishings and supplies dropped 0.2% including a 0.8% decline in the index for appliances. The apparel index was down 1.1% for the month following an increase of 1.6% in February. Recreational commodity prices dropped 0.3% compared to a decline of 0.5% the previous month.
Prices for services pushed higher in March, the index for services less energy services was up 0.2% following three consecutive monthly increases of 0.3%. This index includes shelter, medical care services and transportation services. Shelter prices continued to rise, gaining 0.2% in March. However, the index for lodging away from home fell 1.8% for the month due to declines in hotel and motel rates.
Medical care service prices were 0.1% higher in March, cooling after two month of 0.5% growth. While the cost of health insurance increased 0.4%, most other medical care service costs slipped marginally throughout the month. Transportation services were 0.2% higher including a jump of 2.2% in the index for car and truck rentals.
Seasonally Adjusted Monthly % Change in CPI-U by Category (2016)
| January | February | March | April | May | June | July |
| All Items | 0 | -0.2 | 0.1 | 0.4 | 0.2 | 0.2 | 0.0 |
| Food | 0 | 0.2 | -0.2 | 0.2 | -0.2 | -0.1 | 0.0 |
| Energy | -2.8 | -6.0 | 0.9 | 3.4 | 1.2 | 1.3 | -1.6 |
| Gasoline | -4.8 | -12.5 | 2.2 | 8.1 | 2.3 | 3.3 | -4.7 |
| Fuel Oil (non seasonally adjusted) | -6.5 | -2.9 | 1.7 | 1.9 | 6.2 | 3.7 | -1.5 |
| Electricity | -0.7 | -0.2 | 0.4 | -0.3 | -0.2 | -0.5 | 0.5 |
| Utilities (piped gas service) | -0.6 | 1.0 | -0.7 | 0.6 | 1.7 | -0.4 | 3.1 |
| Energy Services | -0.7 | 0.1 | 0.2 | -0.1 | 0.2 | -0.5 | 1.0 |
| All Items Less Food and Energy | 0.3 | 0.3 | 0.1 | 0.2 | 0.2 | 0.2 | 0.1 |
| Services Less Energy Services | 0.3 | 0.3 | 0.2 | 0.3 | 0.4 | 0.3 | 0.2 |
| Shelter | 0.3 | 0.3 | 0.2 | 0.3 | 0.4 | 0.3 | 0.2 |
| Transportation Services | 0.4 | 0.2 | 0.2 | 0.7 | 0.3 | 0.3 | -0.2 |
| Medical Care Services | 0.5 | 0.5 | 0.1 | 0.3 | 0.5 | 0.2 | 0.5 |
12-Month Inflation
Prices pushed up 0.9% over the 12-months ending in March, slowing slightly from 1% in February. Core inflation (all items less food and energy) was 2.2% over the 12-month period. Food prices climbed 0.8% over this period. The cost of food at home declined by 0.5%, while the price of food away from home increased by 2.7%.
The energy index was down 12.6% year over year in March. Energy accounts for about 6.4% of the CPI-U. Energy commodity prices fell an annual 21.2% in March, including a 34.8% drop in the cost of fuel oil and a 20.9% drop in gasoline prices. The index for energy services fell 3.3% year over year.
The price of retail goods such as furniture (down 1.2%), appliances (down 3.4%) and apparel (down 0.6%) were lower for the year. The index measuring the price of toys also fell significantly, down 7.6% since March of last year. Over this period, the index for medical care commodities increased by 2.4% including an annual increase of 3.6% in the price for prescription drugs.
Regional Inflation
Across the country, inflation has been higher in cities with over 1.5 million residents and fewer than 50,000 residents compared to mid-size urban areas. Inflation has also been significantly stronger in western states over the past year. Prices climbed 1.7% in the Los Angeles area but dropped 0.2% in Cleveland year over year.
| Urban Population | 12-month | August |
| over 1.5 million | 1.3% | 0.1% |
| 50,000 to 1.5 million | 0.7% | 0.1% |
| under 50,000 | 0.8% | -0.1% |
| Urban Regions | 12-month | August |
| Northeast | 1.1% | 0.1% |
| Midwest | 0.6% | 0.1% |
| South | 1.0% | 0.1% |
| West | 1.6% | 0.1% |
Outlook for the Federal Reserve
There is growing evidence that the US economy is on solid ground and the Federal Reserve is waiting for the opportunity to continue raising interest rates. However, raising rates without clear evidence of inflationary pressure would be imprudent. The growing domestic economy now faces headwinds from slow growth abroad, especially in China. If the dollar continues to fall, prices of imported goods will climb and inflation could tick up in the coming months. Also, oil prices will eventually rebound, which will contribute to higher rates of inflation in the US. The fed will likely wait for evidence of these price pressures before reigning in economic growth by hiking interest rates.
by Emily Cross Leon | Mar 16, 2016 | Definitions
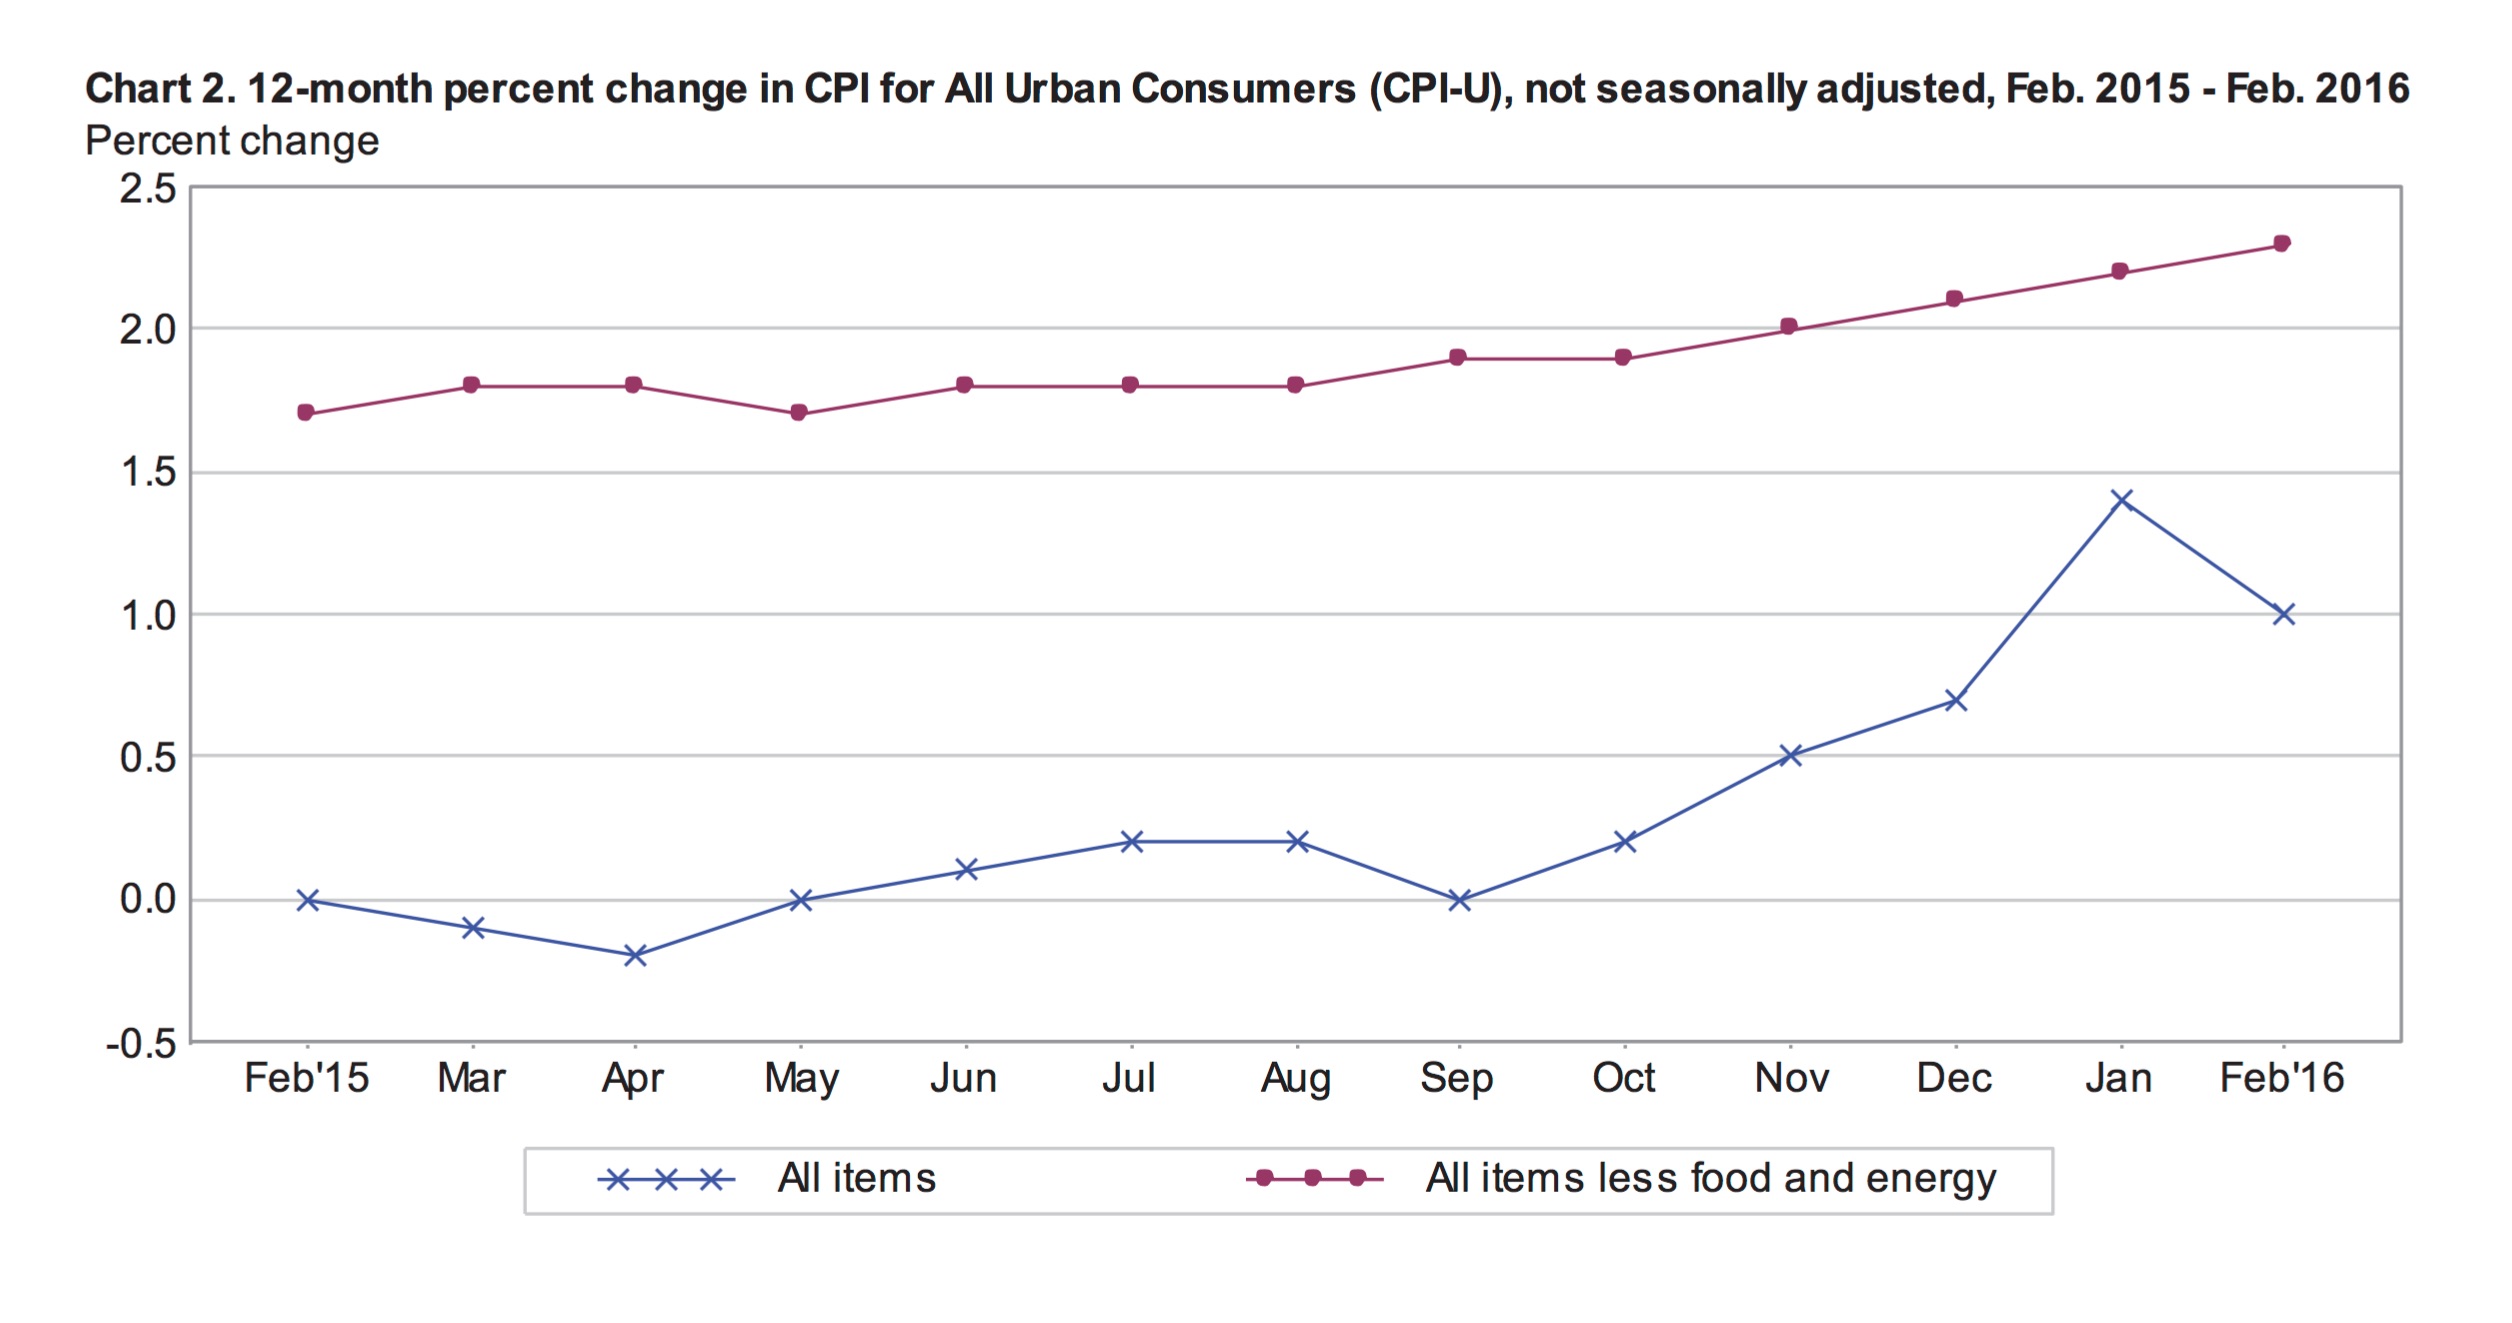
Headline inflation, measured by the Consumer Price Index for all Urban Consumers (CPI-U), was 1% for the year ending in February compared with 1.4% for the year ending in January. Prior to seasonal adjustments, consumer prices were reportedly up 0.1% in February and 0.2% in January. On a seasonally adjusted basis, the CPI-U fell 0.2% in February and was flat in January.
Today’s inflation report from the BLS was slightly stronger than expected. Gas prices plummeted 13% throughout the month to easily offset price pressure in other components of consumer spending such as rent and medical care. Stripping out the impact of declining energy prices, the index for all items less energy increased an annual 2.1% and climbed 0.3% in February with monthly seasonal adjustments. Core inflation (which eliminates both food and energy) was 0.3% for the month, marginally higher than the market’s forecast of 0.2%. Core prices appear to be gaining momentum.
Seasonally Adjusted Prices in February
February’s 13% decline in the cost of gasoline led to a 6% decline in the energy index. The energy index, which accounts for about 6.7% of total consumer spending, declined 2.8% in January. The cost of energy services was up 0.1% in February following two monthly declines of 0.7%. The price of utility services (piped gas) was significantly higher (1%) for the month following 5 months of consecutive declines. The transportation index slid 2.5% in February. The prices of new and used cars and trucks were higher while the index for motor vehicle parts and equipment slid 0.1%.
Seasonally Adjusted Monthly % Change in CPI-U by Category (2016)
| January | February | March | April | May | June | July |
| All Items | 0 | -0.2 | 0.1 | 0.4 | 0.2 | 0.2 | 0.0 |
| Food | 0 | 0.2 | -0.2 | 0.2 | -0.2 | -0.1 | 0.0 |
| Energy | -2.8 | -6.0 | 0.9 | 3.4 | 1.2 | 1.3 | -1.6 |
| Gasoline | -4.8 | -12.5 | 2.2 | 8.1 | 2.3 | 3.3 | -4.7 |
| Fuel Oil (non seasonally adjusted) | -6.5 | -2.9 | 1.7 | 1.9 | 6.2 | 3.7 | -1.5 |
| Electricity | -0.7 | -0.2 | 0.4 | -0.3 | -0.2 | -0.5 | 0.5 |
| Utilities (piped gas service) | -0.6 | 1.0 | -0.7 | 0.6 | 1.7 | -0.4 | 3.1 |
| Energy Services | -0.7 | 0.1 | 0.2 | -0.1 | 0.2 | -0.5 | 1.0 |
| All Items Less Food and Energy | 0.3 | 0.3 | 0.1 | 0.2 | 0.2 | 0.2 | 0.1 |
| Services Less Energy Services | 0.3 | 0.3 | 0.2 | 0.3 | 0.4 | 0.3 | 0.2 |
| Shelter | 0.3 | 0.3 | 0.2 | 0.3 | 0.4 | 0.3 | 0.2 |
| Transportation Services | 0.4 | 0.2 | 0.2 | 0.7 | 0.3 | 0.3 | -0.2 |
| Medical Care Services | 0.5 | 0.5 | 0.1 | 0.3 | 0.5 | 0.2 | 0.5 |
Every other major component of the CPI-U was higher in February after seasonal adjustments. The largest positive change was a 1.6% monthly increase in the price of apparel, which was also up 0.6% in January following 4 months of declines. In February, prices were mixed within the apparel sector with major moves in the prices for jewelry and watches, up 3.2% and 8.9% respectively.
The cost of food was 0.2% higher in February including a 0.1% increase in the cost of food away from home and 0.2% increase in the price of food at home. Notable hikes at the grocery store include the price of fresh whole chicken, up 2.2% for the month and fresh fruit, up 2.3%. At the same time, the index for bacon and related products was down 3.1% in February. The overall cost of meat declined for the third consecutive month, down 0.2%.
Shelter costs, which account for about one third of the overall price index, were 0.3% higher in February. Hotel costs and moving costs are included in the shelter index and were up 1% and 3.1% respectively. The index for household furnishing and supplies slipped 0.2% in February compared with a decline of 0.1% in January.
The medical care index was up 0.5% in February, matching January’s growth rate. The index for medical care commodities rose 0.6% in February following an increase of 0.4% in January. Higher medical commodity prices were impacted by a 1.1% monthly spike in the price of medicinal drugs. The medical care services index increased by 0.5% in February, in line with January. Health insurance was reportedly 1.3% more expensive in February following a price increase of 1.1% in January.
12-Month Inflation
Overall prices grew by 1% over the 12-months ending in February, well below both the Fed’s target inflation rate of 2% and January’s 12-month inflation rate of 1.4%. While commodity prices fell 1.6% year over year in February, the overall cost of services was up 2.6%.
Food prices rose 0.9% despite an annual decline in the cost of food at home, down 0.3%. For the year ending in February, the price of meat fell 4.8% and milk prices were down 5%, while eggs were 6% more expensive. Apples and tomatoes posted sharp gains, up 7.9% and 10.8% respectively. The index for food away from home was up 2.6% year over year, led by higher costs for food at schools
Overall medical care costs were 3.4% higher for the year. Medical services were up 3.9%, including 5.1% higher prices for hospital service costs. The transportation index fell 3.4% year over year despite a 5.1% climb in the index for motor vehicle insurance. A 12.5% annual decline in the energy index includes a 32.1% decline in the cost of fuel oil and a 20.7% decline in the price of gas.
Across the Country
For the year ending in February, large west cost cities experienced higher inflation than the rest of the country. LA and San Francisco posted annual inflation rates of 2.4% and 3.0% respectively and prices in Seattle were up 2.2%. Prices were up 0.7% in cities in the northeast, and only 0.4% in the midwest.
In February, the northeast posted 0.2% higher prices, above the national average. Prices in the midwest were reportedly flat for the month and larger urban areas in this region saw monthly declines. In Chicago, prices fell 0.2% in February.
Outlook for the Fed
Stronger than expected underlying price pressures, as indicated by February’s core monthly inflation, will support the Federal Reserve’s intention to continue increasing interest rates. While they are not likely to move rates today, the likelihood of a second rate hike in the first half of the year is growing. A strong US dollar and cheap energy has quelled inflation but these factors may be temporary. Momentum in the prices of shelter and medical care point to underlying economic strength.
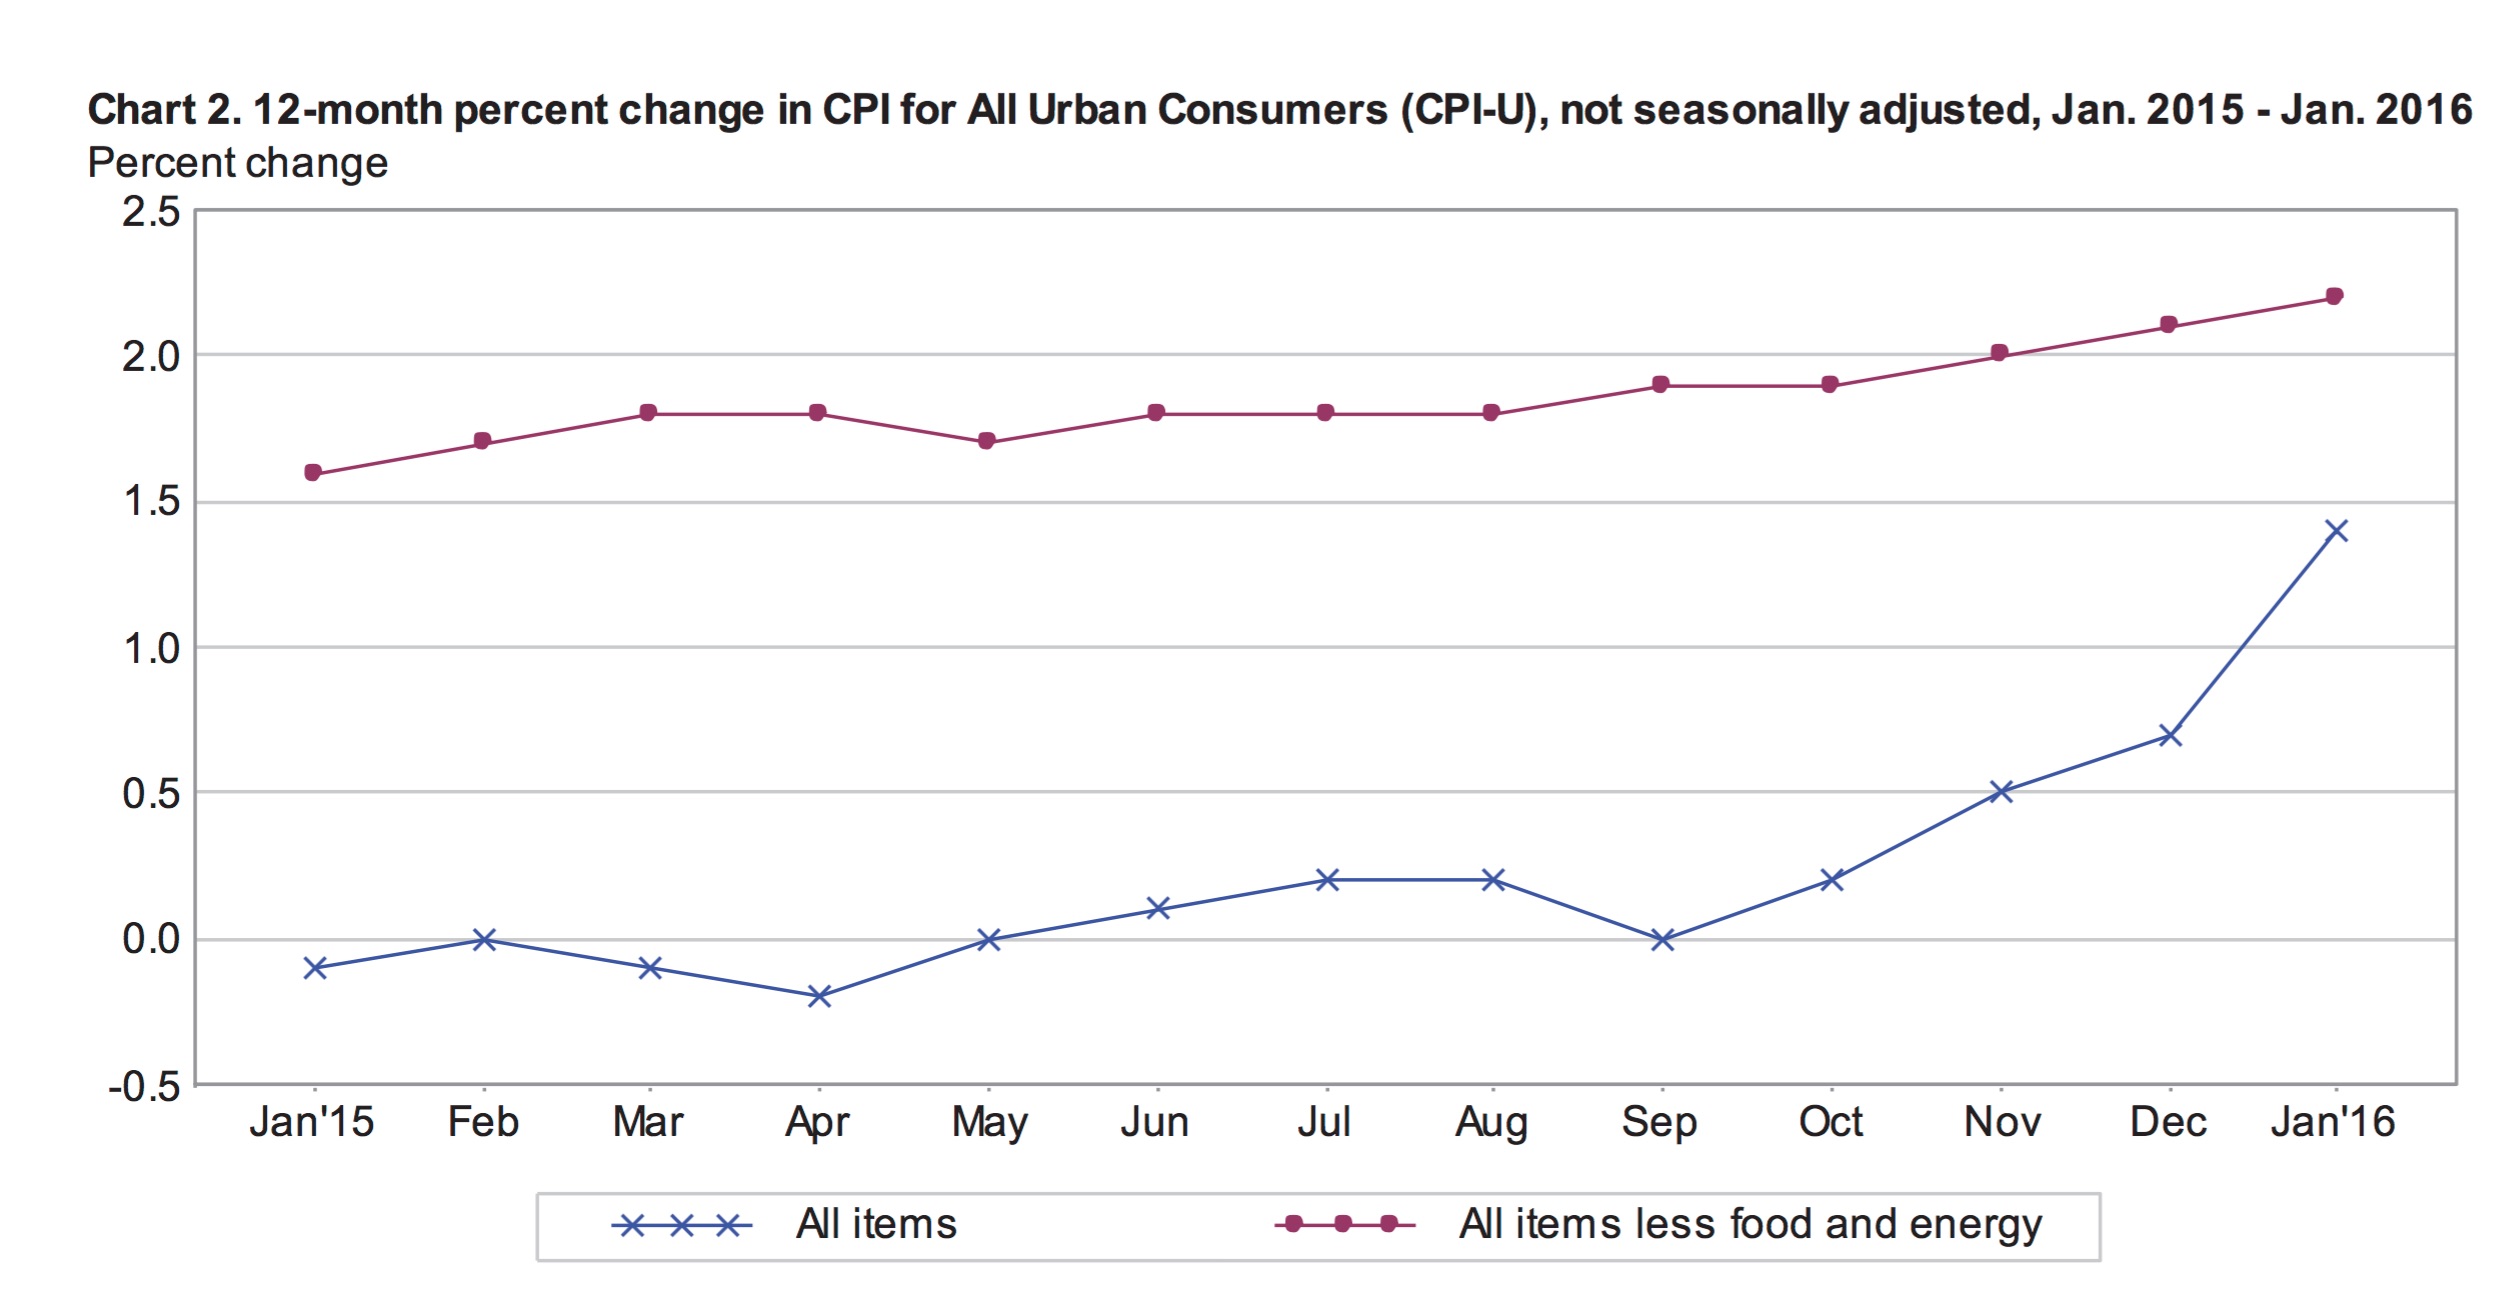
by Emily Cross Leon | Feb 22, 2016 | Definitions
According to the Bureau of Labor Statistics, consumer price levels, measured by the Consumer Price Index for All Urban Consumers (CPI-U), increased by 1.4% for the year ending in January compared to 0.7% for the year ending in December. After seasonal adjustments, the CPI-U was flat in January, following a decline of 0.1% in December. Falling energy prices were largely offset by higher shelter costs for the month.  Core inflation, measured by the index for all items less food and energy, climbed 0.3% in January and 2.2% for the year ending in January. This is marginally higher than the consensus expectations of 0.2% for the month and 2.1% for the year. January’s expectations were in line with December’s inflation numbers. The surprise acceleration in core price levels may reflect some underlying economic strength.
Annual Inflation
For the year ending in January, inflation was boosted by higher prices for shelter, medical services and transportation services. At the same time, sliding energy prices kept overall inflation levels relatively tame. The energy index was down 6.5% for the year ending in January and every component of the index declined. Year over year, fuel oil prices fell 28.7% and the gasoline index dropped 7.3%. The index for all items less energy climbed 2% for the year ending in January.
The food index inched up 0.8% for the year masking volatility within the index. The price of food at home slid 0.5% while food away from home was 2.7% more expensive. The price for food at employee sites and schools spiked 5.2% year over year. At the grocery store, meat prices fell 4.9%; milk was 7.2% cheaper; and the price of eggs increased by 6.8%. Fresh fruits and vegetables were 3.3% more expensive compared to a year earlier.
The cost of shelter, which accounts for approximately one third of the CPI-U, climbed 3.2% for the year ending in January and was the largest driver of overall inflation. The index for all items less shelter only grew by 0.5% year over year. Rental prices for primary residences were 3.7% higher in January compared with a year earlier. Over the same period, the index for health insurance jumped 4.8% and motor vehicle insurance climbed 5.4%.
Seasonally Adjusted Monthly Inflation
Every component of the energy index fell in January for the second month in row. Overall the energy index slipped 2.8% in January, including a 4.8% decline in the price of gas. These rates are identical to the changes in the energy and gas indexes in December. Energy and gas prices recorded marginal increases in October and November but appear to have resumed their downward path.
The food index was flat in January with all but one of the six major grocery store groups showing lower prices compared to the previous month. Fruits and vegetables cost 1.3% more in January versus December as tomato prices skyrocketed by 15.3%. The price of eggs tumbled 8.4% in January. Meat prices, particularly prices for beef and pork, also declined significantly over the month.
Shelter costs were 0.3% higher in January and helped balance falling energy prices. Other significant monthly growth was recorded for the medical care index, which climbed 0.5%. Medical insurance prices were up 1.1%. Apparel prices reversed their downward trend and rose 0.6% in January. The index for new vehicles increase by 0.3% while the index for used vehicles gained only 0.1%.
Outlook
The unexpected strength in January’s core inflation increases the likelihood that the Federal Reserve will raise interest rates sooner rather than later. Slow global growth and particularly slow growth in China, cheap oil and low domestic inflation have created skepticism about rate hikes this year. However, January’s annual core inflation rate of 2.2% is the highest recorded since June 2012 and is above the Federal Reserve’s target inflation rate of 2%.
Core inflation is considered to be a better gauge of underlying economic growth because the volatile, short-term price fluctuations within the energy and food components are eliminated. However, there is debate within the Federal Reserve regarding the true path of inflation and economic growth in the United States. A strong dollar drives down the price of imports, depressing inflation and higher rates will further lift the U.S. dollar. This would burden emerging economies and dampen global growth, which will impact the U.S. economy.
The Fed meets on March 15th and 16h to discuss monetary policy. It is unlikely that they will raise rates at that meeting. The futures markets are predicting that the chance of a rate hike this year is less than 40%.